The Economics of Sport
  • Sports Economics
  • About
  • Workshop
  • Selected Publications
  • Book Reviews
  • A Primer on Gaelic Games
  • Upcoming Events
  • Media
  • Education
  • Resources & Links
  • Data

Statistical Analysis of Brian O’Driscoll

31/3/2017

 
By Robbie Butler

Ireland's leading economic and applied social science journal Economic and Social Review has just published its volume for Spring 2017.

Amongst the contributions is a paper by Peter D. Lunn of The Economic and Social Research Institute and Trinity College Dublin and David Duffy of Property Industry Ireland called "Are Perceptions of Greatness Accurate? A Statistical Analysis of Brian O’Driscoll’s Contribution to the Irish Rugby Team".

The abstract reads as follows:
"We test whether public perceptions of Brian O’Driscoll’s greatness were accurate. O’Driscoll was an automatic selection for Ireland’s rugby team yet missed matches through injury, allowing us to treat injury as random. We estimate that O’Driscoll was worth a converted try per game and improved the chance of victory by more than home advantage. None of O’Driscoll’s Irish contemporaries made such a contribution. His impact also compares favourably with New Zealand’s best players of the era. Our estimates have implications for debates about wages in professional rugby. They also demonstrate how statistical techniques can be applied to an everyday issue, allowing us to conclude that perceptions of one Irishman’s greatness were warranted".

It seems O'Driscoll was just as important as we all believed!

​The full paper can be accessed here.
Behavioural Economics & Sports Data

29/3/2017

 
By David Butler

From time to time I get inquiries from students who are studying and researching concepts important to behavioural economics in the context of sport. This entry might be a help in getting started on the nexus.  The short list of five biases/fallacies and readings below is the largely created from email correspondences over the past few years. In time, hopefully I can flesh this out, creating a more detailed taxonomy and readings list for students. Part I below limits the concepts and readings to judgment and decision-making research.

It is important to note two points. The content below looks toward general behavioural concepts as the starting point and while some of the references here are old, they still represent important contributions. Secondly, the usual disclaimer applies -  the list definitely does not intend to provide an exhaustive account of all concepts studied or papers available.

Part I

Sport often offers a valuable domain to study the economics and psychology of decision making due to data accessibility (labour market data such as productivity and, at times, wage rates), methodological advantages (repeated but autonomous decision making occurs in well-defined environments) natural incentives (commonly monetary rewards are high) and the fact that sports stars have had an extensive opportunity to learn.

A good place to start considering a general connection between behavioural economics and sport in light of these advantages would be to consult the relatively recent paper by Pope and Schweitzer (2011) which asks Is Tiger Woods loss averse?

Pope, D. G., & Schweitzer, M. E. (2011). Is Tiger Woods loss averse? Persistent bias in the face of experience, competition, and high stakes. The American Economic Review, 101(1), 129-157.

Following on from this, here are brief and simplified explanations accompanied by some readings for specific biases/fallacies where sports data is used to investigate decision-making.  

1. The Conjunction Fallacy

The conjunction rule states that if one conjunctive event is composed of two primary events, the probability of this single event occurring cannot be greater than probability of either one of the two primary events occurring independently. A breach of this rule was most notably observed in Kahneman and Tversky’s  ‘Linda problem’ where the authors contend that choices can be obscured by a representativeness heuristic – a cognitive mechanism used to make probability judgments under uncertainty.   

Erceg, N., & Galić, Z. (2014). Overconfidence bias and conjunction fallacy in predicting outcomes of football matches. Journal of Economic Psychology, 42, 52-62.

Nilsson, H., & Andersson, P. (2010). Making the seemingly impossible appear possible: Effects of conjunction fallacies in evaluations of bets on football games. Journal of Economic Psychology, 31(2), 172-180.

2. The End-of-Day Effect

This bias occurs when individuals choose bets that have a lower probability of occurring but higher payoff in the later stages of a round of gambling. Prospect theory can accommodate this bias if gamblers form reference points in regards to their profit making - this reference profit is commonly zero. In the context of horse racing, If gamblers are incurring high loses by the last race of the day they can prefer to substitute away from gambling on favourites, choosing horses that have lower likelihood of wining in an effort to return to the reference point of zero

Ali, M. M. (1977). Probability and utility estimates for racetrack bettors. Journal of political Economy, 85(4), 803-815.

McGlothlin, W. H. (1956). Stability of choices among uncertain alternatives. The American Journal of Psychology, 604-615.

3. The Hot-Hand Fallacy

The hot-hand fallacy is a mistaken belief that if an individual successfully achieves an objective, this causes a greater chance of additional success in that activity for the short term future. The name for the term is derived from basketball, where fans and player alike often believe that their chances of success - scoring another basket - are higher following a previous score rather than a miss. It seems like a cottage industry has sprung up on this topic. A place to start is the review paper by Bar-Eli., Avugos, and Raab.

Bar-Eli, M., Avugos, S., & Raab, M. (2006). Twenty years of “hot hand” research: Review and critique. Psychology of Sport and Exercise, 7(6), 525-553.

4. The Sunk Cost Fallacy

A sunk cost fallacy or escalation effect is committed when a decision-maker holds constant or increases their commitment to a particular choice, despite marginal costs exceeding marginal benefits. When more efficient alternative choices are available, decision makers maintain a choice that associated costs cannot be recovered. Simply put, people irrationally cry over spilt milk.

Borland, J., Lee, L., & Macdonald, R. D. (2011). Escalation effects and the player draft in the AFL. Labour Economics, 18(3), 371-380.

Camerer, C. F., & Weber, R. A. (1999). The econometrics and behavioral economics of escalation of commitment: a re-examination of Staw and Hoang’s NBA data. Journal of Economic Behavior & Organization, 39(1), 59-82.

Staw, B. M., & Hoang, H. (1995). Sunk costs in the NBA: Why draft order affects playing time and survival in professional basketball. Administrative Science Quarterly, 474-494.

5. The Winner’s Curse

The winner’s curse is the tendency for individuals to overbid in common value auctions when information is not complete. This idea was originally conceptualized in light of auctions for oil reserves in the Mexican Gulf. Winning bids in an auction environment can exceed the value of the asset purchased or can produce returns that are less than expected.

Burger, J. D., & Walters, S. J. (2008). The existence and persistence of a winner's curse: new evidence from the (baseball) field. Southern Economic Journal, 232-245.

Cassing, J., & Douglas, R. W. (1980). Implications of the auction mechanism in baseball's free agent draft. Southern Economic Journal, 110-121.

Kahn, L. M. (1993). Free agency, long-term contracts and compensation in Major League Baseball: Estimates from panel data. The Review of Economics and Statistics, 157-164.

World Cup 2018 Qualification

27/3/2017

0 Comments

 
By Robbie Butler

At the start of the year I had an entry about the ever-expanding World Cup Finals and attempted to put some logic behind FIFA's plans to increase the number of teams at the Finals in 2026.

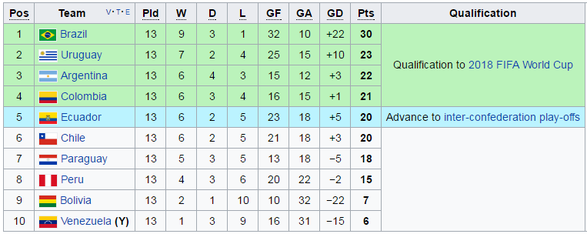
​Prior to this weekend's world cup qualifying fixtures, I read a Sky Sports article focusing on the potential of a World Cup without Argentina. Since the weekend, the chances of this have reduced thanks to a Lionel Messi penalty in a 1-0 win over Chile. The current qualifications standings are below.
Picture
Between 4 and 5 teams can qualify from this confederation. In percentage terms, this is far better than any other confederation. For example, if this were the end table, Ecuador could still qualify despite losing five games. No UEFA country could expect to qualify with this loss rate. Even controlling for the number of games played, five defeats in CONMEBOL qualifying would compare to almost 3 defeats in UEFA qualifying. I doubt any European country that loses three games will make a play-off, let alone qualify for the tournament in Russia.

The South America countries have things much more straight-forward, and not just over the European. The table below shows the percentage of countries that have qualified from each confederation since the World Cup 
Picture
​expanded to 32 teams in 1998. European countries have the second highest number of teams qualifying as a percentage of the number of entrants. 

The decision to increase the number of teams for further tournaments has been met with much criticism, and raised issues of the quality of teams that could now reach the finals. If 16 additional countries are to be given places, surely Africa, Asia, Oceania and North and Central American countries should be first in the queue. The quality may not improve but the distribution of places will be much closer to a model consistent with a "World Cup". 

0 Comments

Prutton's Predictions

24/3/2017

 
By David Butler

In the ‘more’ section of this website I follow the pundit, keeping an eye on the predictive success of two pundits who systematically predict premier league score lines.

After 268 predictions, Paul Merson (Sky Sports) has edged ahead of Mark Lawrenson (BBC). Both are still calling over half of the games correctly and are performing far better than last season. The typical pattern is emerging in terms of successful score line predictions - the pundits usually get one right scoreline per gameweek.

Over the last few months a new pundit for the Championship has come along. Former Southampton and Leeds player David Prutton has taken over from Ian Holloway. Often he also predicts the outcome of League 1 and League 2 games. How has he performed?

Out of 154 lower league prediction Prutton has called 19 correct scorelines (12%) and an additional 51 correct outcomes (33%). Prutton calls over half of the games incorrectly (55%). That's approximately 10% more wrong match predictions when compared to Merson and Lawrenson for this season’s Premier League. The two Premier league pundits are getting between 42%-45% wrong. His most popular predictions are 2-1 (29 observations) and 2-0 (28 observations) – this is probably a naive strategy as matches commonly only have one goal. He only predicts 9 games will end with only one goal scored.

Maybe Merson and Lawro have a greater level of expertise to Prutton…or maybe the outcomes of lower leagues are more challenging to predict.

Cheltenham Success and Funding

22/3/2017

 
By Robbie Butler

The 2017 Cheltenham Festival ended last Friday and proved to be a remarkable four days for horse racing in this country. Irish trained horses won 19 of the 28 races, beating last year’s previous best of 15. For the second year running there were more Irish trained winners than English, which is all the more remarkable given that “15 Irish winners or more” could be backed at odds of 4/1 as late as Tuesday morning. Irish trained horses won 3 or the top 4 prizes, and Ireland also dominated the leading trainer and jockey tables.

Much of this success can probably be put down to state investment in the sport. From 2008 to 2017 Revised Estimates of Public Expenditure show that the Horse and Greyhound Racing Fund was allocated just under €650 million through the Department of Arts, Sports and Tourism and more recently the Department of Agriculture, Food and the Marine. Of this, Horse Racing Ireland (HRI) received just over €500 million.

While national hunt racing is just one part of the sport, the majority of this funding is used to subsidise prize money at the 26 race courses on the island of Ireland. HRI support equates to roughly two-thirds of the prize fund, with owners, sponsors, funding from Northern Ireland and the European Breeders Fund contributing the remainder. The HRI 2016 Factbook discusses the recent improvement in most indicators in the sport, with only the trend in on-course bookmaker numbers a current cause for concern. The reason for this is largely explained by technological innovations and the resulting rise in online gambling.

The funding of horse racing can be compared to all other sports. Sport Ireland (formerly the Irish Sports Council) is partly responsible for these (their website lists more than 60 sports) and received just over €550 million for the ten-year period from 2008 to 2017. This includes payments to the National Sports Campus from 2012. This equates to a 94 cent investment in Horse Racing Ireland (administering a single sport), for every €1 investment in Sport Ireland, which covers everything from angling to wresting.

While the 2017 Revised Estimates indicate the Horse and Greyhound Racing Fund will surpass its pre-crash allocation this year, Sport Ireland will experience a drop in funding year-on-year. If the country wishes to replicate the remarkable performance of Irish national hunt racing in other sports, further investment in Sport Ireland should be a priority.

Continued success in the Cotswold can be expected in the years ahead.

Cheltenham 2017

20/3/2017

 
By Robbie Butler

As is normal for this week of the year, we turn our attention to Cheltenham. Over the past three years, I and others on this blog, have attempted to beat the market, with varying levels of success.

Since 2009 my record stands 3-5. Hopefully 2017 will make it 4-5.

In the past I have attempted to beat the market by selecting my own picks, following the favourite, and backing Willie Mullins and Ruby Walsh ridden horses.

My colleague John Considine has asked me to return to my picks for this year. I have obliged and will do my best.

Daily updates to follow. 

Day 1:
  • Bunk Off Early €1 each way.
  • Some Plan €1 each way.
  • Singlefarmpayment €2 win.
  • Footpad €1 each way.
  • Edwulf €1 each way.

Total stake €10.

Day 2:

Desperately unlucky on Day 1. Singlefarmpayment was beaten a nose and would have put us ahead for the week. Footpad finished 4th at 18-1 missing each-way money, while Edwulf looked certain to finish second jumping the last only to sadly break down in the final 200 yards.

It will be hard to turn this around now but picks for today are below.
  • Shattered Love €1 each way
  • Automated €1 each way
  • Bless The Wings €1 each way
  • Next Destination €1 each way

​Total stake €8.

Day 3:
An improvement on Day 2. Another day for the bookies but Bless the Wings and Next Destination collected each way money resulting in a return of €7, which almost covers the stake on the day. More required however. Day 3 selections below.
  • Golden Doyen €1 each way
  • Nichols Canyon €1 each way
  • Thomas Crapper €1 each way
  • Mall Dini €1 each way

Total Stake €8.
Day 4:
A very successful Day 3. Nichols Canyon won and Thomas Crapper took each way money. A return of €19.40 on the day has us slightly ahead for the week.
Picks for today below.
  • Bapaume €1 each way
  • Death Duty €2 win
  • Dell Arca €1 each way
  • Dodging Bullets €1 each way.

Just Bapaume collected on Day 4, finishing 3rd in the opener. This resulted in a return of €3 but a lost on the day.

Total Stake €8.​

Results

Stake for the Week €34.
Return for the Week ​€29.40.

Another win for the market. 

Attendance at the Cheltenham Festival 

13/3/2017

 
By David Butler

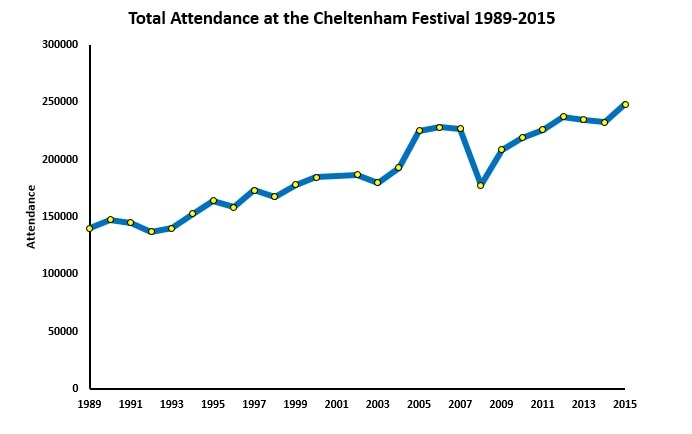
Recently RTE claimed that Irish racing fans are worth €22m to Cheltenham. The article also documents the increasing number of Irish runners and winners at the festival since 1998.  There has been a general trend of increasing crowds too.

The chart below shows the total attendance at the Cheltenham Festival 1989-2015. The expansion of the festival in 2005 to four days is a key factor in explaining this increasing trend. The blip in 2008 occurred because the second day of the Festival was cancelled due to stormy weather.
Picture
Gold Cup day has always attracted the biggest crowd of the festival. On average about 12,000-14,000 extra punters arrive for the big race in comparison to other days.  

The highest first day attendance was in 2015 when 63,251 gave the introductory roar. The second highest opening day figure was in 2002 – 62,296 was the recorded number. Given that the foot and mouth crisis caused the festival to be cancelled in 2001, absence may have made the heart grow fonder.

The biggest ever crowd to go through the turnstiles from 1989-2015 was on Gold Cup day on the 16th March 2012. 70,765 individuals saw the great Tony McCoy win the Gold Cup on the Jonjo O'Neill trained Synchronised.

Second Season Syndrome - Some Facts

10/3/2017

 
By David Butler

Bournemouth’s poor performance in the second half of the Premier League season has notably thrown up the idea of second season syndrome again in the media. In American sports a similar 'curse' is referred to as the sophomore slump or sophomore jinx.

I posted on this some years back but here’s an updated version.

There has been nine occurrences of second season syndrome in the Premier League. Middlesbrough (97/98), Bradford (00/01), Ipswich (01/02), West Brom (05/06), Reading (07/08), Hull (09/10), Birmingham (10/11), QPR (12/13) and Hull (14/15) have all cursed. All of these teams were promoted to the Premier League, survived for one season, and were relegated the next.

Should Eddie Howe be worried? Probably not. Actually he deserves credit for keeping Bournemouth in the Premier League in their first season – the maiden (not the second season) is the greatest challenge for promoted teams in the Premier League.

Since the Premier League became a 20-team competition in 1995, 27 of the promoted teams have occupied the 63 relegation places at the end of a season,  43%.

In one season were all three promoted teams relegated; this happened in 97/98 when Bolton Wanderers, Barnsley and Crystal Palace all went down.  It wasn’t until 01/02 that all three promoted teams actually avoided relegation; Fulham, Bolton Wanderers and Blackburn Rovers all avoided the drop. This has happened only once since – QPR, Swansea and Norwich performed a similar feat in the 11/12 season.

Second season syndrome has happened to just nine teams that have survived the first season. Furthermore, teams stricken by second season syndrome usually perform poorly in their first season. On closer inspection four out of the nine second season curses involved the promoted team finishing 17th in their first season, just avoiding the drop. This was the case for Bradford, West Brom, Hull (09/10) and QPR. The most recent case (Hull  14/15) saw the club struggle in to 16th, beating relegation by 4 points.  

Promoted teams often go straight back down. While second season syndrome might make for an interesting narrative, the most worried managers should probably be Aitor Karanka and Marco Silva.

Do Scoring Champions Win a Ring?

8/3/2017

 
By Stephen Brosnan

​This season, Russell Westbrook has been a phenomenon, averaging a triple double for Oklahoma City Thunder (OKC). A triple double is achieved when a player ends up in double figures for points, assists and rebounds in a particular match. To put this achievement into context, Oscar Robinson (1961-62) is the only player in history to average a triple double for the entire season. However, Westbrook’s team OKC are struggling in the Western Conference placed 7th. Previously, David Butler and John Eakins discussed (here) whether Golden Boot winners in Europe’s top four soccer leagues played for eventual league champions from 1992-2013. They show that only 28% of top goal scorers in each of the domestic league competitions played for the eventual champions. I decided to analyse whether these results are persistent across other sports namely, basketball.
​
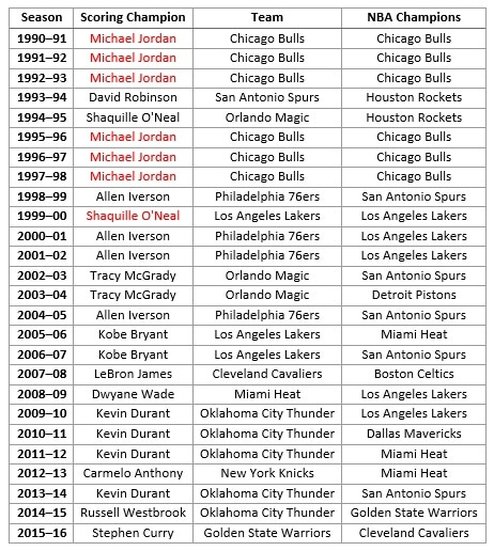
Table 1 shows the NBA Scoring Champions and NBA Champions between 1990 and 2016. 
Picture
Table 1 shows that rarely does the NBA scorer play with the eventual champions. In the 26 seasons included in the table, only seven times has the NBA Scoring champion played for the eventual NBA Champions. Thus 26.9% of NBA Scoring Champions have played for the NBA Champions during the period. This figure is very close to the 28% found in Europe’s soccer leagues. However, when we analyse the basketball data it becomes clear that an outlier exists, namely, Michael Jordan. Six of the seven times the scoring champion has become an NBA Champion it has been Michael Jordan (Shaquille O'Neal being the other in 99-00 for the LA Lakers).  Michael Jordan led the Chicago Bulls to their first Three-peat (3 back to back titles) between 1990 and 1993, subsequently retired for two years, only to come back and three-peat again.

Thus, the ‘Michael Jordan effect’ can be considered an exception rather than the rule. No player in the last 16 years has won both the NBA Scoring title and NBA Championship. So why is this the case? One possible explanation often used, with reference to Russell Westbrook, is that the reason a player becomes leading scorer in the league is that there teammates are not good enough so one player must take it upon himself to try and win games on his own. Whilst this approach most certainly boosts their own stats, once these teams reach the play-offs and come up against teams with more talent they will almost always be eliminated.

Rule Changes in Golf

6/3/2017

0 Comments

 
By Robbie Butler

The Royal and Ancient (R&A) and United States Golf Association last week announced proposals to make significant changes to the rules of golf. There are at present 34 rule in the sport, and if the proposals are permanently accepted, this will reduce the number of rules by 10, to just 24.

R&A’ executive director David Rickman says that such rules changes are motivated by the need to modernise the game and make golf easier to understand and play. A closer look at some of the key changes (courtsey of the Irish Times) is available here.

I noticed a commonality in some of the changes, that have also been adopted in other sports, that of the speed of the game. David Butler has previously considered the rise of instant gratification in sport with reference to Fast4 Tennis. One need only look at cricket to see how the sport's organisers have attempted to make the game faster and more exciting, with the move from 5 day cricket, to 1 day cricket, to T20 cricket. Power Snooker is an attempt by World Snooker to make their sport more exciting, by speeding up play.

This is what many of the golf rule changes target; explicitly and implicitly. The reduction in ball searching time from 5 to 3 minutes, and the recommendation that players take no longer than 40 seconds to play a shot, will instantly impact the speed of play.

Relaxed rules on the putting surface will also make the game faster, as pins do not need to be removed before putting. Additionally, it will be possible to play out of turn in stroke play. Traditionally viewed as disrespectful, this will prevent excessive and sometimes unnecessary waiting times, and should get players around the course faster.

The R&A and USGA must be a little worried. We live in a world where many people constantly require instant results. I remember listening to Curtly Ambrose bowl over after over for the West Indies against England in a Test Match at the Oval on BBC Radio 5 Live. Yes radio! After 4.5 days the game ended in a draw because of rain.

Delayed gratification is tough but I'd take it any day over some of the faster outcomes evolving in sports we see today.
0 Comments
<<Previous

    Archives

    March 2023
    February 2023
    January 2023
    December 2022
    November 2022
    October 2022
    September 2022
    August 2022
    July 2022
    June 2022
    May 2022
    April 2022
    March 2022
    February 2022
    January 2022
    December 2021
    November 2021
    October 2021
    September 2021
    August 2021
    July 2021
    June 2021
    May 2021
    April 2021
    March 2021
    February 2021
    January 2021
    December 2020
    November 2020
    October 2020
    September 2020
    August 2020
    July 2020
    June 2020
    May 2020
    April 2020
    March 2020
    February 2020
    January 2020
    December 2019
    November 2019
    October 2019
    September 2019
    August 2019
    June 2019
    May 2019
    April 2019
    March 2019
    February 2019
    January 2019
    December 2018
    November 2018
    October 2018
    September 2018
    August 2018
    July 2018
    June 2018
    May 2018
    April 2018
    March 2018
    February 2018
    January 2018
    December 2017
    November 2017
    October 2017
    September 2017
    August 2017
    July 2017
    June 2017
    May 2017
    April 2017
    March 2017
    February 2017
    January 2017
    December 2016
    November 2016
    October 2016
    September 2016
    August 2016
    July 2016
    June 2016
    May 2016
    April 2016
    March 2016
    February 2016
    January 2016
    December 2015
    November 2015
    October 2015
    September 2015
    August 2015
    July 2015
    June 2015
    May 2015
    April 2015
    March 2015
    February 2015
    January 2015
    December 2014
    November 2014
    October 2014
    September 2014
    August 2014
    July 2014
    June 2014
    May 2014
    April 2014
    March 2014
    February 2014
    January 2014
    December 2013
    November 2013
    October 2013
    September 2013
    August 2013
    July 2013

    About

    This website was founded in July 2013.

    RSS Feed

    Categories

    All
    American Football
    Athletics
    Baseball
    Basketball
    Behavioural Economics
    Boxing
    Broadcasting
    Competitive Balance
    Cricket
    Cycling
    Darts
    David Butler
    Declan Jordan
    Drugs
    Ed Valentine
    Epl
    Esports
    Expenditure
    F1
    Fifa World Cup
    Finances
    Funding
    Gaa
    Gaelic Games
    Gambling
    Game Theory
    Gary Burns
    Geography
    Golf
    Greyhound Racing
    Guest Posts
    Horse Racing
    Impact Studies
    John Considine
    John Eakins
    League Of Ireland
    Location
    Media
    Mls
    Mma
    Olympics
    Participation
    Paul O'Sullivan
    Premier League
    Regulation
    Research
    Robbie Butler
    Rugby
    Simpsonomics
    Snooker
    Soccer
    Spatial Analysis
    Sporting Bodies
    Stephen Brosnan
    Swimming
    Taxation
    Teaching
    Technology
    Tennis
    Transfers
    Uefa
    Ufc
    World Cup
    Wwe

Related

The website is not formally affiliated to any institution and all of the entries represent the personal views and opinions of an individual contributor. The website operates on a not-for-profit basis. For this reason we decline all advertisement opportunities. 

Contact

To contact us email sportseconomics2013@gmail.com or find us on Twitter @SportEcon.