The Economics of Sport
  • Sports Economics
  • About
  • Workshop
  • Selected Publications
  • Book Reviews
  • A Primer on Gaelic Games
  • Upcoming Events
  • Media
  • Education
  • Resources & Links
  • Data

Thresholds in the EPL

28/4/2017

 
By David Butler

Golden numbers, essentially representing a points threshold, are on the minds of many football fans at this time of year. Football seems to become even more of a numbers game as ‘squeeky bum time’ sets in.

To starve off relegation the magic 40-point mark is often mentioned. For Champions League qualification it’s commonly 70. These numbers are almost viewed as targets which will (almost) guarantee a desired outcome. With the exception of West Ham, who were relegated in 02-03 with 42 points, no team has gone down with 40+.  On a rare occasion 70 points has not guaranteed Champions League entry (in 12/13 and 13/14 Everton and Spurs reached 72 points but were only 5th).

The tables below show the performance of the club in three respective positions over the applicable years  - 1st, 4th and 17th.
Picture
Picture
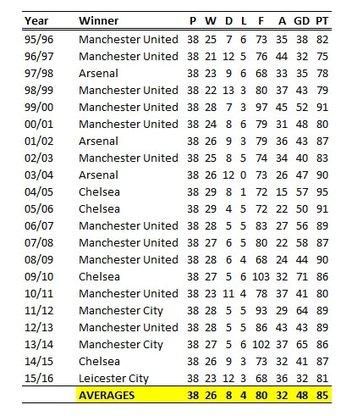
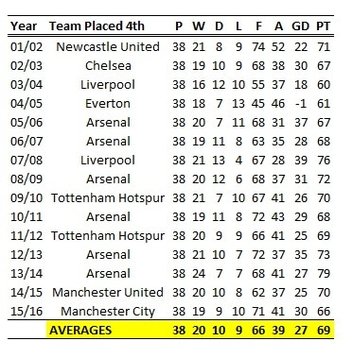
On average, 85 points has been enough to secure the league while the average number to reach for champions league qualification is 69. The race is hotter for fourth this year though, so I think a higher total will be required.
Picture
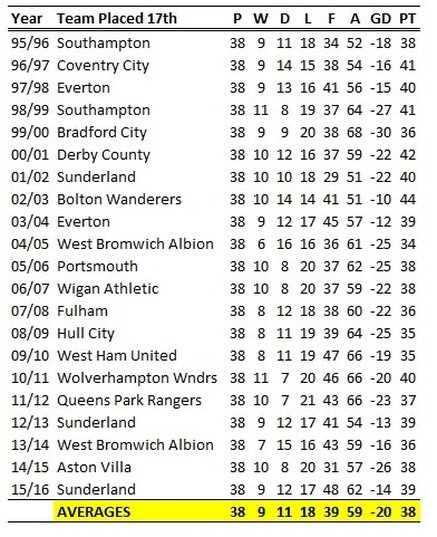
In terms of relegation, Middlesbrough and Sunderland look destined for the drop - even if the two win all remaining matches they can't reach 40 points.

The final relegation spot seems to be a two-horse race between Hull and Swansea, saving a complete Burnley collapse in the last four matches.

Both Hull and Swansea have the nine wins needed on average to survive but really have failed to carve out enough draws so far -  Hull are five points off the 38 mark, Swansea are seven. Both clubs have away trips this weekend to Southampton and Manchester United respectively.

If Swansea are defeated at Old Trafford this weekend, it will really seem like they are running out of matches and would need 7 points out of 9 to reach the 38 point average- that's a big ask and is reflected in bookmaker odds, Swansea are 1/2 to go down.


How Many People Play Soccer in Ireland?

26/4/2017

 
By Robbie Butler

How many people play soccer in Ireland? This is a question that I have been asked before, and like most questions that appear straightforward, the answer is very hard to know. In fact, it is impossible to be certain given the many ways the sport can be played. Here’s my best shot.

According to Sport Ireland’s Irish Sports Monitor (ISM) Annual Report 2015, 4.8% of those aged 16+ said they played soccer at least once a week. The population of those 16+ is just over 3.5 million so this gives an estimate of around 170,000 players per week.

To break this down further, I considered the overall context in which sport is played. The ISM provides four categories; on own (42.7% in 2015), organised training (31.3%), causally with friends/family (24%) and organised competition (7.7%).

It gets a little tricky here because I doubt anyone replying to soccer said they played “on own”. This leaves us with three categories; (1) organised training, (2) causally with friends/family and (3) organised competition. I assume that (2) refers to astro football, five-a-side, indoor, and other players of the like, while (3) are FAI registered players. Category (1) (training) needed to be spread across both. The ratio of causal to organised play is 3:1. I split (1) this way. This leave a following breakdown of 24.64% formal players and 75.36% informal players.
​
Based on 170,000 players per week this means there are 128,610 informal players and 42,057 formal players. I would add, this is not 170,000 different people. I suspect almost every registered player also plays informally.

The CSO’s Quarterly National Household Survey (QNHS) 2013 figures are more optimistic and suggest 13.2% of those aged 15+ play soccer. Based on population stats, this is 470,000 approx.

The QNHS describes the categories of play as Informal/casual (41.2%), Organised activities (29.7%), Organised competition (28.9%) and Professional/semi-professional (0.2%). If we assume astro, 5-a-side, etc. are Informal/casual and Organised activities, and Organised competition and Professional/semi-professional are registered players, it means 29.1% of players are formally registered, with the remaining 70.96% informal. This isn’t too far off the ISM estimate.

Based on 470,000 players, this means there are 332,757 informal players and 136,576 registered players over 15 years of age. Again, this is not 470,000 different people as I suspect there is large cross-over. These figures are larger than the ISM figures as the latter assumes players are playing on a more regular basis.

I was able to test the accuracy of the 136,576 figure using FIFA’s Big Count Survey from 2006. The report said Ireland had 6,000 clubs. Not all have adults’ teams, and some would have multiple (so this is crude) but the figures would suggest an average of 23 players per club. 

Opportunity Cost Fantasy Football Style 3

21/4/2017

0 Comments

 
By Robbie Butler

Over the past couple of years I have demonstrated how economics teachers can use the Premier League's Fantasy Football game to explain the concept of opportunity cost. My two previous attempts can be found here and here.

To repeat, opportunity cost is one of the most fundamental concepts in economics. Put simply, opportunity cost is what you give up to get something else. Fantasy Football has a clear budget constraint of £100 million pounds which makes it possible to consider the concept. While one might like to buy a Hazard, Sanchez and Kane, it may not be possible as 15 players in total must be purchased. What must one give up to afford these stars?

At this point in the season it becomes clearer which players are 'performing' as the game has predicted. The highest scoring team today is presented first below, while the most expensive is presented after this (note prices do adjust marginally with performance during the season).
Picture
Source: https://fantasy.premierleague.com/
Picture
Source: https://fantasy.premierleague.com/
Neither team is attainable. The first costs £122.6 million and the second £132.9. This is quite different to last season when the best performing team cost just over the £100 million threshold at £101.3 million. But then, last season was hardly a 'normal' occurrence.

8 of the best performers are also on the most expensive in their position list. Overpriced stars include the likes of Bellerin, De Bruyne, Ozil, Aguero and Zlatan. Food for thought for players of the game.
0 Comments

Irish Horse Racing and Brexit

20/4/2017

0 Comments

 
By Robbie Butler

RTÉ's Conor McMorrow has written a fascinating piece about the potential impact Brexit could have on the Irish horse racing industry. He cites Horse Racing Ireland Chief Executive Brian Kavanagh who says Brexit is a "huge concern" for the industry on the island of Ireland.

The piece suggests the industry supports 14,000 jobs, attracts more than 80,000 international visitors and is worth €1 billions to the economy. The all-island nature of the sport of kings means it is exposed more than most to the effects of Brexit, as is Ireland's multi-million euro bloodstock industry, with 65% of all horses exported to the UK.

The full piece can be read here and includes comments from top trainer Dermot Weld.

0 Comments

'Non-finishers' & the Evolution of the Grand National

10/4/2017

 
By David Butler

One For Arthur scooped £561,300 for winning the 2017 Grand National at Aintree last Saturday. This was the first year that ITV broadcast the race live and it was interesting to see their specific footage which was dedicated to horse welfare.

Over the years things have changed somewhat. It's nearly 25 years since animal rights protesters invaded the course prior to the race causing major confusion. In particular, the  Grand National course is less gruelling and the fence heights have been adjusted.  

Only three horses fell last Saturday. Cocktails At Dawn fell at the first fence - Nico de Boinville may have taken off too fast. The Young Master fell at Becher's Brook and Saphir Du Rheu fell at the 11th fence. Since 1970, this is the joint-second lowest amount of fallers for the race (only 2 horses fell in 2013).

Usually more than half of the entrants don’t reach the finishing post. While the proportion of non-finishers has remained relatively constant over the years, the reasons why horses don’t get around have changed.

This bears out in the data since 1970. The trends below reveals a pattern – fewer horses are falling and more are pulling up. A logic to explain this could be that those pulling up now, could have fallen in the past and would have struggled to get over the more taxing fences. There could be other factors too – perhaps jockey skill has improved or maybe they are taking less risks with horses.

Maybe this trend will put those concerned with horse welfare at ease. Also it might calm gamblers nerves - seeing your horse pull-up gives a sense of closure I suppose. If they fall however your always left with the ‘what if’…
Picture

Grand National Times

5/4/2017

 
By Robbie Butler

I think most people would agree that the performance of sports teams and individuals has improved over time. One need only look at old footage of any sport, team based or individual, to witness how fitness, physique, athleticism, stamina and technique have all improved. This is in no way to dimisnish the greats of the past, who may have achieved the same results, or possibly even better, had they access to the same improvements in technology, coaching, and sports science, etc.

Improvements in individual sports are often easier to spot than team-based ones. This is because there is usually a world record time, distance, weight etc. This way it is easier to compare contestants through time. Remarkably, Jesse Owens' world record from 1936 is 0.04 short of today's Olympic qualifying time of 10.16 seconds.

One sport where times have remained largely stable is horse racing. I previously compared Derby Times to the Tour de France and illustrated the remarkable stability in horses since WW2. Given that the world's oldest handicap steeplechase, the Grand National is on this Saturday, I thought it was appropriate to consider the winning time of each race for the past 50 years.
Picture
Similar to the Derby, Grand National times have remained relatively constant through time. Since Foinavon's remarkable win fifty years ago this year, there has been only a slight improvement in the performance (as measured by the trend). It took Red Marauder and Richard Guest 11 minutes to win the race in 2001, albeit in bottomless ground. 

25 horses since 1967 ran the race faster than last year's winner Rule The World. This includes winners from 1973, 1974, 1976, 1981 and 1982. 

The Resting of Players in Team Sports – Business interests vs Sporting interests

5/4/2017

 
By Stephen Brosnan

The strategic resting of key players for particular matches is becoming more persistent in a variety of team sports. In 2016, the Football League announced fines totalling £60,000 for 12 clubs who contravened rules over fielding their strongest teams in this season’s Checkatrade Trophy. Previously, the Premier League voted to loosen the rules regarding player selection following fines issued to Wolverhampton Wanderers and Blackpool for fielding weakened XIs in defeats to Manchester United and Aston Villa in 2011.

Soccer is not the only sport where this issue has gained increasing coverage in the national media. Recently, the National Basketball League (NBA) Commissioner, Adam Silver, sent a memo to the league's board of governors, outlining the way teams are choosing to rest starters in some games as “an extremely significant issue for our league”. Furthermore, Silver insisted that owners should be more involved in the decision-making process as “decisions of this kind ... can affect fans and business partners, impact our reputation and damage the perception of our game”.

This issue seems to be a conflict of competing interests with individuals responding to competing incentives. On the one hand, fans have complained that they have paid a premium price to see stars play, then arrived at arenas only to find that those players are getting the game off. Furthermore, networks have paid $24 billion to the NBA in the latest television contract negotiations and expect the top talent to feature in televised games. On the other hand, head coaches and the players (particularly with the top teams) feel that their priority is performing in the end of season playoff series rather than the 82 regular season games.

Lebron James, widely considered the best player in the NBA, has recently said “I don't think the NBA can do anything about it”. However, the amount of revenue at stake may lead to the NBA attempting to influence coaching decisions further which has important implications namely whether business interests may impact coaches’ autonomy over implementing competitive strategies to enhance a team’s chances of success.

French Top 14 rugby and Losing Bonus Points revisited

3/4/2017

 
By John Eakins

It’s over two and half years since I wrote the following article on the change in the losing bonus points rule in France’s Top 14 rugby competition. To re-cap quickly, since the beginning of the 2014/15 season, a losing team must be within 5 points rather than 7 in order to get a losing bonus point. The argument was that such a change would promote more positive play in the closing stages of games if teams had to do more to get a losing bonus point. For example if a team was 10 points behind in a game they would need only a penalty or drop goal in the old scenario, whereas now they need a try.

Given that close to three seasons has passed since its introduction it is opportune to examine the initial effects of the rule change. Figure 1 below plots the average losing bonus points per game in the Top 14 league as well as comparable data from the Pro 12 Celtic League and the English Premiership. As can be seen in the figure the average number of losing bonus points has actually fallen in France since the 2014/15 season while values in the other two leagues have remained relatively stable.

Picture
In some ways this is to be expected. What has effectively happened is that it is now harder to get a losing bonus point. But the question is whether the objective of the rule change has been met or not. If the average number of losing bonus points remained steady then in ‘real’ terms, teams are working harder. This therefore doesn’t appear to be the case. Then again these figures may not present the full picture. There may be many instances where teams looked for a bonus point with positive play but didn’t get it (although on the flip side, this was also presumably the case before the rule change).

Another point of relevance is whether the rule change has created an inequality between the top teams and the bottom teams. That is, the fact that teams have to work harder to get a losing bonus point may be a greater disadvantage to the teams at the bottom of the league. Figure 2 breaks down the Top 14 data in figure 1 into the top 7 and bottom 7 teams as per finishing position in each season. Prior to the rule change (using seasons 2007/08 to 2013/14) the top 7 teams won 0.37 losing bonus point on average while the bottom 7 teams won 0.46. After the rule change (using seasons 2014/15 to 2016/17) the figures were 0.30 and 0.32 respectively. So there is perhaps some evidence to suggest that rule change has had a disproportionate effect on lower ranked teams.
Picture

    Archives

    February 2023
    January 2023
    December 2022
    November 2022
    October 2022
    September 2022
    August 2022
    July 2022
    June 2022
    May 2022
    April 2022
    March 2022
    February 2022
    January 2022
    December 2021
    November 2021
    October 2021
    September 2021
    August 2021
    July 2021
    June 2021
    May 2021
    April 2021
    March 2021
    February 2021
    January 2021
    December 2020
    November 2020
    October 2020
    September 2020
    August 2020
    July 2020
    June 2020
    May 2020
    April 2020
    March 2020
    February 2020
    January 2020
    December 2019
    November 2019
    October 2019
    September 2019
    August 2019
    June 2019
    May 2019
    April 2019
    March 2019
    February 2019
    January 2019
    December 2018
    November 2018
    October 2018
    September 2018
    August 2018
    July 2018
    June 2018
    May 2018
    April 2018
    March 2018
    February 2018
    January 2018
    December 2017
    November 2017
    October 2017
    September 2017
    August 2017
    July 2017
    June 2017
    May 2017
    April 2017
    March 2017
    February 2017
    January 2017
    December 2016
    November 2016
    October 2016
    September 2016
    August 2016
    July 2016
    June 2016
    May 2016
    April 2016
    March 2016
    February 2016
    January 2016
    December 2015
    November 2015
    October 2015
    September 2015
    August 2015
    July 2015
    June 2015
    May 2015
    April 2015
    March 2015
    February 2015
    January 2015
    December 2014
    November 2014
    October 2014
    September 2014
    August 2014
    July 2014
    June 2014
    May 2014
    April 2014
    March 2014
    February 2014
    January 2014
    December 2013
    November 2013
    October 2013
    September 2013
    August 2013
    July 2013

    About

    This website was founded in July 2013.

    RSS Feed

    Categories

    All
    American Football
    Athletics
    Baseball
    Basketball
    Behavioural Economics
    Boxing
    Broadcasting
    Competitive Balance
    Cricket
    Cycling
    Darts
    David Butler
    Declan Jordan
    Drugs
    Ed Valentine
    Epl
    Esports
    Expenditure
    F1
    Fifa World Cup
    Finances
    Funding
    Gaa
    Gaelic Games
    Gambling
    Game Theory
    Gary Burns
    Geography
    Golf
    Greyhound Racing
    Guest Posts
    Horse Racing
    Impact Studies
    John Considine
    John Eakins
    League Of Ireland
    Location
    Media
    Mls
    Mma
    Olympics
    Participation
    Paul O'Sullivan
    Premier League
    Regulation
    Research
    Robbie Butler
    Rugby
    Simpsonomics
    Snooker
    Soccer
    Spatial Analysis
    Sporting Bodies
    Stephen Brosnan
    Swimming
    Taxation
    Teaching
    Technology
    Tennis
    Transfers
    Uefa
    Ufc
    World Cup
    Wwe

Related

The website is not formally affiliated to any institution and all of the entries represent the personal views and opinions of an individual contributor. The website operates on a not-for-profit basis. For this reason we decline all advertisement opportunities. 

Contact

To contact us email sportseconomics2013@gmail.com or find us on Twitter @SportEcon.