The Economics of Sport
  • Sports Economics
  • About
  • Workshop
  • Selected Publications
  • Book Reviews
  • A Primer on Gaelic Games
  • Upcoming Events
  • Media
  • Education
  • Resources & Links
  • Data

Listenership Figures for Sports Programmes

31/1/2014

0 Comments

 
By John Considine
Yesterday, the latest set of quarterly radio listenership figures, produced by the Joint National Listenership Research (JNLR), were released.  The 2013 Q4 figures are positive for most sports programmes.
Picture
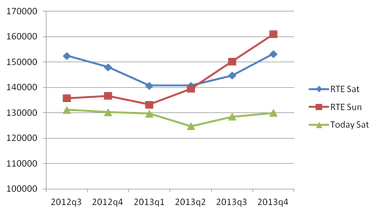
The figure opposite shows the 4-quarter moving average for three weekend sports programmes, namely, RTE Saturday Sport, RTE Sunday Sport, and Today FM’s Saturday Sports programme.  The moving average turned up for all three programmes. The increase is biggest for the RTE programmes as these programmes are up by 25% to 30% on Q4 2012.
 
The biggest winner in the battle of the weeknight sports programmes is NewsTalk's Off-the-Ball.  The 2013 Q4 figures for the programme are up over 10% on the same quarter from 2012.  These figures must be hugely satisfying for Ger Gilroy and the new team of presenters on the programme.  It is 11 months since the programme lost what seemed like an irreplacable group of presenters in Eoin McDevitt, Ken Early and Ciaran Murphy.

Not only did the NewsTalk programme have to deal with losing its presenters, it also had to deal with a new competitor.  It is 12 months since RTE 2fm have started broadcasting its sports programme Game On.  Game On competes with Off-the-Ball during the 7-8pm timeslot (although Off-the-Ball runs on until 10pm).  Game On continues to draw over 20,000 listeners.  Its 21,000 listeners for 2013 Q4 is the same as the figure for 2013 Q3.

The figures for this post are taken from the excellent media blog ilevel.ie.
0 Comments

Will Big Buck’s earn me ‘big bucks’ in March?

30/1/2014

 
By Paul O'Sullivan
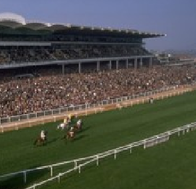
In a recent post, Robbie Butler referred to how brilliant two-mile hurdler Hurricane Fly won his 19th grade one race in Leopardstown last weekend. For racing fans, another major event last weekend was the return to action of three-mile hurdler Big Buck’s at Cheltenham after a lay-off of over 400 days. Prior to his injury, Big Buck’s had won his previous 18 races, while his starting odds in his previous 15 races had never been greater than 5/6 and was often heavily odds-on. It was not to be a dream comeback, however, as Big Buck’s, who went off as 6/5 favourite, was narrowly beaten into third place by two horses that he would surely have beaten prior to his injury.
Picture
Much effort went into analysing the horse’s performance. Some blamed his new jockey, Sam Twiston-Davies, for taking the lead too soon. Others blamed the heavy ground combined with the long lay-off for Big Buck’s not storming up the Cheltenham hill in his usual style. Whatever the reason, the effect has been to see his odds for the World Hurdle in Cheltenham in March, a race he has previously won four times, be as high as 9/4 with Paddy Power, while he is trading at 3.15 (equivalent to just under 11/5) on Betfair.

So, should I lump on Big Buck’s given his relatively high odds, or are the odds an accurate reflection of his chances? While I am a follower of national hunt racing, no one will, or should, ever mistake me for an expert on the sport.

I guess it comes down to how one reads his performance last Saturday. To me, it depends on what was the objective of his trainer, Paul Nicholls. If the objective was to win the race, the easiest thing would have been to sit behind the leader and then strike for home when turning into the straight. This may have led to a different result. However, by doing just enough to win the race, Nicholls may not have learned as much about the true condition of the horse. Winning may have suggested that all was well, which may have affected Nicholls’ training plans, and the horse’s true condition may not have been discovered until March, at which point it may have been too late.

On the other hand, Nicholls may have wanted to give Big Buck’s as stern a test as possible, and was prepared to risk losing the race in order to get a better picture of how fit his horse was. Nicholls’ statements after the race (see here) would, on the face of it, seem to back this up. Given his performance, it is to be expected that Big Buck’s will improve for the run and will be in much better condition with another six weeks of preparation. Having said that, if he has no race prior to Cheltenham, fans will be wary of the dreaded ‘bounce’, where a horse returning after a long lay-off
produces a poor second effort following a promising return.

Given how well he travelled for the vast majority of the race, I think odds of 11/5 and 9/4 are very attractive for a horse of Big Buck’s class. An ante-post bet is very likely.

Goals Scored & Premier League Winners

29/1/2014

 
By David Butler

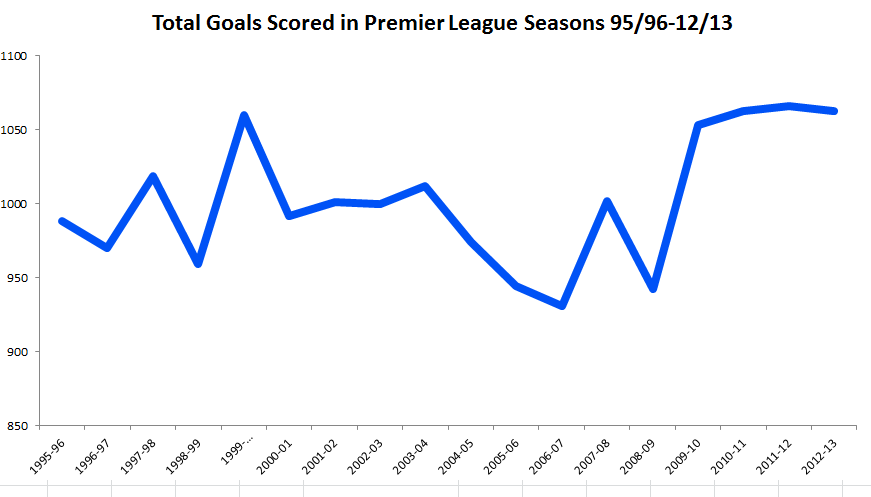
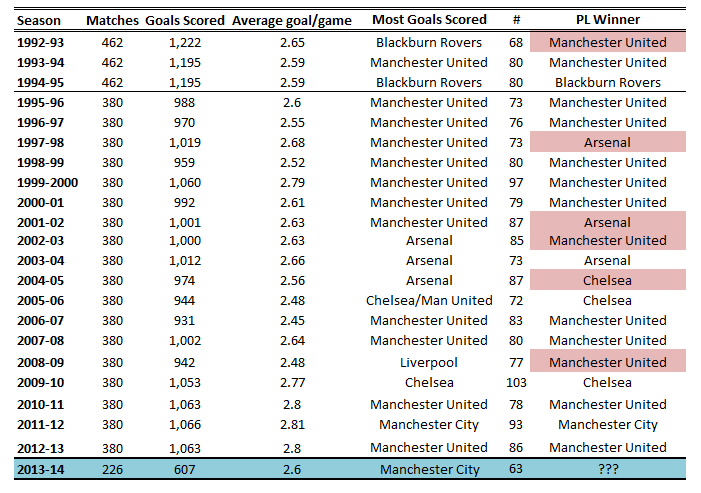
Below is a table showing the total goals scored in Premier League seasons since 92-93 and a graph of the data for completed seasons since 95-96 (when the league was reduced to 20 teams) to 12-13.

There has been a significant increase in goals scored over the past number of years and since 92-93 71.5% of Premier League winners also scored the most goals in a season. Only 6 times (28.5%) has a team won the Premier League and not scored the most goals. After 226 matches in the 13-14 season 607 goals have been scored in total. 

As of today, Man City (before the Tottenham game) lead the way for 13-14 with a remarkable 63 (10% of total) goals so far.

Given the stats maybe it’s time for Man City fans to get excited.

Picture
Picture

The Relative Importance of the Broadcasting Revenue Stream

29/1/2014

0 Comments

 
By John Considine
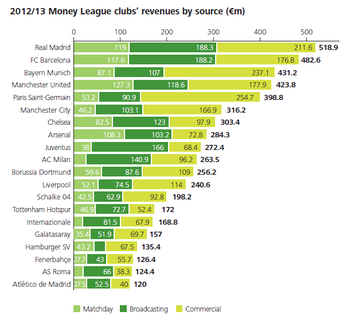
The Deloitte Football Money League (DFML) presents a list of the Top 20 clubs by revenue.  The big news this year was that Manchester United had slipped outside the top three for the first time in the 17-year publication of the report. The report also carries information on the benefits of different revenue streams to the clubs.  In this post I will focus on the benefits of broadcasting rights to the clubs.
Picture
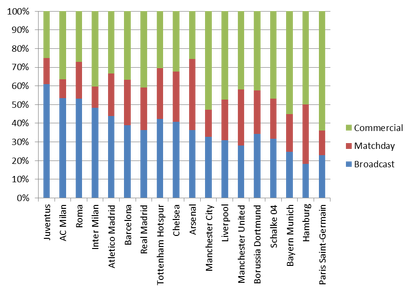
The figure opposite outlines the proportion of each club’s revenue that comes from broadcast, matchday and commercial revenue streams.  With the focus on broadcast revenues, the clubs are ordered by country with the Italians on the left, followed by the Spanish, English, German and French.  This ordering roughly corresponds to the relative importance of broadcast revenue to the clubs.

It might seem strange to have the Italian clubs lead the list because, with the exception of Juventus, they are sliding down the DFML.  Of course, the importance of broadcasting could also represent the relative importance of the other income streams.  For example, the small matchday revenues (possibly attributed to stadium ownership) for Italian clubs makes the broadcast  revenues seem more important.  While Juventus have the highest proportion of their revenue from broadcasting, the amount they actually receive (€166m) is less than Real Madrid (€188.3) and Barcelona (€188.2m).  The DFML report notes that 2013 was an unusually good year for Juventus in terms of broadcasting.  Despite "only advancing to the quarter-finals of the Champions League, Juventus received the highest distribution (€65.3m) of any club in the competition".  The €166m Juventus received in broadcasting revenues in 2013 was a 77% increase on 2012.

For the last number of seasons the Italian clubs have moved to collective selling of broadcast rights (reversing an 1999 anti-trust ruling in the Italian Courts). In the case of the Italian clubs the key issue is the distribution of the broadcast rights.  Ed Thompson has a superb explanation of how the Italian clubs distribute the revenues (here).  It is a system that heavily favours the status-quo and bigger clubs. Juventus in particular is a big winner under the Italian system.

The Spanish clubs sell the domestic broadcast rights to their games individually.  This results in Real Madrid and Barcelona getting a larger share of that pie.  Last year The Guardian reported (here) that Real Madrid received €140m while Granada received only €12m.  Although Barcelona exited the Champions League at the same stage as in 2012 they received an increase in broadcast revenue from that source.

German clubs benefitted from a new international right deal for the Bundesliga.  Two of the four in the above table also benefitted from getting to the Champions League final.  Although they lost the final, Borussia Dortmund were the biggest winner in terms of the increase in broadcast revenues (45%).  Chelsea's return from Europe went in the opposite direction.  However, this was offset by an increase in revenue from the Premier League.  There was also modest increases for the other Premier League clubs.

The importance of a good run in Europe's premier competition is best illustrated by Paris Saint-Germain.  Their broadcast revenue grew by a massive 93% as a result of reaching the Champions League quarter-finals whereas the previous year they were eliminated at the group stage of the Europa League.  Failure to qualify from one's domestic league can be seriously costly in terms of broadcast revenues.

0 Comments

Flying High - The Earnings Of A Hurricane

28/1/2014

 
Picture
By Robbie Butler

Hurricane Fly won his fourth Irish Champion Hurdle on Sunday taking his total number of wins to twenty, nineteen of which have been at Grade 1.

Since he first appeared in Ireland on the 7th of May 2008, the French bred gelding has been almost untouchable on a race course. Only Solwit, Overturn and Rock on Ruby have finished ahead of the ‘Fly’ in nearly five years of racing.

To own a horse like this must be somewhat of a dream. Disregarding the list of magically moments the horse has given his owners George Creighton & Rose Boyd, trainer Willie Mullins and the lucky jockeys that have ridden him, Hurricane Fly is a very valuable economic asset.  The horse has a win record of 90.91% and total earnings of €1,778,217.86.

Since his arrival in Ireland five and a half years ago, the Montjeu gelding has earned around €850 per day! That’s more than most people earn in a week. Some sources suggest the ROI is more than 4000%. With Cheltenham in his sights, it’s possible the ‘Fly’ will crash through the €2 million barrier in March. 

IRFU Announce Six-Year €20m Kit Sponsorship

28/1/2014

 
The Irish Rugby Football Union have secured a €20m kit sponsorship deal with Canterbury (here).  The deal will take in two World Cups as well as the annual six-nations competition.  The Irish Independent forecast the success of Canterbury last September (here).  The search for a new sponsor was stepped up after Puma ended the pervious deal early (as explained here in a article from the Irish Examiner).

Manchester United's Financial Performance

27/1/2014

0 Comments

 
By Geraldine Ryan and John Considine
In a previous post on this blog (here) the link between sporting and financial performance was highlighted using Chelsea and Bolton Wanderers.  Last Thursday the sports pages carried stories of Manchester United's exit from the Capital One cup while the financial pages carried stories about a slip in its relative financial performance.  There is no denying that the two are linked but it can be a bit more complicated that it seems on the surface.
Picture
The financial stories on Thursday were based on the Deloitte Football Money League report (here).  The report stated that, for the first time in the 17 years of its publication, Manchester United had slipped outside the top three.  This financial bad news arrives at the same time as the penalty defeat to Sunderland.  It is easy to believe that the empire is crumbling.  It is also easy to believe that all this is the fault of David Moyes.

It is not that simple.  Two points should be noted.  First, these results refer to 2012/13.  It is hard to link these figures to Moyes.  Second, and much more importantly, these results are pretty good ones.  Admittedly, United have slipped to fourth but there are some unusual circumstances.  For example, Bayern Munich had an exceptionally successful year on the field and reaped the rewards that came with it.  Even Chelsea posted profits for the year they won the Champions League.  Deloitte point to Bayern's on field success and to "unfavourable movements in the Sterling exchange rate" as the main reasons the Old Trafford club swapped places with the German giant.

Picture
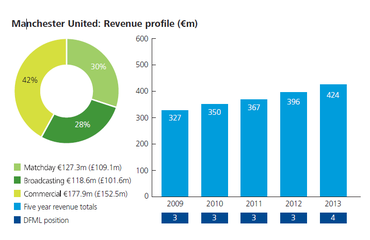
In addition, to providing a financial performance comparison between teams, Deloitte also provide details on how teams perform relative to previous years.  When we examine these figures the United performance is impressive.  The revenue profile shows a steady increase.  A 7% increase over 2012.  The swapping of positions with Bayern can be explained by Bayern's super year.

Of course, the above financial performance relates to the past.  But the immediate future also looks pretty solid as United will benefit from their new shirt deal with Chevrolet for the seven seasons begining in 2014/15.  The deal was signed last year.  Another deal signed last year is for the sponsorship of their training ground (with Aon).  But will United remain as attractive a partner for sponsors if their current on-field performances continue?  Unlikely.

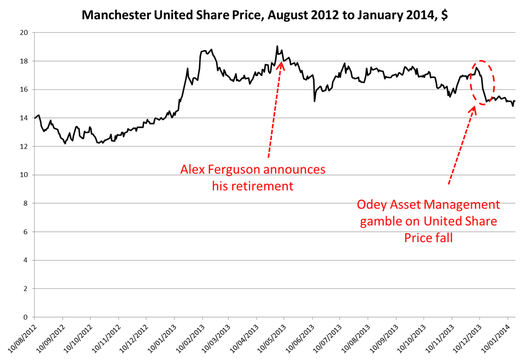
Many point to the movements in the United share price as a better indicator of how the markets forecast the prospects for United.  Using the share prices the outlook for United is not so rosy.  There is little arguing with the decline from $18 when Ferguson announced his retirement to the current value of approximately $15.  The share price took a dive in late December possibly driven by their position in the Premier League and possible driven by short selling by Odey Asset Management (see Daily Mail story here).   Since Moyes took over it is said to have wiped £150m off the value of the shares (here).  If performances on the field do not improve then expect negative financial implications.  This can only be sustained so long before the financial performance will damage the sporting performance.  Nobody expects Manchester United to follow the example of Leeds United but the negative feedback between sporting and financial performance can become a vicious cycle.

Picture
0 Comments

Manchester United's Transfer Spend

27/1/2014

 
Picture
By Robbie Butler

Juan Mata’s transfer to Manchester United has pushed David Moyes’ spending close to £70 million. Commentators have been quick to point out this outlay on new players exceeds anything ever spent in one season by Sir Alex Ferguson’s during his twenty-seven years in charge.

This is not true.

Comparing nominal transfer spend across years, especially over a period of nearly thirty years, is quite meaningless.

Most people build in the costs of inflation when comparing wages, salaries, house prices, etc. over time. Yet we don’t seem to apply this logic to the transfer market.

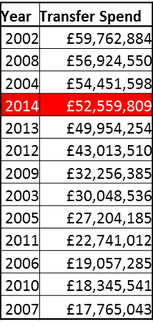
Presented to the right is real data on United’s transfer spend from 2002 - 2013. 2005 is used as the base year when adjusting for inflation. Fergie’s splurge of almost £60 million in 2002 on Roy Carroll, Diego Forlan and marquee signings Ruud van Nistelrooy and Juan Veron, remain United’s most expense transfer period.

Assuming an inflation rate of 2.5% in 2014, this puts David Moyes on £52.6 million. Adjusting the rate of inflation, upwards and downwards by 1% does little to change this estimate. This makes it the 4th most expensive transfer season for the Red Devil’s behind 2002, 2008 and 2004. However, with a week to go until the window closes, Moyes may not be finished yet…

FIA Plays Joker As F1 Points Double

25/1/2014

 
By Ed Valentine

Among the many rule changes for the 2014 F1 season is the decision to award double points for the final race of the 19 round championship. The idea, put forward in a response to Red Bull’s dominance over the last four years, is intended to give a greater chance for the driver’s championship to remain undecided heading into the final weekend in the hope of retaining TV audiences for the entire duration of the calendar. 
 
The FIA have thrown a dart rather than attempting to find a credible solution but claim that the alteration to the points on offer for the final GP would “maximise focus on the championship until the end of the campaign”. Only three of the previous 20 championships would have had a different outcome had the double points rule been in force. One of Schumacher’s seven titles and one of Vettel’s four would have ended up going to another driver but hindsight doesn’t count in this scenario as the rules were the rules on those days in history.
 
By attempting to make the final race a prized commodity there are a number of unintended consequences and perverse incentives which may result.
Picture
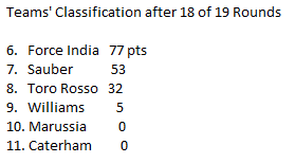
As F1 teams, like all rational economic agents respond to costs, benefits and incentives a change in the approach to the championship from those lower down the rankings is likely to take place. 53 points separated the 7th and 11th placed teams going into the final round of the 2013 championship. With 86 points on offer for a one two finish instead of 43 the smaller teams will almost certainly alter their design process and pour resources into a specific chassis construction for the Abu Dhabi circuit in order to secure those points. This will heavily compromise their competitiveness in the preceding 18 rounds of the championship. Although it is unlikely for the minnows of Williams and Caterham to be tussling for a podium finish there is a high value in creating a 1 race championship as the difference between 8th and 11th place in the standings could be as much as $35 million.

Picture
The new regulations state that engines and gear boxes must last 4,000km before being replaced. If there is a mechanical failure a team can make a change but cannot replace a unit if they want fresh equipment without taking a penalty. This essentially means that the smaller teams will keep 1 unused gear box and engine per car in order to limit the risks of mechanical failure going into Abu Dhabi. Everyone finishing outside the points scoring positions for the penultimate race in Brazilwill register a DNF in order to take a penalty free gear box and engine change. Some drivers running well inside the top 10 may also forsake their points finish if they feel there is a chance of scoring more than double that amount in the last race. We may see only four or five finishers. Honda F1 received a reprimand in 2005 for purposely “retiring” Jenson Button on the last lap in Australia in order to take a free engine change as they felt they had a chance of winning the following GP. If Button had crossed the line and not registered a DNF then a 10 place grid penalty would have been awarded for the next race had they elected to maximise their chances with a fresh engine.
 
The new engine and power-train rules are likely to cause a shakeup in the pecking order. Until the lights go out in Melbourne nobody will truly know where each team stands. This coupled with the certainty of engine reliability issues (some teams, Red Bull included, have voiced concern over engine reliability across the entire season) means there is a strong chance that the wrong driver could win the championship from external circumstances arising
from the double points scenario during the final race.  
 
It has not been a popular idea with the teams or most purists but for the upcoming F1 season the FIA’s dart will keep double top!

Sexual Orientation, Sport and Economics

23/1/2014

0 Comments

 
By John Considine
Two weeks from now the Sochi Winter Olympics will begin.  The event has received added attention because of non-sporting events.  Security fears have increased since the December deaths of over 30 people in two suicide bombings in Volgograd.  The games have also provided gay rights activists with the opportunity to highlight Russia's stance on gay rights.  These protests has spilled over into the economic sphere.
Picture
Towards the end of last year a variety of media outlets explained how the protesters proposed to use economic forces to highlight the issue.  In October Forbes magazine reported how Coca-Cola, McDonald’s and Samsung were enduring protests over their sponsorship of the games (here).  In December Bloomberg News again highlighted the targeting of Coca-Cola (here). This week the actor Hugh Laurie, the star of the TV series House, added his voice to a call for a boycott of Russian vodka (here). In these examples, the approach is to damage the profitability of the products.  The message is to purchase less of the targeted product(s).
 
An alternative way of using economic forces to support gay rights is to purchase more merchandise from a company that supports gay athletes. The potential for this approach is explored during a number of interviews between Rick Horrow (host of Bloomberg’s Sportsfolio) and Cyd Zeigler (Outsports.com).

Horrow discussed the possibilities for the first openly gay athlete in the major US sports with Zeigler in an interview (here) from April 2013.  Soon afterward basketball player Jason Collins stated he was gay in a Sports Illustrated article.  There followed another Sportfolio interview (here). In this interview Zeigler said he had a phone call from some friends who wanted to rush out and buy a Collins shirts.  Zeigler suggested the callers should wait until Collins signed a new contract as that would reward the team that signed him.  If the callers followed Zeigler’s advice then they would have to wait a while to get a Collins shirt.  This was something Horrow and Zeigler returned to in a later interview (here).  This November interview between Horrow and Zeigler is recommended viewing.

In the November interview Horrow uses the Collins case to wonder if gay athletes might find it difficult to get teams.  At the time of the interview, the NBA season was underway.  Collins had not been invited to any training camp and was not on any roster. Zeigler’s analysis cut straight to the tension between the sport and the economics.  He explained the difference in priorities between the front office executives and the coach.  He pointed out that the priority of the coach is winning.

As Zeigler talked captions on Collins’s stats were presented on the screen. Collins played for 12 years and with six teams.  During these 12 years his teams qualified for the playoffs on 9 occasions and made the finals on 2 occasions.  In his last season he played for the Washington Wizards. His salary was $1.35m but his stats dropped.  His 2012-13 points average was only 1.1 for 38 games whereas his career average was 3.6. He was also going to be 35 on December 2nd, 2013.
 
Zeigler could understand how Collins might not make too many appearances for a new team. However, he pointed out that there could be some financial logic to signing him as a 12th man.  There are economics forces that might support Collins’s case for a contract.
 
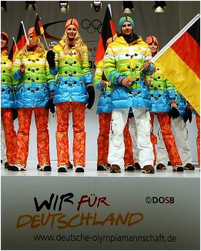
The November interview between Horrow and Zeigler also discusses the situation in other sports.  In addition, Zeigler discusses the potential for the protests surrounding gay rights in Russia having an impact.  It will make for an interesting few weeks if we are to judge by the rainbow clothing worn by the German team in the above photo.


0 Comments
<<Previous

    Archives

    March 2023
    February 2023
    January 2023
    December 2022
    November 2022
    October 2022
    September 2022
    August 2022
    July 2022
    June 2022
    May 2022
    April 2022
    March 2022
    February 2022
    January 2022
    December 2021
    November 2021
    October 2021
    September 2021
    August 2021
    July 2021
    June 2021
    May 2021
    April 2021
    March 2021
    February 2021
    January 2021
    December 2020
    November 2020
    October 2020
    September 2020
    August 2020
    July 2020
    June 2020
    May 2020
    April 2020
    March 2020
    February 2020
    January 2020
    December 2019
    November 2019
    October 2019
    September 2019
    August 2019
    June 2019
    May 2019
    April 2019
    March 2019
    February 2019
    January 2019
    December 2018
    November 2018
    October 2018
    September 2018
    August 2018
    July 2018
    June 2018
    May 2018
    April 2018
    March 2018
    February 2018
    January 2018
    December 2017
    November 2017
    October 2017
    September 2017
    August 2017
    July 2017
    June 2017
    May 2017
    April 2017
    March 2017
    February 2017
    January 2017
    December 2016
    November 2016
    October 2016
    September 2016
    August 2016
    July 2016
    June 2016
    May 2016
    April 2016
    March 2016
    February 2016
    January 2016
    December 2015
    November 2015
    October 2015
    September 2015
    August 2015
    July 2015
    June 2015
    May 2015
    April 2015
    March 2015
    February 2015
    January 2015
    December 2014
    November 2014
    October 2014
    September 2014
    August 2014
    July 2014
    June 2014
    May 2014
    April 2014
    March 2014
    February 2014
    January 2014
    December 2013
    November 2013
    October 2013
    September 2013
    August 2013
    July 2013

    About

    This website was founded in July 2013.

    RSS Feed

    Categories

    All
    American Football
    Athletics
    Baseball
    Basketball
    Behavioural Economics
    Boxing
    Broadcasting
    Competitive Balance
    Cricket
    Cycling
    Darts
    David Butler
    Declan Jordan
    Drugs
    Ed Valentine
    Epl
    Esports
    Expenditure
    F1
    Fifa World Cup
    Finances
    Funding
    Gaa
    Gaelic Games
    Gambling
    Game Theory
    Gary Burns
    Geography
    Golf
    Greyhound Racing
    Guest Posts
    Horse Racing
    Impact Studies
    John Considine
    John Eakins
    League Of Ireland
    Location
    Media
    Mls
    Mma
    Olympics
    Participation
    Paul O'Sullivan
    Premier League
    Regulation
    Research
    Robbie Butler
    Rugby
    Simpsonomics
    Snooker
    Soccer
    Spatial Analysis
    Sporting Bodies
    Stephen Brosnan
    Swimming
    Taxation
    Teaching
    Technology
    Tennis
    Transfers
    Uefa
    Ufc
    World Cup
    Wwe

Related

The website is not formally affiliated to any institution and all of the entries represent the personal views and opinions of an individual contributor. The website operates on a not-for-profit basis. For this reason we decline all advertisement opportunities. 

Contact

To contact us email sportseconomics2013@gmail.com or find us on Twitter @SportEcon.