The Economics of Sport
  • Sports Economics
  • About
  • Workshop
  • Selected Publications
  • Book Reviews
  • Media
  • A Primer on Gaelic Games
  • Upcoming Events
  • Education
  • Resources & Links
  • Data

Peloton Premier League

31/7/2015

 
By Ed Valentine

When the Premier League announced the latest TV deal totalling more than £5 billion earlier this year Richard Scudamore claimed the product offered is so attractive because it’s unscripted drama and that anything can happen at the top or bottom of the table. Though there seems to be little change in the top four or five clubs from season to season fans do get treated to occasional shock results.

The graph below demonstrates that last season the Premier League was subject of a “Peloton” effect where Chelsea were the breakaway leaders with a few followers off the pace behind them and then a cluster of about 13 clubs lagging down the road.
Picture
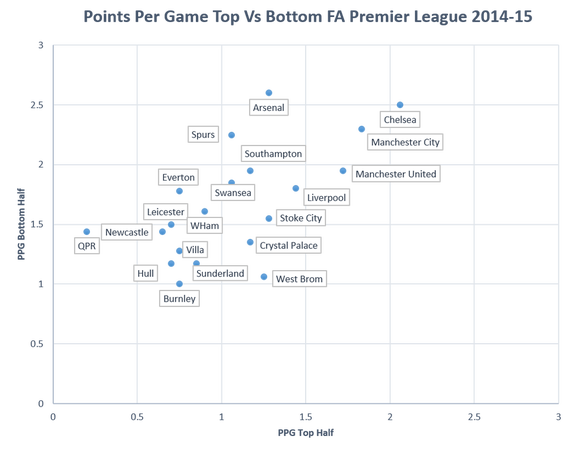
Chelsea and West Brom were the only clubs to win more points against the top 10 teams than against the bottom 10 teams.

It seems the key to survival in the top flight last season was to win the six pointers and steal points from teams positioned close by. The approach for weaker sides to field weakened teams against the top four would facilitate this

Hull were unlucky to get relegated as they did better than Newcastle against stronger opposition. Sunderland survived the drop last season by a similar means however there were no Brucie Bonuses this season for Hull.

One surprise is Arsenal who only managed to pick up about the same amount of points to as Stoke versus the top 10 clubs. It’s important to note that teams who finish in the top 10 can only play 18 games as opposed to 20 and vice versa for the bottom 10 clubs.

One trend that occurs season after season is the group of teams caught in a relegation fight. About five teams each season find themselves within a couple of points either side of 17th, 18th and 19th places. This largely results in a round robin style fight between these teams meaning that the matches played between them are worth more than matches played against mid-table clubs.

Too Many Draws Cost The Boys In Green

29/7/2015

 
By Robbie Butler

I've attended all three home qualifiers at the Aviva Stadium for the Euro 2016 qualifying campaign. Despite the fact we are unbeaten at home, have defeated Georgia in Tbilisi, and managed to grab a fantastic point against world champions Germany in Gelsenkirchen, it's now likely the Boys in Green won't even finish in the top three places in Group D. People have argued that this is down to defeat against Scotland last Novemeber in Park Head. Whilst true, I believe another factor is the points Ireland have dropped in the Avivia.

Since the turn of the year, the team has secured two draws in Dublin. Four points were left behind. Only three were lost in Scotland. Upon reflection I started to consider how often I have watched the Irish team play out battling draws. Recently I can recall these against Germany (home and away), Italy (home and away), Russia, Sweden, Slovakia, Bulgaria and the Czech Republic (I'm sure there are more!), all of which occurred from the time in Croke Park to today. Ireland don;t lose to many games to qualify for major tournaments, they draw too many. 

The first graphic below presents data on all qualifying games (excluding play-off matches) from 2002 - 2014.The country that has drawn the most qualifiers during the period - Republic of Ireland. 

Picture
If we consider the teams that draw the most matches during the period, a pattern becomes clear - very few qualify for major tournaments. The table to the right provides a more detailed analysis of the left side of the chart presented above.
Picture
The Draw Specialists
Israel have not qualified for a major competition since the 1970 World Cup. Bulgaria have failed to qualify for a European Championship of World Cup since 1998.Serbia did qualify for Euro 2004, and the 2006 and 2010 World Cups, but they also won most of the list (30 wins). Northern Ireland did not qualify for any major tournament during the time period. 

While I shudder to that that Ireland are not one of the best 24 teams in Europe at the moment, should the team fail to reach the Euro 2016 Finals, the country's win ranking in qualifiers from 2002 to 2014 would support this uncomfortable reality. Ireland have won 25/60 games, a win rate that places the team in 24th spot. This is behind countries like Norway, Hungary, Slovakia, Serbia, Bosnia, Romania and Turkey.

Draws might have done in the past, but winning games, especially those at home, is what gets countries to finals.

EMH And The Galway Races - Round 3

27/7/2015

 
By Robbie Butler

It’s that time of year again in Ireland. People head west to Galway for the seven-day racing festival. For many this is the highlight of the Irish horse racing calendar. For the third year in a row we will be following leading trainer Dermot Weld, as he seeks to win yet another Leading Trainer Championship at the festival. Success in 2013 was followed by a loss last year, leaving the score at 1 - 1. 

Each day we’ll follow Weld trained horses and put Fama’s ground-breaking article "Efficient Capital Markets: A Review of Theory and Empirical Work",  which conceptualised the efficient market hypothesis (EMH), to the test. A hypothetical stake of €2 (to win) will be wagered on on all Weld trained runners shorter than 4/1, and €1 each way on all those 4/1 or greater. Daily updates to follow…

DAY 1
A decent start on our quest to beat the bookies. Six horses went to post, three of whom were favourite. Two short priced runners could only finish second, while Sierra Sun at 9/1 was a neck 5th and just out of the placings. However, True Solitaire (6/4) and Harasava (9/4) both obliged, and Defining Year (5/1) finished 3rd in the 5.45pm. 

Stake: €12.00     Return: €13.75
Profit: €1.75   Week P/L: €1.75

DAY 2
Our decent start on Day 1 was wiped out. Again, six horses went to post, four of whom were favourite. However, no return is reported. An early blow but there is still time to recover.

Stake: €12.00     Return: €0.00
Loss: €12.00   Week P/L: - €10.25

DAY 3
Just four DK Weld runners went to post on day three. Stuccodor almost got us off to a flying start but was out-battled on the run in and could only finish second. Time to Inspire (5/4) did get into the winners enclosure but the other two runners (Shahzeena and New Agenda) did not. Another loss today. 

Stake: €8.00     Return: €5.50
Loss: €2.50   Week P/L: - €12.75

DAY 4
For the second time this week, DK failed to saddle a winner. However, the damage was limited due to some big priced each way success. A number of non-runners resulted in just five runners going to post. Waheeb's second appearance this week saw him finish third at 7/1 while Grecian Tiger, also reappearing for a second time, finished third at 10/1. Still a loss on the day. 

Stake: €10.00     Return: €6.50
Loss: €3.50   Week P/L: - €16.25

DAY 5
More frustration on Day 5. Five horses went to post; three finished as runners up, while Tandem was just outside the place money at 7/1. No success to report. 

Stake: €10.00     Return: €0.00
Loss: €10.0   Week P/L: - €26.25

DAY 6
The trend for the week continued on the second last day. Just four runners. First Figaro did limited the damage, winning the last race. The other three starters were all placed but at odds short than 4/1. 

Stake: €8.00     Return: €3.82
Loss: €4.18   Week P/L: - €30.43


DAY 7
Just one winner on the final day and at odds at 1/3 it did little to arrest the damage done earlier in the week. Just three runs in total meant a small loss on the day

Stake: €6.00     Return: €2.76
Loss: €3.24   Week P/L: - €33.67

Outcome
A pretty rough week all told. After a great start on Day 1, losses were reported on every other day. Nearly a dozen second placed horse meant it was a story of what could have been. A total stake of €66 saw a loss of €33.67. For the second year in a row the market has beaten our strategy. 

The great thing about this however is that there is always next year. Roll on 2016! 

MLS Top Earners - 2015

25/7/2015

 
By Sean O'Connor

Last Wednesday (15/7/15),  the Major League Soccer’s Players Union (MLSPU) released its latest survey on player’s wages for the 2015 season. Rather than discuss the results ad nauseam, the table below indicates the top 20 earners in the league, along with a number of other players who may be of interest to both Irish fans and supporters of English teams.
Picture
Source: MLSPU (2015)
The gulf in inequality continues in regards to player base salary with the top 20 earners in the MLS receiving 48% of the total base salary. From an Irish standpoint both Robbie Keane and Kevin Doyle make the top 20, earning circa £55,000 and £14,000 per week each. However, fortunes aren’t so favourable for another Irishman, Sean St. Ledger, who only earns around £1,500 per week. Of course these salaries don’t take into account match bonuses along with sponsorship deals, however, those who believe players only go to the MLS for a pay day, may have to rethink this theory, at least for those outside the top 5% anyway.  

Sean O'Connor is a research assistance in the Department of Economics at University College Cork.

Should the GAA Regulate the Market for Statistics?

24/7/2015

 
By John Considine
Two days ago, the Irish Times raised the issue of the GAA distributing statistics on their games.  The piece by Andy McGeady highlighted the range of people currently engaged in collecting such statistics and the possibility for some action by the governing body.  It could be inferred that the market for GAA statistics needed greater regulation.  While I would have some sympathy with this view, there are many issues that would need to be addressed.

McGeady pointed out that there is a commercial market for such material, e.g. GaelicStats.com.  There are also other sites from which interested parties can gather data, e.g. dontfoul.wordpress.com.  In addition, many media outlets provide some basic statistics on the games they cover.  Therefore, one might wonder why there is the need for the GAA to collect (or purchase) and distribute such statistics.  Who would benefit from such a change?  Not Rob Carroll of GaelicStats.com (unless the GAA purchased his services to collect the statistics).  The media might get the statistics cheaper than having to purchase them.  The GAA and the wider public might benefit from a greater evidenced based discussion of the games.  However, the case for greater GAA intervention is far from settled.

For the moment, let us go with the McGeady suggestion.  It is possible to read the McGeady piece as suggesting the GAA coordinating the collection and distribution of statistics from county teams.  Alternatively, the GAA could outsource the collection of data to a professional firm like Opta or GaelicStats.  Or, it could use its army of nationwide volunteers to collect the data.  If the GAA desired then it could establish a GAAStats wiki.  In this case they could have those who use the stats collection apps on their phones to submit their data to a central system.  The central system would facilitate some cross checking and verification of the data.  It may not have the internal consistency of an Opta system but it could benefit from the wisdom of crowds.  Such a system is a possibility.  However, it would require some planning and regulation.

The biggest issue would involve deciding on the exact definition of the data to be collected.  Let me illustrate some of the issues using data on the 2015 Munster Senior Hurling Final between Tipperary and Waterford.  I'm going to use the stats provided by the broadcaster of the live event (RTE) and two newspapers (Irish Examiner and Irish Independent).  Below are the scoring statistics.  The numbers in blue font are "correct" but many of those in black font are open to interpretation.
Picture
The problem comes from the definition of a scoring chance.  Are balls that trickle wide over the end line defined as a scoring chance?  Are all balls that that the goalkeeper collects from an opposing player defined as a scoring chance?  What happens where a player has possession in the middle of the field, 50m from goal, is unchallenged, and decides to play the ball into a team mate 10m from goal?  It is clear that there would need to be some agreement on what constitutes a scoring chance.  Defining this is a bigger coordination problem for a wiki but it remains a problem for Opta and others.  The commercial operations would also need to answer these questions and train the coders appropriately.

The numbers in red font (above) are a problem that is easier to explain and clarify.  It seems that 65s are classified as frees.  The denominator is harder to explain.  Waterford committed 11 fouls.  What frees are not included in the denominator?  Ones that are outside the scoring range? Again there would need to be some common understanding on these issues.

Both teams hit one free wide.  They also struck one wide each from a side line puck - something not included in the statistics above.

The difficulty with definition carries over into what we might call the "possession" statistics.  Here are the statistics from RTE, the Irish Independent, and the Irish Examiner.  Not all sources agree on the stats to be collected and there is some disagreement on the exact numbers.
Picture
The stats on discipline also show a difference of one in the frees Tipperary conceded.  A possible explanation is the 13m conceded by Tipperary on a Waterford free during the second half.  It is interesting to note that Waterford players attracted a yellow card for over 50% of their fouls.  It is also interesting that they conceded 5 frees to Tipperary's one foul in the second half.
Picture
What other statistics should be included and how would they be defined?  These are all questions that would need to be considered.  What should we make of the fact that there were 17 side line pucks (with 13 of those going to one team)?  Or is it important to know that both teams got two 65s?  Do we need to know the number of hand passes in a game (59 with one team performing 37)?

What statistics would we need to examine the role of the "sweeper"?  It is hard to know.  However, some numbers might suggest that there is greater variation to the "sweeper" role than is acknowledged.  Padraic Maher (Tipperary) collected the ball on three occasions where it was battled or blocked by the Tipperary full-back.  By contrast, Tadhg de Burca (Waterford) got three hand passes from his full-back.  There was also a difference in what each sweeper did with the ball.  Maher accounted for 33% of all Tipperary hand passes on the day (and he also delivered a few short stick passes).  By contrast, De Burca accounted for about 5% of Waterford's hand passes.

McGeady's suggestion is a good one but it will require a bit of thought.  Maybe the GAA should facilitate this discussion.

Olympic Bids - Enter Budapest

22/7/2015

 
By Robbie Butler

Despite the growing body of literature examining the economic cost of hosting major sporting events, the list of countries seeking to host the Olympic Games continues to grow. Already Wikipedia pages exist for the 2024 and 2028 Summer Olympic Games and list the potential host cities. The latest to add their name to the list was the
Hungarian capital Budapest.

Andrew Zimbalist’s recently published
Circus Maximus is a must-read for all would-be hosts. The book explains in detail the pros and cons of mega sporting events, the success stories, and the big failures.

While winning the right to host the Olympics Games (Summer or Winter) has become an achievement in itself, this was not always the case. Zimbalist explains how the city of Los Angeles was approached by the International Olympic Committee (IOC) prior to hosting the 1984 Summer Olympic Games, as no bids were placed to host the event. The success of Los Angeles, primarily due to the fact it held sway over the IOC, encouraged others to follow suit. The Olympics it seemed was the way to economic enrichment.

Barcelona 1992, and to a lesser extent London 2012, are used as examples of success stories. Barcelona used the event to upgrade much of the city’s aging transport infrastructure that was neglected during the Franco regime. The Games were hosted as a wider plan for the city's redevelopment. Others have been less fortunate. Greece, in particular, are paying the price of past excesses. The 2004 Games in Athens left very little legacy and cost the state between €6 - €8 billion. Much of the Olympic infrastructure now lies idle.

If Budapest do bid, they need to be more like Barcelona and less like their Greek friends to the south.

Irish U21 Footballer Progression Rates

20/7/2015

 
By David Butler

Following the Republic of Ireland’s 1-1 draw with Scotland in June the 42.ie published an
article written by John O’Sullivan that discussed the difficulties Irish international footballers faced in light of globalised world football. The story is not inherently new to football fans in this country, and while not doubting its complexity, goes something along these lines – there are now fewer opportunities for Irish players to develop their skills with elite English clubs and given the relative weakness of our own domestic league, we are failing to develop footballers to compete as successfully at a senior international level as we have done in the past.

John’s analysis and the comments section are thought-provoking. The usual candidates for explaining our failure to develop talent are discussed.  Poor underage footballing infrastructure, outdated or narrow coaching methods, weather conditions, the disconnect between domestic footballing institutions and a weak League of Ireland are all mooted in one form or another. There is merit in many of John’s points and also from the Irish fans who have responded, several of whom clearly have experience working at a grassroots level. 

Here are some numbers on the issue of talent development and the progression to the Republic of Ireland senior team. I concentrate on our U-21 level as it is a common place from which succession to the senior team occurs. 

From the 18th of May 2006, when the Irish U-21s defeated Azerbaijan until the 10th of September 2012, when Ireland beat Italy 4-2, the Irish U-21s have played 45 times. I could access data for the squad for 40 of these matches (4 of the 5 missing matches were also non-competitive). The data was collected from a range of sources including FAI archives, UEFA archives, RTE reports, Sky Sports reports and Irish Times reports.  Any player that played on the senior team before playing U-21 was not included in the analysis – there was only one player to my knowledge that this was true for, Aiden McGeady.

Here’s the scoop.

1. Over these 40 games considered between 2006 and 2012 the Republic of Ireland U-21s called up 137 players.

2. 29 (21%) of these U-21s were later capped at a senior international level for the Republic of Ireland.

3. 12 (9%) of these U-21’s have recorded 10 or more senior international caps – 7 were born in Dublin, 3 were born outside of the capital and 2 were born outside of the Republic.

4. Of these 12 players (that we could assume have ‘made it’ at a senior level given that they have 10 caps) the average and median number of U-21 caps they recorded was 9.

5. The players capped the most at an U-21 level were Joseph Mason (21 caps), Shane Redmond (21 caps), Shane Duffy (20 caps) and Owen Garvan (16 caps). Only Shane Duffy, who switched allegiance from Northern Ireland, has recorded a senior international cap.

While it's unrealistic to expect every U-21 international to progress to a senior level, my intuition tells me that other countries have higher progression rates. These numbers also raise further questions. In particular, whether or not Ireland should cut their losses on an U-21 player if they are not ready to progress after collecting a dozen or so U-21 caps?

    Archives

    March 2021
    February 2021
    January 2021
    December 2020
    November 2020
    October 2020
    September 2020
    August 2020
    July 2020
    June 2020
    May 2020
    April 2020
    March 2020
    February 2020
    January 2020
    December 2019
    November 2019
    October 2019
    September 2019
    August 2019
    June 2019
    May 2019
    April 2019
    March 2019
    February 2019
    January 2019
    December 2018
    November 2018
    October 2018
    September 2018
    August 2018
    July 2018
    June 2018
    May 2018
    April 2018
    March 2018
    February 2018
    January 2018
    December 2017
    November 2017
    October 2017
    September 2017
    August 2017
    July 2017
    June 2017
    May 2017
    April 2017
    March 2017
    February 2017
    January 2017
    December 2016
    November 2016
    October 2016
    September 2016
    August 2016
    July 2016
    June 2016
    May 2016
    April 2016
    March 2016
    February 2016
    January 2016
    December 2015
    November 2015
    October 2015
    September 2015
    August 2015
    July 2015
    June 2015
    May 2015
    April 2015
    March 2015
    February 2015
    January 2015
    December 2014
    November 2014
    October 2014
    September 2014
    August 2014
    July 2014
    June 2014
    May 2014
    April 2014
    March 2014
    February 2014
    January 2014
    December 2013
    November 2013
    October 2013
    September 2013
    August 2013
    July 2013

    About

    This website was founded in July 2013.

    RSS Feed

    Categories

    All
    American Football
    Athletics
    Baseball
    Basketball
    Behavioural Economics
    Boxing
    Broadcasting
    Competitive Balance
    Cricket
    Cycling
    Darts
    David Butler
    Declan Jordan
    Drugs
    Ed Valentine
    Epl
    Expenditure
    F1
    Fifa World Cup
    Finances
    Funding
    Gaa
    Gaelic Games
    Gambling
    Game Theory
    Gary Burns
    Geography
    Golf
    Greyhound Racing
    Guest Posts
    Horse Racing
    Impact Studies
    John Considine
    John Eakins
    League Of Ireland
    Location
    Media
    Mls
    Mma
    Olympics
    Participation
    Paul O'Sullivan
    Premier League
    Regulation
    Research
    Robbie Butler
    Rugby
    Simpsonomics
    Snooker
    Soccer
    Spatial Analysis
    Sporting Bodies
    Stephen Brosnan
    Swimming
    Taxation
    Teaching
    Technology
    Tennis
    Transfers
    Ufc
    World Cup
    Wwe

Related

The website is not formally affiliated to any institution and all of the entries represent the personal views and opinions of an individual contributor. The website operates on a not-for-profit basis. For this reason we decline all advertisement opportunities. 

Contact

To contact us email sportseconomics2013@gmail.com or find us on Twitter @SportEcon.