The Economics of Sport
  • Sports Economics
  • About
  • Workshop
  • Selected Publications
  • Book Reviews
  • A Primer on Gaelic Games
  • Upcoming Events
  • Media
  • Education
  • Resources & Links
  • Data

11 Is Prime

29/10/2019

 
By Ed Valetine,

Imagine if someone got four numbers on the lotto, where you got five, but they got the bigger prize due to some sort of anomaly? It may seem unfair, even farcical. This would never happen in reality. However, sport can occasionally serve up anomalistic situations where it is more advantageous to be the runner up or loser in the long run.

Formula One has tinkered with its qualifying set up a number of times in the last 15 years in order to create a unique set of race management issues for the drivers to juggle in the search for a more entertaining product. The product was damaged somewhat with September’s Italian GP qualifying session where 8 of the 9 drivers in the top 10 shootout failed to set a lap time due to slowing down on the out lap to avoid missing the slip stream. It raised a few questions and gave rise to talk of shaking up the qualifying format in future seasons.

The FIA, Formula One’s governing body together with the commercial rights holder Liberty Media, recently discussed introducing the idea of sprint races to determine the starting grid for the main race instead of the current qualifying format where the slowest drivers do not make it into the top 10 shootout. It might make for interesting grids and more entertaining opening race stints, but could it eliminate certain anomalies that can advantage slower cars on the starting grid?

The current format comprises a first session of 18 minutes to decide places 16-20 (the five slowest cars). These five are then eliminated with the remaining 15 advancing to Q2 where the same is done for positions 11-15. The final session lasts 12 minutes and determines the top 10 starting order with the fastest winning pole position and so on.
 
It seems straight forward. It’s not.
 
Drivers who do not make the final session e.g. 11th – 20th can choose any tyres they like to start the race on while those in the top 10 must use the tyres they set their fastest lap on in that session.
 
Typically, the 11th – 20th place qualifiers will choose brand new “option” tyres for the race with those in the top 10 likely to have set their fastest laps on “prime” tyres. Prime are the fastest available tyre compound but do not last as long and are generally quicker by half a second a lap initially in clean air but this drops off a cliff quite rapidly. In a straight fight a driver on options can expect to lose .5-.75s a lap initially however this reduces and then cuts over to a dramatic gain in performance.
 
These prime tyres will have had a lap or two in “party mode” which means all of the go faster buttons have been activated to enable ultimate performance from the car. This can damage the tyre via wear and thermal degradation resulting in a 7-8% loss in performance and life - a significant amount. Occasionally, and depending on track conditions drivers in lower positions on the grid can be ahead into turn one thanks to the advantage of newer rubber off the line.

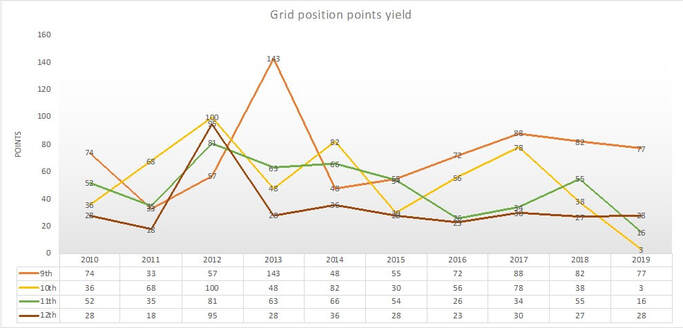
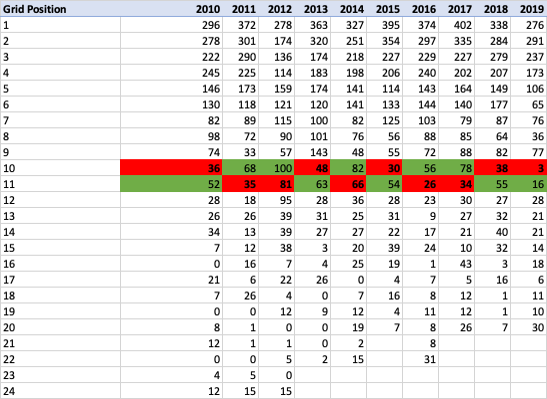
The figure and table of data aims to explain why it may be more beneficial to start from 11th place than 10th. The graphic provides points data on finishing places 9 -12. The table expands on this and show data from 1st to (in some cases) 24th position. 
Picture
Picture
Points data over the last 10 seasons has been analysed in this table, which demonstrates that in five of these 10 seasons* (*2019 season still in progress). Drivers starting from 11th position have outscored those in 10th. It is therefore more efficient to start from 11th because it means less mileage on the engine and gearbox plus reduces the risk of an accident or mechanical failure. It all amounts to lower cost and lower risk. Remarkably this season in a points sense it is 10 times better to start from last position than 10th.
 
Another contributing factor is that the 11th place grid slot is on the same side of the grid as 1st – the clean side. That’s worth a tenth or two off the line together with newer tyres. Beginning the 1st stint of the race on new tyres and track position helps to stay ahead of “faster packaged” cars as the race develops.
 
The data demonstrates that drivers at the back of the grid tend to outscore those who start in the midfield – this can be explained by the fastest cars, once or twice a season, starting from the back of the grid due to a penalty but then scoring a high points finish on race day. It also demonstrates the value of pole position though this is skewed in the current era due to Mercedes overwhelming performance advantage.
 
The scenario could be compared to finishing 2nd in a Champions League group in order to avoid playing a stronger team in the knockout rounds. Whilst it doesn’t reward out and out performance it does reward those genuinely attempting to achieve the best result overall result in the context of the wider tournament.
 
One solution to the qualifying anomaly is to have a FIFA style starting grid draw where the positions are drawn out of a hat with some seeding worked in to ensure some fairness across the field. This really would turn F1 into a lottery.
Complements or Substitutes?

23/10/2019

 
Picture
By David Butler

Recently, Andrea Agnelli (head of European football clubs association) has spoken of the need for innovations in the way European football competitions are organised.

An interesting aspect of his thinking was that other sports – the typical substitutes that might be expected to impact demand for any given sport – are not the major threat to football. Instead he suggested that video games, such as Fortnite, League of Legends or FIFA soccer, are going to be the competitors vying for the attention of consumers over the next two decades.

I recently listened to David Goldblatt on Matt Cooper speak about related topics which feature in his new book “Football in the 21st Century”. Goldblatt remarks on how the average age of the typical football fan at a stadium in the UK has gotten older. While there may be various reasons for this, is it the case that Fortnite, League of Legends or FIFA soccer (Agnelli’s concerns) are now keeping millennial's and generation Z at home?

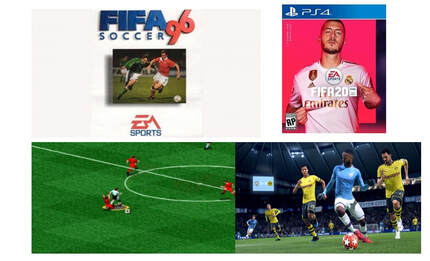
The video game industry has grown significantly, and the quality of the product has drastically improved over the last 25 years or so.  My earliest memory of the FIFA video game was when Jason McAteer featured on the front cover in Ireland. In 1996 the game competed with Sensible Soccer and International Superstar Soccer (the other good football video games of the era). At the time these video games were complements -  mostly young fans who enjoyed playing, watching and attending football usually took an interest in the football video game too.
​
If Agnelli is correct the ground might be shifting. Video games might just be evolving into a substitute. Perhaps eSports might become an important measure in the demand functions of the future. 

Freight Expectations

21/10/2019

 
By Ed Valentine

Of all the places to see live Major League Baseball’s New York Yankees play against The Boston Red Sox – a classic box office fixture in the annals of bat and ball history - West Ham’s London Stadium would not be the primary venue on the list. Earlier this year MLB played, for the first time, on European soil with a 4-game series following the trend set by NFL and NBA with regular season games being contested in London.

​Whilst the flight across the Atlantic may not be the norm for American sports franchises, in logistical terms pitching their tent in Europe for a weekend or two every season is not a difficult undertaking. This can be contrasted to Formula One’s global circus where 21 of the World’s finest racetracks in the most glamorous of destination cities are visited every other weekend from March to December.
 
Th F1 circus is arguably the largest global touring sport. Thousands of tons of kit are transported across the world throughout the season with occasional back to back weekend races.  It’s a tough logistical exercise but could the current calendar be arranged to make the travel easier on teams and staff?

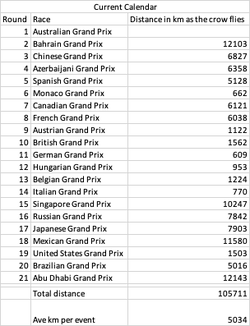
​Below is a table demonstrating the kilometers travelled from city to city under the current F1 schedule. 
Picture
The current calendar forces teams to clock up a total of 105,711 Km end to end with some tight turnarounds along the way. Take Race 2 to Race 3 - Sakhir, Bahrain to Shanghai, China. These are back to back Grand Prix which forces all of a team’s kit (fits into about 80 trucks) to be dismantled by the Sunday evening and flown to Shanghai and being fully operational by the following Thursday. Shanghai is 5 hours ahead and almost 7,000km away. Essentially the entire F1 paddock has to be dismantled and rebuilt on the other side of the world within 70 hours. The pit infrastructure and hospitality units are of the volume of 35 average family sized house moves per team. The aim of the game is not about packing up quickly but making sure it’s easy to reassemble at the other end. Every step has to be meticulously planned.
 
 
A quarter of the total annual distance is travelled by the 4th race weekend. The cash burn for these fly aways is easily $1million per week largely due to the travel. It must be a massive disincentive for new consortia who may want to enter the championship knowing that just to travel to work they’d be eight figures out of pocket. 

Picture
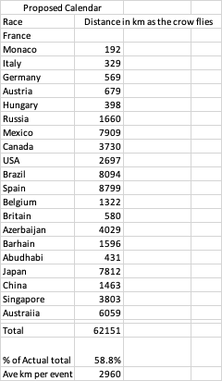
​By comparison the calendar could be arranged as per this table. The championship could begin in Europe and then move to North America. 8 rounds would be completed in the same transportation distance as the going from Melbourne to Bahrain under the current arrangement. Overall it would allow for a 40% reduction in distance travelled.
 
The limitations to this are that contractually some governments pay more to hold races at certain times of the year. Melbourne and Abu Dhabi will pay more to host the season opening and closing races than for any other slot on the calendar. In return there is the added exposure of the opening Grand Prix after a long summer break and the potential of a final race championship showdown. Monaco historically has to be in May and Silverstone marks the halfway point in the season.
 
​Formula One manages to pull this off every year without a hitch. There are lessons to be learned for global supply chains from F1’s collaborative freight management systems. I bet they even manage to keep within the Ryanair luggage allowance.

Ireland And The "Inevitable" Draw?

17/10/2019

 
By Robbie Butler

During the summer of 2015, I wrote about the Republic of Ireland football team and the number of drawn games the team was involved in. 4 years ago, the Boys In Green led the way for the number of draws during UEFA qualifying for major championships (World Cup and Euros). With Ireland's fate now to be decided next month in the Aviva, I thought it timely to revisit this. The reality is that Ireland have become even more of an outlier.

Let's look closer.

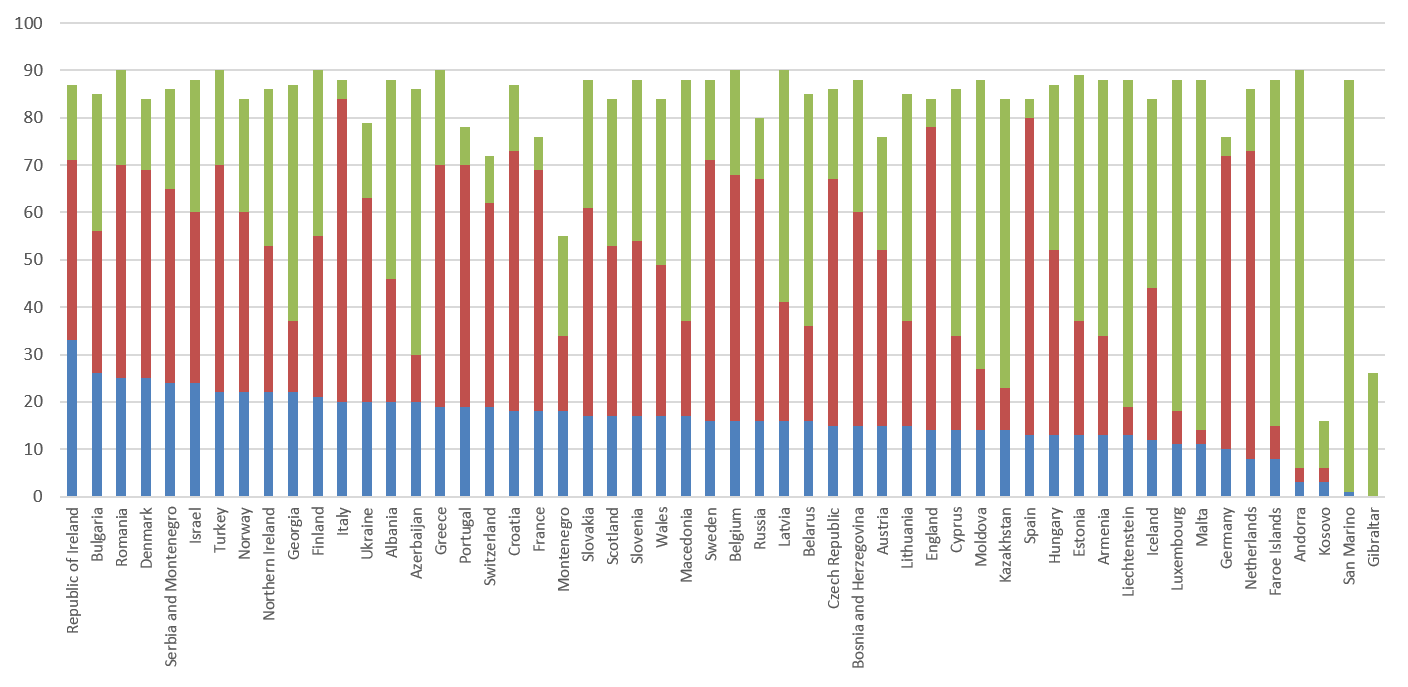
The graphic below presented data on draw (blue)/win(red) /loss(green) outcomes for all UEFA nations between 2002 and 2020 qualifying, as of today. Yet again, the Republic of Ireland appear on the far left.
Picture
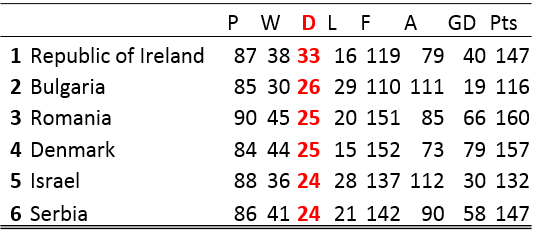
The Republic of Ireland have now drawn more group qualifying games, and considerably more at that, than any UEFA country since World Cup 2002 qualification. In total, this amounts to 33 games. That is 33 out of 87, nearly 40%. The draw "leaderboard" is presented to the right.

At the same time the team have won 38 games. The win rate ranks Ireland 23rd out of all UEFA members, and with 24 countries at the Euro's since 2016 (including the hosts) it would seem obvious why our qualification always comes down to the wire.
Picture
UEFA Members - Top Drawing Teams 2002-2020. Serbia competed as Serbia and Montenegro in 2004 and 2006.
W​ith a loss rate of just 16 games, only 13 UEFA members have a better record than the Boys in Green over nearly 20 years. Belgium, Sweden, Czech Republic, Turkey and Greece have all lost more times.

However, despite losing more games, Turkey have played at the same number of major finals (3), Belgium 4 (and with Euro 2020 this will be 5), Greece 5 (including winning Euro 2004!), Czech Republic 6 and Sweden 7! 

As I said in 2015, we simply draw too many games. This campaign alone has witnessed three (Denmark, Switzerland and Georgia). As we now know, a draw at home to Denmark next month won't be enough. Let's hope we can avoid, what seems to be, the inevitability of this - a next month a draw is the same as a loss. 

Go Compare!

15/10/2019

 
By John Considine
Picture
Economists have always known the value of a good comparison to illustrate a point.

In 1996 Mancur Olson used a few in his "Big Bill on the Sidewalk" article.  Olson asked readers to compare the economic performance of East Germany versus West Germany.  Or the economic performance of North Korea versus South Korea.  The latter example must be one of the most widely used examples designed to illustrate the benefit of good institutions and rules.  Advocates argue that it can't be geography because of the disparities in wealth either side of a political line (although Jeffrey Sachs makes a good case for a geography contribution to the disparity).

The power of outrageous comparisons was a key element in the efforts to get US airline deregulation.  Wayne Leighton and Edward Lopez explain it in their book Madmen, Intellectuals, and Academic Scribblers.
​
"A powerful weapon in these public hearings was the use of real yet outrageous examples, and the committee exploited them to full effect.  It showed that a traveller flying between Los Angeles and San Francisco, an interstate market not regulated by the CAB, would pay half as much as a traveller flying between Washington and Boston, or flying between two cities that were roughly as far apart and, importantly, that were regulated by the CAB".
 
Today, Sky Sports News produced a list of fine comparisons for their viewers.  Go compare!  Fines for racism are smaller than fines for infractions of kit regulations.

Picture

Why Playing Games Counts as Smart

11/10/2019

 
By John Considine
Picture
“We begin from the observation that games are not easy to play, or at least not play well”.  From this sentence onwards, I was receptive to the arguments made by Mark Walker and John Wooders in their American Economic Review paper about the strategies used by tennis players.  My memory is not what it used to be, however, I can still remember the difficulty in playing games.  When we lose those memories we more easily criticise current players for not being able to do things that we did with great difficulty (or could not do at all).  Reading that sentence by Walker and Wooders put me in a good mood.  The good mood helped sustain my reading effort.
 
Giving the writer a fair hearing is always a good idea.  However, I probably restrained my critical faculties too much on my first reading of a 2018 paper by Scott Kretchmar (published in Quest).  The subtitle of the paper caught my attention – “Why Playing Games Counts as Smart” – but it was the presentation of the argument that I most enjoyed.  Kretchmar says that when he was younger he somewhat bought into the “unintelligent jock” argument.  He does not launch a full frontal assault on this view.  He just has a bit of fun with it.  In the course of the paper he says “if game intellection led the way into culture – how deliciously ironic that would be”.  He presents his argument but does not seek to beat the reader over the head with it.
 
Kretchmar says that science, art, and sport are human actions based on expertise.  He goes on to argue that a commitment to expertise is a commitment to excellence.  Walker and Wooders come at the same idea but from a difference angle.  They use data from professional sports because “the participants have devoted their lives to becoming experts at their games”.  Their results lends support to the argument that expert jocks adopt the strategies that the theorists recommend.  The players play minimax at Wimbleton.
 
Similar findings are presented by Ignacio Palacios-Huerta in his book Beautiful Game Theory.  Here we find soccer players rather than tennis players.  In the first chapter Palacios-Huerta examines the behaviour of participants in penalty kicks.  The expert jocks perform as the theorists recommend.  The first chapter is called “Pele meets John von Neumann in the Penalty Area”.
 
The second chapter is called “Vernon Smith meets Messi in the Laboratory”.  Here our expert jocks are taken from the field of play.  They are taken from their highly pressurised comfort zone and placed in the somewhat artificial environment of a laboratory.  Here they play non-physical games with similar characteristics.  Again, the expert jocks come up trumps.  They demonstrate something like transferable skills and more abstract reasoning skills.  Or maybe we are witnessing the commitment to excellence that Kretchmar describes.

Vernon Smith shared the 2002 Nobel Prize in Economics.  His work in experimental economics explains the title of Chapter 2 from Beautiful Game Theory.  In recent years, he has advocated that economics needs to reconsider the great works of his 18th century namesake (Adam Smith), e.g. Humanomics: Moral Sentiments and the Wealth of Nations for the twenty-first century (2019).  In that spirit it is worth quoting from The Wealth of Nations (1776).

“The difference between the most dissimilar characters, between a philosopher and a street porter, for example, seem to arise not so much from nature, as from habit, custom, and education.  When they come into the world … neither their parents nor play-fellow could perceive any remarkable difference … they come to be employed in very different occupations.  The difference of talent comes then to be taken notice of, and widens by degrees, till at last the vanity of the philosopher is willing to notice scarce any resemblance.”

Smith poked fun at the vanity of the intellectual over the physical.  Kretchmar does likewise.

Balance Problems and the RWC

9/10/2019

 
By David Butler

The pool stage of the Rugby World Cup concludes this Sunday. This part of the competition saw four pools with five teams playing each other once.  

In Ireland there’s a strong appetite to get up early and tune in to our matches but I doubt whether the same demand exists to view broadcasts of other pool matches.

The early stages are afflicted with balance problems making it difficult for a die hard, let alone partisan fan, to view many of the fixtures.

Looking at the bookmaker odds on the matches is telling. Of the 40 pool stage fixtures, I would consider only 4 to be well balanced – France vs Argentina, Australia vs. Wales, Namibia vs. Canada and Japan vs. Scotland. Four others are partially balanced – New Zealand vs. South Africa, Ireland vs. Scotland, Fiji vs. Georgia and USA vs. Tonga. The remaining 80% of matches typically feature a team with a ~90% or greater chance of success.

I know people will point to the two major shocks, Japan defeating Ireland and Uruguay’s success over Fiji, but for the most part the pool stage matches are dead rubbers. For many the outcome is so certain bookmakers may not even lay a team.

For example, the bookmakers deemed New Zealand chances of defeating Canada and Namibia to be over 99%. The same is true for their upcoming match against Italy. Is there any point playing it?  The All Blacks duly beat Canada 63-0 and Namibia 62-0 (the two biggest points margins in the competition so far). There are other examples of this extreme level of imbalance – Ireland vs. Russia, Australia vs. Uruguay, South Africa vs. Namibia, South Africa vs. Canada.

Interest will likely increase from the quarter finals when “the competition gets going”. From here on we will likely see more balanced, better quality matches.
​ 
At present however, the design of the pool stages isn’t doing the competition any favours from a sporting perspective. Reducing the number of teams would likely make a more competitive group stage. There are obvious economic trade off’s here and the fact that scaling things down would also “kill the dream” for many small rugby nations. 

Is VAR Really Giving?

7/10/2019

 
By Robbie Butler

The subject of Video Assistant Referee (VAR) has been addressed a number of times on this blog (see here, here and here). This is my latest observation of the system which I must admit I am not a fan of. 

Eight rounds into the Premier League season and the use of VAR, as expected, has been widespread. For the first 5 to 6 weeks I noticed that assistant referees were effectively becoming redundant when it came to calling offside decisions. What appeared to happen was either 1) the assistant referee would not put up the flag in cases which could be offside or 2) wait for a prolonged period before putting up the flag, having probably been alerted by VAR to do so.

The upshot of this was that in scenarios where the assistant referee would not put up the flag and play continued, resulting in a goal, VAR would then be used to determine offside. If there was no offside the goal stood. If offside was an issue the goal was chalked off. Therefore, VAR would only take away. A good example of this recently, was Serge Aurier's disallowed goal for Tottenham at Leicester. 

Now consider what appears to be happening over the past week or so. The behaviour of the assistant referee has changed and they are now calling offside in the manner they have always done. I suspect this change in behaviour has been motivated by those with decision making authority..  

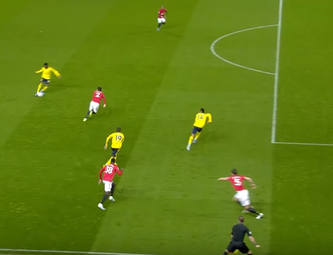
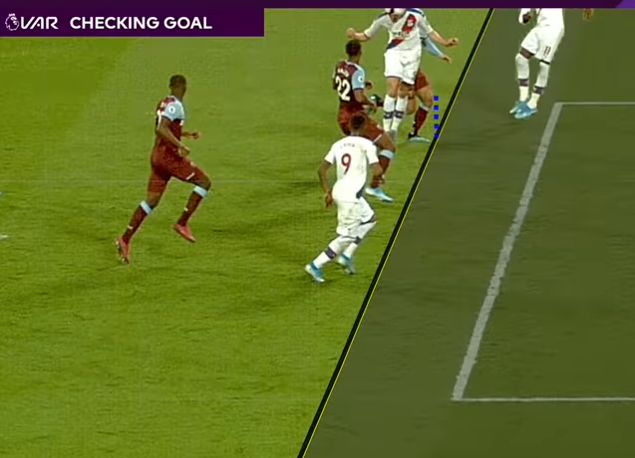
Two recent examples of this are pictured below. The left shows Pierre Emerick Aubameyang goal against Manchester United on Monday night which was initially ruled offside. The left is Jordan Ayew's goal against West Ham last weekend. This was also initially ruled offside. 
Picture
Source: Sky Sports Football (2019)
Picture
Source: Sky Sports Football (2019)
​In the case of both decisions, VAR intervened and allowed the goals. Many jumped to the defence of VAR claiming this demonstrates how good VAR can be. During the wait for Ayew's goal against West Ham, the commentator even said, "And VAR, that is so often criticised for taking away, looks like it is going to give here to Crystal Palace". Is VAR really giving? I don't think so. There were not "two more goals" because of VAR (Aubameyang and Ayew).

What has changed is the behaviour of assistant referees. If they had behaved as they had done earlier in the season (not flagged), Aubameyang and Ayew would both have scored and celebrated. The VAR check would have confirmed the goal. VAR could not give what was already given.

Changing behaviour of the assistant referees may be an attempt to show that VAR can actually give goals. Don't be fooled. VAR hasn't changed, the assistant referees have. 

Have the Geordies Finally Cracked?

2/10/2019

 
By David Butler

​Newcastle United supporters are renowned for following their team through thick and thin. While the fans have longstanding grievances with their owner, they still usually turned up on match day, often to protest first.  

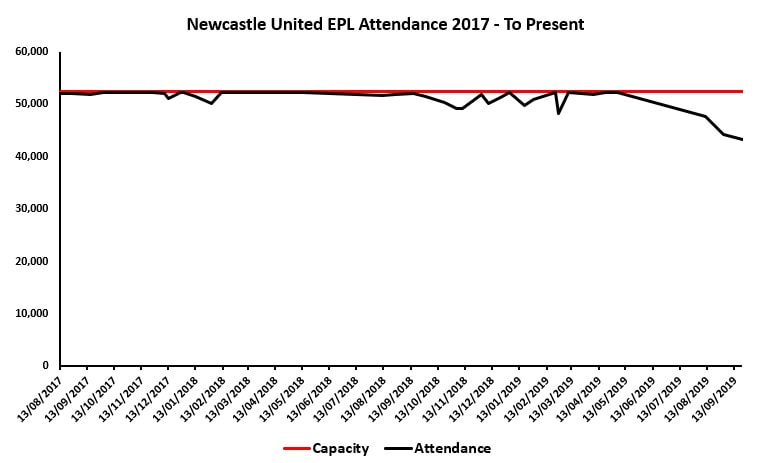
The Geordies may finally had enough – the first three home matches attracted crowds of 47,635 (Arsenal) 44,157 (Watford) and 43,360 (Brighton). Even a shock 1-0  win at Tottenham (the bookies gave Newcastle a ~9% chance of success) wasn’t enough to get a full house for the Watford game. The attendance figures at St. James Park have been the lowest for the past three seasons for the Premier League home matches this year – 91% vs Arsenal, 84% vs Watford and 83% vs Brighton.
​
It’s worrying times on Tyneside. 
Picture

    Archives

    February 2023
    January 2023
    December 2022
    November 2022
    October 2022
    September 2022
    August 2022
    July 2022
    June 2022
    May 2022
    April 2022
    March 2022
    February 2022
    January 2022
    December 2021
    November 2021
    October 2021
    September 2021
    August 2021
    July 2021
    June 2021
    May 2021
    April 2021
    March 2021
    February 2021
    January 2021
    December 2020
    November 2020
    October 2020
    September 2020
    August 2020
    July 2020
    June 2020
    May 2020
    April 2020
    March 2020
    February 2020
    January 2020
    December 2019
    November 2019
    October 2019
    September 2019
    August 2019
    June 2019
    May 2019
    April 2019
    March 2019
    February 2019
    January 2019
    December 2018
    November 2018
    October 2018
    September 2018
    August 2018
    July 2018
    June 2018
    May 2018
    April 2018
    March 2018
    February 2018
    January 2018
    December 2017
    November 2017
    October 2017
    September 2017
    August 2017
    July 2017
    June 2017
    May 2017
    April 2017
    March 2017
    February 2017
    January 2017
    December 2016
    November 2016
    October 2016
    September 2016
    August 2016
    July 2016
    June 2016
    May 2016
    April 2016
    March 2016
    February 2016
    January 2016
    December 2015
    November 2015
    October 2015
    September 2015
    August 2015
    July 2015
    June 2015
    May 2015
    April 2015
    March 2015
    February 2015
    January 2015
    December 2014
    November 2014
    October 2014
    September 2014
    August 2014
    July 2014
    June 2014
    May 2014
    April 2014
    March 2014
    February 2014
    January 2014
    December 2013
    November 2013
    October 2013
    September 2013
    August 2013
    July 2013

    About

    This website was founded in July 2013.

    RSS Feed

    Categories

    All
    American Football
    Athletics
    Baseball
    Basketball
    Behavioural Economics
    Boxing
    Broadcasting
    Competitive Balance
    Cricket
    Cycling
    Darts
    David Butler
    Declan Jordan
    Drugs
    Ed Valentine
    Epl
    Esports
    Expenditure
    F1
    Fifa World Cup
    Finances
    Funding
    Gaa
    Gaelic Games
    Gambling
    Game Theory
    Gary Burns
    Geography
    Golf
    Greyhound Racing
    Guest Posts
    Horse Racing
    Impact Studies
    John Considine
    John Eakins
    League Of Ireland
    Location
    Media
    Mls
    Mma
    Olympics
    Participation
    Paul O'Sullivan
    Premier League
    Regulation
    Research
    Robbie Butler
    Rugby
    Simpsonomics
    Snooker
    Soccer
    Spatial Analysis
    Sporting Bodies
    Stephen Brosnan
    Swimming
    Taxation
    Teaching
    Technology
    Tennis
    Transfers
    Uefa
    Ufc
    World Cup
    Wwe

Related

The website is not formally affiliated to any institution and all of the entries represent the personal views and opinions of an individual contributor. The website operates on a not-for-profit basis. For this reason we decline all advertisement opportunities. 

Contact

To contact us email sportseconomics2013@gmail.com or find us on Twitter @SportEcon.