The Economics of Sport
  • Sports Economics
  • About
  • Workshop
  • Selected Publications
  • Book Reviews
  • A Primer on Gaelic Games
  • Upcoming Events
  • Media
  • Education
  • Resources & Links
  • Data

Efficiency Wages in the Premier League

31/5/2021

 
By Stephen Brosnan

In previous blog posts I explored the relationship between Premier League club’s salaries and team performance (here, here and here). The findings generally support the hypothesis set forth by Kuper and Szymanski that spending on players’ salaries is a better predictor of performance than net spending on transfers. Furthermore, these posts suggest managers of ‘inefficient’ teams tend to get fired while mangers of ‘efficient’ teams retain their roles. This post considers these issues by exploring the relationship between Premier League club’s spending on player salaries and team performance during the 2020/21 Premier League season.
Picture
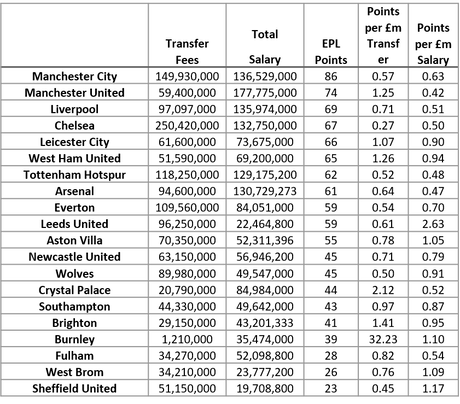
This season the average annual wage bill of Premier League clubs was approximately £78 million. Manchester United had the highest annual salary (£177 million) while relegated Sheffield United had the lowest spend on player’s salaries (£19.7 million). This represents just 25% of the league average and partly explains why the Blades were unable to overcome second season syndrome in the Premier League. Surprisingly, the club ranks second in points earned per million spent on players salaries (1.17 points per £m) which suggests the clubs fortunes may have improved with some further investment.
​
So which clubs have been the most efficient? The figure below shows Premier League team’s total points and spending on salaries for 2021.
Picture
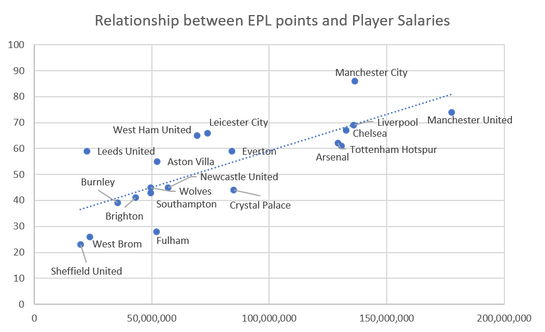
All the teams above the line can be considered ‘efficient’ while the performance of teams below the line is considered ‘inefficient’. The efficient performers include champions Manchester City, West Ham, Leicester, Leeds, Aston Villa and Everton. These clubs have outperformed their expected points based on players salaries. Leeds are the best performing team as measured by points per million spent on player salaries. Marcelo Bielsa’s side have picked up 2.63 points per million in the maiden season back in the Premier League.

It appears that efficiency matters as none of the six ‘efficient’ clubs changed manager throughout the season while six of the fourteen ‘inefficient’ clubs (43%) changed managers including the recent departures of Roy Hodgson (Crystal Palace), Nuno Santo (Wolves) and Sam Allardyce (West Brom). Even managers of inefficient teams that retained their jobs have been under intense scrutiny for much of the season which suggests Mikel Arteta, Steve Bruce and Ole Gunnar Solskjaer will be under increasing pressure to improve the performances of their teams next season or risk being the next manager facing the chop.

Irish Open Golf Courses

28/5/2021

 
By Sean Murphy*

​If you fancy playing a golf course that hosted an Irish open, what can you expect to pay? A fair amount. The average price of a green fee is €185.  
 
Why is this?  To start, these are well regarded courses if we are to judge by their rating on Tripadvisor. All these courses were rated above 4.5 by Tripadvisor out of 5 stars. The only 5 star rated course was Royal County Down which has been voted the number one golf course in the entire world in 2020 and 2021 by Golf Digest.
Picture
​Championship courses are a tough challenge to golfers of all levels, to get these courses in tip top shape there is clearly a maintenance cost and with championship courses being longer than your every-day country club it is no wonder the price charged is higher. Golfers will always love a challenge and what better way to do it then to challenge yourself on the courses that the best players in the world played on.
 
Hosting an Irish open is a huge honour which only 21 golf courses actually managed to do. This may be a factor that increases prices.  These courses are listed in the table below.
Picture
The first Irish open was held in Portmarnock Golf Links in 1927.  The Irish Open was played annually, expect for the war years, until 1950. There was an event in 1953, but the event was not played again until revived in 1975. From 1963 to 1974 there was a sponsored tournament, generally called the Carroll’s international and in 1975 they became the sponsor of the Irish open which became known as the Carroll’s Irish Open.
 
Portmarnock Golf Links has hosted the Irish open an incredible 19 times, its closest challenger was Royal Dublin golf club which hosted the Irish open 6 times. Many of these golf courses were founded before the 1900s, with the average year of the golf course being founded being 1931.  An interesting point is that there was never a course in the province of Connaught to host an Irish open.
 
In recent years, as can be seen towards the end of the table, the Irish Open has moved between venues. This has also coincided with the Rolex Series.The Rolex series started in 2017, with each tournament in the series having a minimum prize fund of $7 million.

*Sean is currently registered as an MSc by research student in Sports Economics at UCC. His masters thesis considers pricing models for Irish golf courses. 

Europa League Final - England Versus Spain

26/5/2021

 
By Robbie Butler

The Europa League Final will be contested tonight in the Stadion Miejski, Gdańsk between Manchester United and Villarreal. Regardless of the winner, tonight will confirm a decade of dominance in the competition by both English and Spanish clubs. 

The last time a club outside of these two leagues won the Europa League was in 2010/11 when Porto defeated Braga in Dublin (I was there). Since then Spanish clubs have won the title 6 times, and English clubs 3 times.

Such dominance by two leagues is unprecedented in the 50 year history of the tournament. It strikes at the heart of competitive balance. Where are the other leagues gone? There has not been a Italian winner since 1999 (Parma) and no German winner since Schalke in 1997.

It would appear than the depth of the English and Spanish leagues is helping teams progress in the Europa League with no little help from the Champions League back-door route. Manchester United will have taken this road should they win tonight, and Seville's remarkable record since 2006 (winning the trophy 6 times!) has been ably assisted by a Champions League Group Stage exit.

Given the quality of the Premier League and La Liga, continued dominance in this competition is likely. A final in Seville, Spain next year will certainly help motivate La Liga clubs. As if Seville needed an extra help in the Europa League!

Virus-Induced Changes to GAA Broadcasting

24/5/2021

 
By John Considine
Picture
Italy won last Saturday's Eurovision Song Contest.  The contest is the music equivalent of the recently proposed European Super League.  It was established by a cartel of European public sector broadcasters.  It reflected the difference in the broadcasting landscape either side of the Atlantic.  That landscape had, and continues to have, implications for the broadcasting of sport.  A prime example is the EU Television Without Frontier directive where some sporting events have to be shown on free-to-air TV with a large market penetration.

There are other differences between the way sport is broadcast in the US and in Europe.  Some are driven by the sporting landscape.  American football, baseball, and basketball have many breaks in the activity that make them suitable for commercial TV where adverts can be sold.  By contrast, a game of soccer has one scheduled break in the middle of two 45-minute periods of activity.  In relative terms, the game is more suitable to subscription TV.

When soccer games returned after the initial lockdown, there was a water-break.  The change did not last long and the water break is now gone.  The water-break was an opportunity for the game to go to a four-quarter format.  That would have been an opportunity for broadcasters to sell advertising.  It could also make the game fairer by switching ends at the end of each quarter as in American football.

The water-break remains in GAA games.  I presume that in any return to "normality" the water-break will disappear from the game.  It is something that should be considered carefully.  My proposal would be for four quarters of twenty minutes each (with team swapping ends at each quarter).  It is 50 years since the GAA had games that had to last 80 minutes.  However, current games last nearly 80 minutes and there is no comparison in the athletes of today and those of the early 1970s.  A planned break after every twenty minutes would probably be financial rewarding.  It might also help mitigate against some of the weather induced "games of two halves".

Any return to "normality" will probably also change what is offered on the GAA broadcasting landscape.  Or maybe not.  There has been an evolution in the way GAA games are broadcast.  The pandemic has increased the speed of this evolution.  But some recently introduced changes might be reversed.  At the highest level of the game (inter-county), someone living in Ireland can purchase a subscription to a set of GAA games and/or they can purchase particular games on a pay-per-view basis.  When spectators are allowed return to venues to watch games, there might be an inclination to curtail the availability of what can be purchased.  Again, I would suggest that some of the changes are retained.  Those decision makers, with access to the data on viewership, should evaluate the possibilities.

I have talked to some of those involved below broadcasting/streaming "lower" level games.  Those conversations, and the associated viewing figures, suggest that there is an audience for broadcasting/streaming services beyond those who would go to the venues.  Again, there is food for thought for those deciding how supporters will be allowed see their teams when crowds return to venues.  I will deal with this lower end of GAA broadcasting in a future post. 

James Quirk Memorial Prize in Sports Economics

21/5/2021

 
By Robbie Butler

The 2021/22 academic year at University College Cork will see the awarding of the James Quirk Memorial Prize in Sports Economics. The prize is open to all students registered in sports economics at UCC and is funded by the Quirk Estate in Kansas, United States.

As said previously on this forum, Jim a retired Caltech Economics Professor (1971-1987) and a leading voice in sports economics who passed away in June of last year. In 1971 he published “An Economic Model of a Professional Sports League” with Mohamed El Hodiri in the Journal of Political Economy and would go on to publish many other highly influential papers in sports economics and related areas. 

The prize can be found listed here on the UCC website.

Sneakernomics

18/5/2021

 
Sneakernomics is produced by BBC Radio 4.  It is written and presented by Nicholas Smith. ​
Picture

Cycling and Television

17/5/2021

 
By John Considine
Picture
Yesterday, as I watched the closing kilometers of Stage 9 of the Giro, I was reminded of how cycling depends on television.  The final 1.6km of the 158km stage was on gravel.  It was the final short "climb" of a stage with four previous climbs (see profile opposite).  An ideal stage for a Sunday TV audience.

In an edited volume on The Economics of Professional Road Cycling, Daam Van Reeth sets out some of the reasons for the successful marriage between cycling and television.  Cycling needs broadcast technology in a way that other sports do not.  A spectator at the finish line of yesterday's stage would have got to see who won the race and the last few meters of cycling.  Without technology they would not have known when the leaders would arrive or what happened during most of the four hours of cycling.  Contrast this with a spectator at the FA Cup final the previous day.  Such a spectator could have watched Leicester defeat Chelsea without ever accessing technology.  They could have taken in the 90+ minutes from the comfort of their seat in Wembley.

The cameras located on the motorcycles amongst the riders and in the helicopters above the riders make the broadcast a promotional tool for regional authorities.  Van Reeth explains how the Giro took the lead in the displaying of non-sporting information in 2013.  Information about the local landscape, buildings, and food feature regularly.  A welcome addition when the action can be limited.

A key feature is that many of the stages in a Grand Tour like the Giro tend to be contested and broadcasted outside prime time for TV.  This has its advantages and disadvantages.  Broadcasters can view it as an alternative to re-runs of soaps, sitcoms, or crime shows.  But it also means that weekday broadcasts attract fewer viewers.  Outside the Tour de France, most races struggle to bring in large numbers.  This is why the potentially more exciting stages are scheduled for the weekend.  The addition of 1.6km of gravel added to the spectacle for the TV audience.

On the sporting side, the main contenders hunted down the breakaway riders on the gravel.  The stage winner moved into the overall leader's pink jersey and, at the end of the stage, the top 10 General Classification riders were within one minute of each other.  A stage that was well designed and well scheduled for a TV audience.

EPL COVID Trend

11/5/2021

 
By David Butler

As the football season is ending for major European leagues it's timely to consider the COVID positive trends over the season. The chart below plots the trend in COVID positive cases for Premier League clubs from the 31st August to May 9th.

On average, there was 7 weekly positive cases in the EPL and a median of 4. 2,111 weekly tests were carried out on average. With the exception of the tests over three match weeks from the 21st of December to the 10th of January, the positivity rate did not reach 1%.  It hovered between 1%- 2% during the Christmas period.

There is a noticeable dip on the 1st-3rd January. Only 12 individuals were COVID positive. This was a shorter time period than usual and only 984 tests were carried out. I would guess the true number  of positive cases was higher. These positive cases may have been picked up the following week too, where we see the peak of 36 positive cases.
​
The positivity rate tumbled from February. The 19th-25th of April was the first week of the season where no positive cases were recorded.  
Picture

Republic Of Ireland Qualifying Results

6/5/2021

 
By Sean O'Connor

Ireland’s opening two results for the 2022 FIFA World Cup qualifying campaign has made it extremely unlikely that Stephen Kenny and his team will be playing in Qatar come next winter. For many, this will mark another major tournament that they will not be able to attend to support the Boys in Green. While some supporters are more results orientated, others might prefer for Ireland to play a more attractive brand of football and then there is the middle ground who would like a half-way house of the two. In order to compare Kenny’s Ireland team to what has come before him, it is useful to look at how Irish teams have fared in previous qualifying campaigns. 

Today’s post looks at the fortune of Irish teams throughout qualifying campaigns from World Cup 1986, up to and including the recent Euro 2020 (2021) campaign under Mick McCarthy.  In total, the results of 167 qualifying games are examined. Play-off games are not taken into account. Figure 1 plots the distribution of score lines. To interpret, a score of 2-2 in a game would have a difference of 0, while a 3-1 win would have a difference of 2 and a 2-1 loss would have a difference of -1.

As can be seen from the below, nearly 4 in 10 Irish qualifying games (35.2%) end in a draw. This is then followed by a one goal difference win. 
Picture
Figure 1 – Distribution of results in Irish qualifying games World Cup 86 – Euro 20(21).
As many supporters are probably aware, games involving Ireland tend to be extremely close contests, with the small margins generally making the difference.

We can also examine this by seedings and draw some interesting insights. Table 1 below expands on the graph above but breaks results out by seedings. Note prior to looking at this we should note that across different qualifying campaigns the number of teams in a group differ. Of the 17 qualifying campaigns examined, in 7 cases there were 5-team groups, in 9 cases there were 6-team groups and on 1 occasion it was a 7-team group.

Of the most frequent results against opposition teams the following are the most frequent results:
   Top seeds - Draw followed by one goal winning margin.
   Second seeds - Draw followed by one goal losing margin.
   Third seeds - Draw followed by a one goal losing margin.
   Fourth seeds - Draw followed by a one goal winning margin.
   Fifth seeds - One goal winning margin followed by a two and three goal winning margin.
   Sixth and Seventh seeds - Two goal winning margin followed by a draw and three goal winning margin.
Picture
Table 1 – Distribution of results in Irish qualifying games World Cup 86 – Euro 20(21), by seeding.
​Finally, we can condense Table 1 further and include the addition of points achieved by Ireland against different seedings. This is done in Table 2. To interpret, out of the total 96 available points against first seeds, Ireland have won 33 or have 34.4%. As we might have thought, the majority of points for Ireland tend to come against lower seeded teams. It will be interesting to see if this trend will hold under our latest manager moving forward. 
Picture
Table 2 – Distribution of results in Irish qualifying games World Cup 86 – Euro 20(21), by seeding and points.

Covid-19 And European League Winning Streaks

4/5/2021

 
By Robbie Butler

When almost all UEFA football came to a halt in March 2020, European leagues became frozen in time. Some leagues were cancelled, others used predicted points to reach a final league table, and others returned to play in empty stadiums during the summer months. 

While Liverpool finally won the Premier League and Real Madrid La Liga, the other three big leagues in Europe were won by the defending champions - PSG, Bayern Munich and Juventus. In the cases of Bayern and Juve, it was their 8th and 9th consecutive league titles.

​They were not alone in UEFA leagues in this regard. Prior to the outbreak of Covid-19, eight teams in Europe had winning streaks of 6 years or more. These are presented to the left below.
Picture*2019/20 was cancelled.
Following the resumption of football behind closed doors it is interesting to observe how many of these streaks survived. 

Probably the most high-profile casualties were the two teams seeking 10-in-a-row; Celtic and Juventus. Both the Scottish and Italian champions failed to live up to expectations during the 2020/21 season when playing behind closed doors.

Of course, this is not the only reason why they may have come up well short, but neither looked like winning their 10th title in a row from early in the season. Inter Milan (last weekend) and Rangers (a number of weeks ago) have already been crowned champions of Italy and Scotland respectively. 

But these two are not alone in losing their streak. APOEL and Astana both lost their streaks in 2020 and 2021. Of the 8 teams that entered the Covid-19 era with a streak in tact, just 4 are still standing; Bayern, Ludogorets, Qarabag and Red Bull Salzburg. 

It will be interesting to see if a return of fans helps or hinders the cause of the four remaining streaks that have survived Covid. 

    Archives

    March 2023
    February 2023
    January 2023
    December 2022
    November 2022
    October 2022
    September 2022
    August 2022
    July 2022
    June 2022
    May 2022
    April 2022
    March 2022
    February 2022
    January 2022
    December 2021
    November 2021
    October 2021
    September 2021
    August 2021
    July 2021
    June 2021
    May 2021
    April 2021
    March 2021
    February 2021
    January 2021
    December 2020
    November 2020
    October 2020
    September 2020
    August 2020
    July 2020
    June 2020
    May 2020
    April 2020
    March 2020
    February 2020
    January 2020
    December 2019
    November 2019
    October 2019
    September 2019
    August 2019
    June 2019
    May 2019
    April 2019
    March 2019
    February 2019
    January 2019
    December 2018
    November 2018
    October 2018
    September 2018
    August 2018
    July 2018
    June 2018
    May 2018
    April 2018
    March 2018
    February 2018
    January 2018
    December 2017
    November 2017
    October 2017
    September 2017
    August 2017
    July 2017
    June 2017
    May 2017
    April 2017
    March 2017
    February 2017
    January 2017
    December 2016
    November 2016
    October 2016
    September 2016
    August 2016
    July 2016
    June 2016
    May 2016
    April 2016
    March 2016
    February 2016
    January 2016
    December 2015
    November 2015
    October 2015
    September 2015
    August 2015
    July 2015
    June 2015
    May 2015
    April 2015
    March 2015
    February 2015
    January 2015
    December 2014
    November 2014
    October 2014
    September 2014
    August 2014
    July 2014
    June 2014
    May 2014
    April 2014
    March 2014
    February 2014
    January 2014
    December 2013
    November 2013
    October 2013
    September 2013
    August 2013
    July 2013

    About

    This website was founded in July 2013.

    RSS Feed

    Categories

    All
    American Football
    Athletics
    Baseball
    Basketball
    Behavioural Economics
    Boxing
    Broadcasting
    Competitive Balance
    Cricket
    Cycling
    Darts
    David Butler
    Declan Jordan
    Drugs
    Ed Valentine
    Epl
    Esports
    Expenditure
    F1
    Fifa World Cup
    Finances
    Funding
    Gaa
    Gaelic Games
    Gambling
    Game Theory
    Gary Burns
    Geography
    Golf
    Greyhound Racing
    Guest Posts
    Horse Racing
    Impact Studies
    John Considine
    John Eakins
    League Of Ireland
    Location
    Media
    Mls
    Mma
    Olympics
    Participation
    Paul O'Sullivan
    Premier League
    Regulation
    Research
    Robbie Butler
    Rugby
    Simpsonomics
    Snooker
    Soccer
    Spatial Analysis
    Sporting Bodies
    Stephen Brosnan
    Swimming
    Taxation
    Teaching
    Technology
    Tennis
    Transfers
    Uefa
    Ufc
    World Cup
    Wwe

Related

The website is not formally affiliated to any institution and all of the entries represent the personal views and opinions of an individual contributor. The website operates on a not-for-profit basis. For this reason we decline all advertisement opportunities. 

Contact

To contact us email sportseconomics2013@gmail.com or find us on Twitter @SportEcon.