The Economics of Sport
  • Sports Economics
  • About
  • Workshop
  • Selected Publications
  • Book Reviews
  • A Primer on Gaelic Games
  • Upcoming Events
  • Media
  • Education
  • Resources & Links
  • Data

Fairness, Finance and Fixity of Fixtures

30/4/2015

 
By John Considine
Ireland won the 2015 Six Nations championship in dramatic fashion.  Before any game was played on the final day, three teams had similar win/loss records, i.e. 3 wins and 1 loss.  The teams were England, Ireland and Wales.  The ordering at the top of the table was determined by point difference.  On that criteria England were top, Ireland were second, and Wales were third.  As luck would have it the three teams were involved in different games.  Wales played Italy in the first game knowing the minimum points victory they needed to potentially overhaul the teams above them.  They hit that target with points to spare.  Then Ireland took the field against Scotland knowing what the exact amount they had to win by in order to overhaul Wales.  Ireland succeeded in overhauling Wales.  Then England played France knowing what they had to do.

In the lead up to the game, and in its aftermath, there were questions raised about the fairness of teams kicking-off at different times.  The usual argument was that it was not done in some specified other sports.  Others just expressed outrage that this was done for the benefit of securing the maximum amount in broadcast rights.  In this particular case, it is difficult to say that on the morning of the games the sequence gave any particular team an advantage.  It is also difficult to say what team had an advantage after the first game.  Ireland knew how much they had to win by to pass Wales but I know plenty of supporters who felt it was too big a target.  How did the Irish players feel?  They would have to balance the certainty of what was need to beat Wales, with the uncertainty of what was needed to beat England, with the fairly hefty margin set by Wales.  And, they were probably being told to forget all of that and concentrate on their own game.  It is impossible to say if Ireland had an advantage.  The same could be said about England in the moments before their game.

Different starting times can be a problem where other results align the incentives for the competitors in subsequent games.  This is not a problem for the Six Nations in the way it has been a problem for the group stages of FIFA World Cup competitions (read about the "disgrace of Gijon
here or the problem with perverse incentives in sport here and here).

Different starting times are also not a problem in single game elimination tournaments.  The loser is eliminated.  The single game elimination tournament has a way of focusing the mind that does not exist in many other competition formats.  It is not surprising that it featured prominently in the early development of most sports.  However, the uncertainty surrounding revenue from such a competition structure meant it did not survive long.  The economics of the situation resulted in teams seeking "fixity of fixtures" and soon the league structure came to dominate most mass spectator sports.

A league structure can bring its own problems.  A topical example comes from English football's League 1 where the team selections of Swindon Town have become a talking point.  Swindon will be involved in the playoff for promotion when the league games are finished.  It is possible that they have been using their last couple of games to prepare for the playoffs.  This could include resting some of their better players.  The problem is that they were playing teams seeking automatic promotion.  For example, the Swindon team that lost 3-0 to Preston North End was missing a number of first-team regulars.  MK Dons are in a battle with Preston for automatic promotion.  They might feel aggrieved with what Swindon are doing.  If Preston win their last game then their is a chance Swindon could meet the MK Dons in a promotion playoff.  Will sporting karma come back to bite Swindon?

Swapping & Prospect Theory

29/4/2015

 
By David Butler

Just under a year ago I spoke about children trading soccer stickers in the
playground. This struck a chord with some students and since then I've been asked about collecting and swapping stickers – I think it’s the case that just like playing sport, nearly everyone has experience being a  collector of some sort.  The Economist newspaper recently put the Economics of the Playground more persuasively than I could, when they said that, “for evidence that the inclination to barter and truck is in our genes, one need venture no farther than the nearest schoolyard. Lurking within school walls is a thriving economy...”

Rather than just chatting about these ideas and the fun of collecting, I try to teach my students some Behavioural Economics too. I usually advise them to check out John List’s now quite famous 2003 and 2004 papers -
Does Market Experience Eliminate Market Anomalies? and Neoclassical Theory versus Prospect Theory: Evidence from the Marketplace.

List, who is well known in economics for carrying out cool field experiments, connected the idea of sports card trading with concepts from Behavioural Economics by going on the road and visiting a trade show.  His intention was to explore the idea of Reference Dependence and test for the Endowment Effect.  This is the tendency for people to place a higher value on goods they own. The key question of these studies was whether this Endowment Effect, that shows up in the laboratory, existed in the field or ‘real world’ - was it the case that people were just loss averse in the lab, but that this behaviour would wash in the marketplace?

At the trade show List got two groups of participants, all of whom naturally had different experience levels trading sports cards. He randomly assigned sports memorabilia to both groups for filling in a questionnaire. In this form participants were asked how much practice they had trading cards – if you traded more than 6 times a month you were considered experienced. The first group got a ticket stub for the Kansas City Royals and the second group got a commemorative cert for the Milwaukee Beavers. List must have deemed these to be of equal value to sports enthusiasts. Participants were then offered the opportunity to trade. Standard economic theory would predict that 50% of the memorabilia would be traded.

The results were interesting – participants who didn't have much trading experience traded very little (only 6.8% of the time).  List compared these results to the predictions of the standard economic model and suggested that it was evidence of the Endowment Effect in a natural setting. What about those participants that were considered experienced?  These participants traded a lot more (46.7% of the time). This was not down to the indifference of inexperienced subjects. As a separate experiment showed, this group also wanted a lot more money to give up their endowed memorabilia than the experienced group.

But there was a causality issue however - was it the case that experience was causing participants not to exhibit the Endowment Effect or was it that people who lack the Endowment Effect are more likely to trade? Also, maybe novices where just scared of being ripped off?  List had to control for experience over time. To do this he returned to the trade show a year later and actually managed to catch up with many of the same participants. Again, he asked them how much they traded. Curiously, he found that as traders got more experienced the Endowment Effect decreased, supporting the idea that experience made traders savvier and that the market can wash out this effect. In his later 2004 paper, List showed that this trading experience can actually spill over as collectors that are more experienced in card trading are also less likely to exhibit the Endowment Effect when it comes to other goods.   

While not doubting that adults and children think differently, maybe if we want school kids to be savvy in the market place it’s a good idea to give them lots of time to swap and trade.The playground definitely offers children an early place to engage in exchange where some shadow pricing system usually exists. Maybe kids might learn more economics at lunch time than in class and perhaps become a little bit more rational along the way too!

Goal Scoring In The League Of Ireland

28/4/2015

 
By Robbie Butler,

Recently, David Butler wrote on the complexity of the League of Ireland, an entry which attracted quite a bit of attention. The post had been stimulated by research we are conducting in the area. Another snippet from this considers the number of goals scored on the back of the various rule changes initiated in the League from 1971 to 2014.

One of the many common mistakes we make as decision-makers is  to over estimate the chances of an unlikely event occurring, despite evidence existing to the contrary. One such example can be seen in sports betting. Betting shops often advertise score line results prior to games. One such example I saw recently was for the Burnley vs. Arsenal match. The ad read (if my memory serves me right), "Burnley 1 - 4  Arsenal 22-1. Bet €10 collect €230". The game ended Burnley 0 - 1 Arsenal. The simple fact is that very few games ever end up 1 - 4. The League of Ireland is no different.

Below is a matrix which provides an overview of the frequency of match results in the League of Ireland from 1971 to 2014. These results are very similar to those of the Football League in England.
Picture
The most frequent score is a 1-1 draw, followed by a 1-0 win, and scoreless draw. An analysis of the English Football League from 1888 to 2013 reports an identical hierarchy, with a 1-1 draw the most frequent result (11.6%) followed by a 1-0 home win (9.8%), and scoreless draw (7.2%), 

In the context of the LoI more than 40% of games ended either 0-0, 1-0, 0-1 or 1-1. Including games that finished 2-0, 2-1, 2-2, 0-2 and 1-2 we find that more than 71% of games are covered by these nine possible score lines. Including score lines 3-0, 3-1, 3-2, 3-3, 0-3, 1-3 and 2-3, we find that 89% of games end in results ranging from scoreless draws at one extreme to games where both teams scored 3 goals each, with the match ended tied at 3-3. Every other scoreline is made up by the remaining 10%. 

So when you watch a match, the chances of 1-4 are very limited. It's probably best to expect 1-1 or 1-0.

Interpreting Sporting Information

27/4/2015

 
By John Considine
Last week, during his presentation on sports analytics, Bill Gerrard made a reference to the difference in the ways a "walk" can be interpreted in baseball, e.g. a negative for the pitcher or a plus for the batter.  Different interpretations can be placed on sporting data.  Two examples from last week highlight how this can happen.

Last week, West Ham United were at pains to explain that their offer of the lowest ticket prices in the Premier League was based on their share of broadcast revenue rather than being facilitated by their successful efforts at securing the use of the Olympic Stadium
(
The Guardian account can be found
here).  West Ham are determined to ensure that they are not accused of securing an unfair advantage from the deal.  EU State Aid rules seek to prevent Member States tilting the playing surface in favour of one of the competitors.  The rules are designed to ensure a level playing field.  If West Ham was secured a stadium through government resources that conferred an advantage on West Ham then other clubs might complain.  Problems might arise because lower stadium costs could allow West Ham to use the resources saved to bid above the odds for playing talent or to reduce their ticket prices.  Rivals would argue that their ability to compete for players or fans is hampered by the actions of the government.  West Ham sell the story of ticket price reductions while other raise the issue of state aid (here).  I would be shocked if any state aid case was taken against West Ham.

Then there is the interpretation of failed drugs tests.  On April 21st, UK Anti-Doping confirmed that rugby league player James Lockwood was being banned for two years (
here).  When I examined the list of Current Sanction on April 24th, the list was dominated by rugby union and rugby league.  Rugby Union players accounted for over a third of the names.  When Rugby League is added to Rugby Union then these two sports account for over 50% of the names on the list.  On Sky Sports, Dewi Morris and Brian Carney argued that rugby players found using substances should be banned for life (here and here).  Crucially, Carney explains how a large number of participants in a particular sport failing drugs tests can be interpreted as a positive.

A relatively large number of drug test failures can show a rigorous testing programme rather than a doping problem for a particular sport.  It might be better to evaluate the testing programmes, and the willingness to publish the results, rather than the number of positives.  As to the harshness of the penalties, there is a possibility that a zero tolerance approach to test failures, including lifetime bans, could be somewhat counterproductive - especially where the testing is conducted in-house.  Where this is possible it might be better to go for a progressively stronger series of penalties.

Martin Ødegaard - Journey Of A Wonderkid

25/4/2015

 
PictureMartin Ødegaard
By Stephen Brosnan,

On 21st January 2015, Real Madrid won the hotly contested race to sign Norwegian ‘wonderkid’ Martin Ødegaard for a fee in the region of €4 million with Ødegaard himself set to earn approximately £80,000 a week at the Bernabéu. However, little under three months later and the deal seems to be turning sour. Ødegaard has reportedly upset teammates and manager Zinedine Zidane at Madrid’s ‘Castilla’ with his attitude and has been subsequently dropped for two games. So what does the future hold for Ødegaard?

Whenever I hear the term ‘wonderkid’ I immediately think of one of my favourite console game ‘Football Manager’.  In the current edition of the series, Ødegaard’s father had to give the developers permission to use his son’s image due to his age. So Ødegaard joins a long list of players to be crowned ‘wonderkids’. The problem with wonderkids is that they are just that, kids, and often don’t live up to the expectations placed upon them. Just five years ago, Football Manager 2010 produced a list of wonderkids that would one day rule world football. A full list of the wonderkids can be found here.

This article focuses on the outcomes of the players that were playing for English clubs at the time. 44 wonderkids were plying their trade in England in 2010.  Table 1 shows the number of wonderkids per club in Football Manager 2010.

Picture
Arsenal had the most wonderkids in their squad at the time (7) reflecting the club’s policy of investing in youth followed by Man United, Man City and Chelsea each with 4 wonderkids in their squads. Overall 11 players (25%) have remained at their clubs since 2010. So where have the others ended up? Perhaps players have left to go on to bigger and better things? Table 2 looks at the where 2010’s wonderkids are playing five years on.

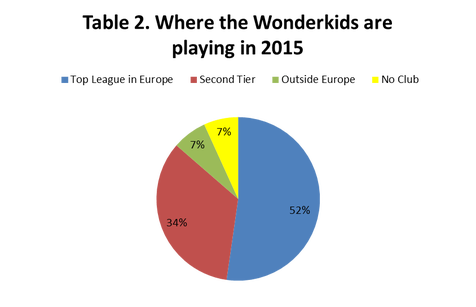
Picture
 
Just over half of the wonderkids are plying their trade in one of Europe’s top tier leagues i.e. in England, Spain, Italy, France or Germany. These include the likes of Gareth Bale, Aaron Ramsey and self proclaimed future Ballon D’or winner Nicolas Bendtner. 34% of players have never reached their potential and are playing in second tier and below of Europe’s top leagues. Players in this group range from one time Man United hopeful Federico Macheda to players who never reached the top of their profession such as Chesterfield’s James O Shea.

7% of 2010’s wonderkids now play outside of Europe with Pedro Botelho (Athletico Minero), Miroslav Stoch (Al Ain) and Vladimir Weiss (Lekhwiya SC) all earning a living in outside of the top tier. Finally, and most worrying for any potential wonderkid, 7% of 2010’s wonderkids are without employment by a professional club. Ched Evans has just served a prison sentence on charges of rape, Michael Johnson once the future of Manchester City has retired from the game at the age of 24, while Jack Collison has been unable to find a club since leaving Ipswich in December 2014.

It’s fair to say the wonderkids of 2010 have seen a mixed bag of results. For every Gareth Bale there is a subsequent Michael Johnson. Football is often a fickle sport with today’s star only an injury away from being tomorrow’s forgotten man. Martin Ødegaard is the current wonderkid but perhaps he should consider putting his head down or risk ending up as little more than the current flavour of the month. 

111 Nationalities in the English Premier League

24/4/2015

 
By David Butler

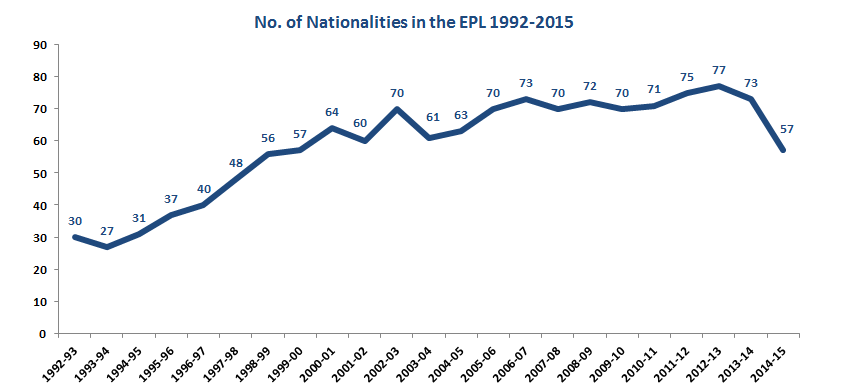
I've had various entries concerning the nationalities of footballers in the elite leagues in England, France, Spain and Germany. The graph below shows the number of nationalities that have featured in each of the 23 EPL seasons to date.

On my count, 111 nationalities have featured
in total over the 23 seasons. This includes players from far away destinations such as Montserrat, Martinique, Pakistan and Iran. As expected, inward migration increased after the Bosman ruling as labour became increasingly mobile.  The increase in the EPL's internationalisation (if 30 nationalities is not international enough) mostly occurred in the 1990's.

The number of nationalities peaked in 2012-2013 season but has declined considerably this season – are we starting to witness the effects of the 2008-2009 home-grown rules in the EPL?


Picture

What's in a Name?

23/4/2015

 
By John Considine
While browsing in Dubray bookshop on Grafton Street recently, I came across a book called When Playing in Red Makes You a Winner.  On closer inspection I realised that the book was effectively the paperback edition of Sportonomic$.  While Gavin Newham dropped the "onomics" reference between editions, the opposite was the case for Soccernomics as an earlier edition was called Why England Lose.

The addition of some part of the word "economics" to the name of a sport, or sport itself, is possibly a follow on from Freakonomics.  Soccernomics takes the last six letters from "economics" and adds it to soccer.  Sportonomic$ used the last seven letters and changes the s to a $.  GAAconomics uses all but the "e".

One wonders if it was the success of Freakonomics, or the bad press economics got during the Great Recession, that seemed to have people steering clear of using the word "economics" by itself.  Stefan Szymanski titled his introduction to the economics of sport as Playbooks and Checkbooks (although "economics" does make it to the subtitle).  Beautiful Game Theory and Circus Maximus also have "economics" in the subtitle.  The word does not feature anywhere in Scorecasting: The Hidden Influence Behind How Sports and Played and Games Are Won.  Then again, it could be argued that it is a book more driven by finance and psychology rather than economics.  Stephen Dobson and John Goddard did use "economics" in the title of their book The Economics of Football but this book was first published in 2001.

"Economics" does show up in the textbooks, e.g. Sports Economics by Rodney Fort and The Economics of Sport by Michael Leeds and Peter von Allmen.  One could argue that these textbooks have their roots in books that did not use the word economics in the title.  Rather, one was more likely to find "business" in the title.  For example, over two decades ago James Quirk and Rodney Fort published Pay Dirt: The Business of Professional Team Sports.  A further two decades before that there was Roger Noll's edited volume Government and the Sports Business.

The Evolution Of The Premier League: Exhibit A

22/4/2015

 
By Robbie Butler

I
’m sure there are very few football matches, let alone Premier League football matches, that have their own Wikipedia page. However, recently I watched a game between Liverpool and Newcastle and thought these clubs might be an exception. The teams provided what most people agree is still the greatest Premier League game of all time, on the 8th of April of 1996. And yes, the historic match, does in fact have its own Wikipedia page. 

While the match was a classic from start to finish, involving a seesawing score line, which eventually culminated in a last minute winning goal by Liverpool’s Stan Collymore, it also demonstrates the internationalisation of both Liverpool and Newcastle, and by extension, the Premier League over the past twenty years. 

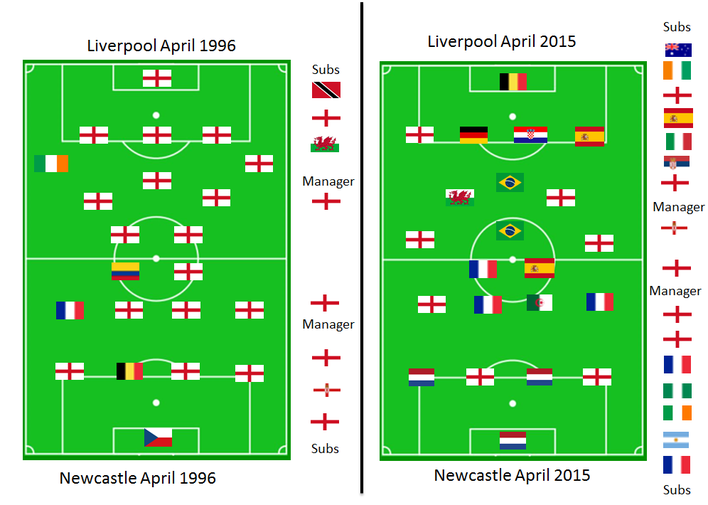
Below I provide two graphics to represent the nationalities that were represented during the matches in April 1996 and April 2015.

Picture
In recent weeks this blog has written pieces on FA plans to limit the number of non-EU players playing in the Premier League. It is clear for the graphics above however than non-EU players are not the problem; EU based players are. 

In 1996, 77% of the starting 22 players were English, 18% were from current EU states, with just 5% from a non-EU country. Fast forward 19 years. Just under one-third of the starting 22 are from England (32%), 55% are from EU states, while 14% are from non-EU countries. The most dramatic rise has not been from outside the European Union, but from within.

Given the structure and objective of EU labour laws it's very difficult to see how changes could be made to protect home grown players without undermining the very essence of the European project - freedom of movement.

Senior Irish Football International Attendances – Part 1

21/4/2015

 
By Sean O'Connor

Debate has raged over the last number of years in regards to the poor figures of fans coming to see ‘The Boys in Green’ play in the redeveloped Lansdowne Road. Numerous theories have been put forward as to the reasoning behind these turn of events. The economic downturn, which resulted in declining disposable income and increasing levels of unemployment, the ticket pricing policy adopted by the FAI, and the growing popularity of other sports, mainly rugby.

These are all reasons put forward as factors influencing football attendances in an Irish context. In sports economics, numerous studies have been conducted to analysing the determinants of football match attendance. One of the most noted is the work of Garcia and Rodriguez (free version of earlier paper available here) who examined Spanish First Division Football League (La Liga) games. Their model included variables which accounted for numerous influences, including economic conditions and match specific factors. They found that quality of the two teams had the highest effects on attendance e.g. better teams attract bigger crowds.

Unfortunately, when it comes to making accurate attendance figures available, the FAI aren't extremely reliable, as noted by Emmet Malone (here). However, in a two part piece I’ll attempt to address how measures of income, unemployment, Irish footballing performance, opposition quality, and match uncertainty have on attendance figures. It should be noted that these attendance figures aren’t entirely robust, as ideally it would be beneficial to have data directly from the FAI. Data has been collected for all Irish senior Internationals played at the Old Lansdowne Road (from Ireland v Lithuania 8/9/1993), Croke Park and the Aviva Stadium (up to Ireland v Poland 29/3/15). Where data is missing the observation is dropped e.g. FIFA do not recognise Gibraltar, therefore they are not included in the study. Given the move to three different stadiums during the period, as well as the fact that capacity can be constrained due to friendlies and competitive matches – particularly in the Old Lansdowne Road, attendance is measured as a percentage of capacity rather than total numbers.

Economic Factors

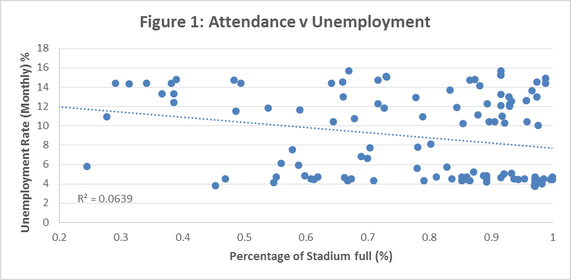
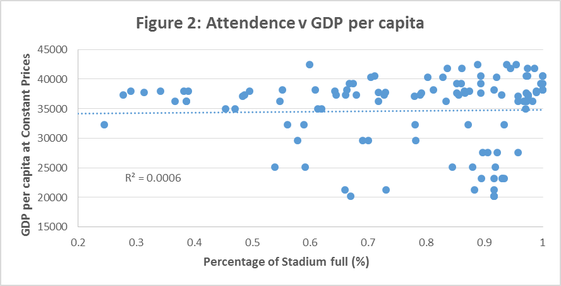
Figure 1 and 2 examine how both the standardised monthly unemployment rate, and GDP per capita have effected attendance.
Picture
As Figure 1, on average increasing levels of unemployment lead to decreasing levels of attendance at Irish internationals, however this relationship is not extremely strong, as noted by the R2 result. It is evident from looking above and below the trend line that stadium capacity was almost reached during periods of high and low unemployment, indicating that unemployment alone cannot explain the factors influencing attendance. However, what about a measure of income, in the form of GDP per capita?
Picture
While Figure 1 provided limited evidence to indicate unemployment levels played a role in influencing crowds, increases in GDP per capita has an even smaller correlation (Figure 2). While the cluster of points at the top right corner would indicate that a relationship exists between high levels of GDP per capita (a rough barometer of income) and increasing attendance, there are many other periods of low levels of GDP per capita and high attendances and high levels of GDP and low attendances. Obviously it’s important to take into consideration the fact that some of these matches are friendlies, perhaps resulting in less demand, while some may be played on weekends and weekdays influencing peoples’ decisions to attend a game.  So while economic factors may not have been an ideal explanation for influencing attendance, what about team quality, and match uncertainty?

A further piece in the coming days will examine these variables, as well as drawing some conclusions on what is influencing Irish International attendance patterns.

Sean O'Connor is a Research Assistant at the Department of Economics, University College Cork.

Rugby World Cup 2011 International Visitors

20/4/2015

 
By Robbie Butler

Recently, there was been media speculation about the potential economic impact that the 2023 Rugby World Cup (RWC) could have on Ireland, if the IRFU were successful in bidding to host the competition. It has been suggested 
the event could be worth up to 1 billion euros in sports tourism and would attract 350,000 international visitors. I hope this is true! What a positive impact this would have on the Irish economy. 

Sadly, an examination of the 2011 World Cup in New Zealand, held from the 9th of September to the 23rd of October 2011 would suggest that things can't be that good. Statistics New Zealand Tatauranga Aotearoa provides an overview of the impact of the 2011 RWC on the national economy by considering five key indicators; migration, accommodation, trade, gross domestic product, and balance of payments. This entry will focus on a key question asked in the impact study: How many visitors came to watch the tournament?

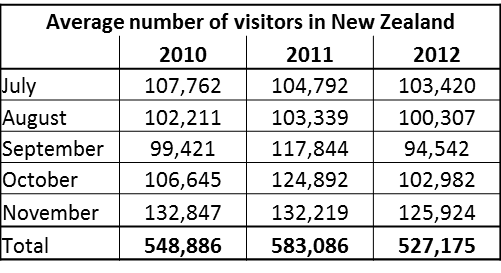
According to the impact study, a person arriving in New Zealand is required to fill out an 'arrival card'. The card explains the purpose of their visit. In the months prior to the RWC a 'RWC visitor' was added to the list of reasons for arrival. This way the government had an accurate estimate of how many people arrived solely to attend matches in the competition. Between September 2011 and October 2011, 127,600 visitors arrived for the purposes of the RWC. The table to the right below lists the total international visitors for 2010, 2011 and 2012, for all visiting purposes (e.g. business, holiday, visiting family). In 2011, just over 242,500 visitors arrived during the months September and October. This means approximately 1 in every 2 visitors was their for the RWC. 

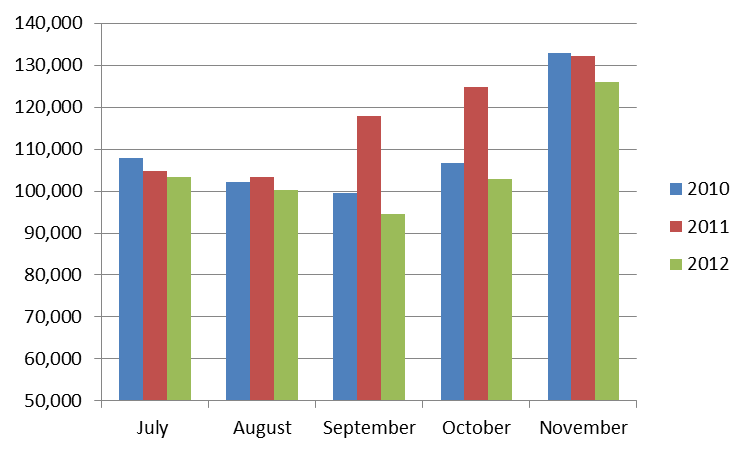
The graphic below shows the size of the increase in visitors numbers due to the event being held in New Zealand. There is  an unquestionable increase in visitor numbers during the months September and October, as indicated by the red bar. In September 2010, 99,421 international visitors arrived in the country. This rises to 117,844 in 2011 and falls to 94,452 in 2012. The net increase was approximately from 18,000 to 23,300 . The same is true of October 2010, 2011 and 2012, where the next increase during the RWC year was from 18,000 to 22,000.

Picture
Source: Statsitics New Zealand
Picture
Source: Statsitics New Zealand
In total, while the report finds that 127,600 visitors arrived for the purposes of the RWC, in real terms the impact of this arrival was lessened by what economists refer to as crowding out. A working paper by Victor Matheson and Robert Baade sums this up nicely when they say: 

"Event tourists may simply supplant other travelers who would normally visit the host venues. A competition that attracts one million sports visitors while displacing an equal number of regular visitors is huge event in by gross measures even though the net impact of the event is negligible. A typical survey approach to measuring economic impact will identify a large number of visitors to a mega-event, but will fail to identify those regular visitors who are displaced. A fundamental shortcoming of economic impact studies pertains, therefore, not to information on spending for those who are included in a direct expenditure survey, but rather with the lack of information on the spending behavior for those who are not". 

An examination of the New Zealand figures would suggest that while 127,600 visitors arrived for the purposes of the RWC, the real increase was somewhere between 36,000 and 45,500 extra visitors. If Ireland is to attract 350,000 visitors it will have to be nearly three times more popular than New Zealand and that's before crowding out effects are considered.
<<Previous

    Archives

    February 2023
    January 2023
    December 2022
    November 2022
    October 2022
    September 2022
    August 2022
    July 2022
    June 2022
    May 2022
    April 2022
    March 2022
    February 2022
    January 2022
    December 2021
    November 2021
    October 2021
    September 2021
    August 2021
    July 2021
    June 2021
    May 2021
    April 2021
    March 2021
    February 2021
    January 2021
    December 2020
    November 2020
    October 2020
    September 2020
    August 2020
    July 2020
    June 2020
    May 2020
    April 2020
    March 2020
    February 2020
    January 2020
    December 2019
    November 2019
    October 2019
    September 2019
    August 2019
    June 2019
    May 2019
    April 2019
    March 2019
    February 2019
    January 2019
    December 2018
    November 2018
    October 2018
    September 2018
    August 2018
    July 2018
    June 2018
    May 2018
    April 2018
    March 2018
    February 2018
    January 2018
    December 2017
    November 2017
    October 2017
    September 2017
    August 2017
    July 2017
    June 2017
    May 2017
    April 2017
    March 2017
    February 2017
    January 2017
    December 2016
    November 2016
    October 2016
    September 2016
    August 2016
    July 2016
    June 2016
    May 2016
    April 2016
    March 2016
    February 2016
    January 2016
    December 2015
    November 2015
    October 2015
    September 2015
    August 2015
    July 2015
    June 2015
    May 2015
    April 2015
    March 2015
    February 2015
    January 2015
    December 2014
    November 2014
    October 2014
    September 2014
    August 2014
    July 2014
    June 2014
    May 2014
    April 2014
    March 2014
    February 2014
    January 2014
    December 2013
    November 2013
    October 2013
    September 2013
    August 2013
    July 2013

    About

    This website was founded in July 2013.

    RSS Feed

    Categories

    All
    American Football
    Athletics
    Baseball
    Basketball
    Behavioural Economics
    Boxing
    Broadcasting
    Competitive Balance
    Cricket
    Cycling
    Darts
    David Butler
    Declan Jordan
    Drugs
    Ed Valentine
    Epl
    Esports
    Expenditure
    F1
    Fifa World Cup
    Finances
    Funding
    Gaa
    Gaelic Games
    Gambling
    Game Theory
    Gary Burns
    Geography
    Golf
    Greyhound Racing
    Guest Posts
    Horse Racing
    Impact Studies
    John Considine
    John Eakins
    League Of Ireland
    Location
    Media
    Mls
    Mma
    Olympics
    Participation
    Paul O'Sullivan
    Premier League
    Regulation
    Research
    Robbie Butler
    Rugby
    Simpsonomics
    Snooker
    Soccer
    Spatial Analysis
    Sporting Bodies
    Stephen Brosnan
    Swimming
    Taxation
    Teaching
    Technology
    Tennis
    Transfers
    Uefa
    Ufc
    World Cup
    Wwe

Related

The website is not formally affiliated to any institution and all of the entries represent the personal views and opinions of an individual contributor. The website operates on a not-for-profit basis. For this reason we decline all advertisement opportunities. 

Contact

To contact us email sportseconomics2013@gmail.com or find us on Twitter @SportEcon.