By James Considine (James is a transition year student) 
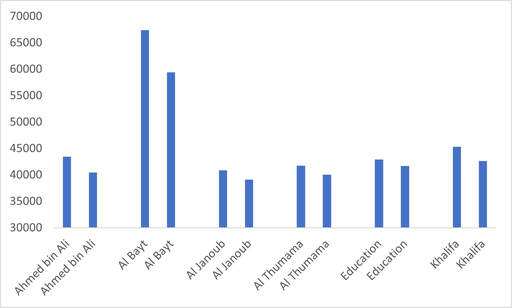
Below is a table containing the sizes of the senior hurling championship venues. The venues in green are where the games in the round-robin Leinster championship were played. It includes a venue outside the province. The final was played in Croke Park. The venues in blue are where the games in the Munster championship were played. Corrigan Park and Austin Stacks Park are where the All-Ireland preliminary quarter-finals were played. 
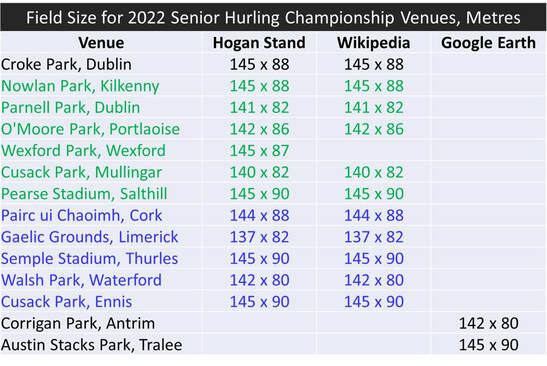
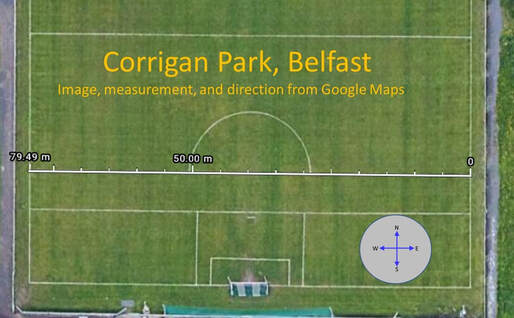
The field sizes for Munster and Leinster games are taken from Wikipedia and the Hogan Stand website. No field sizes were given for Corrigan Park and Austin Stacks Park. To get these field sizes Google Earth was used. The picture below illustrates how this was done. 
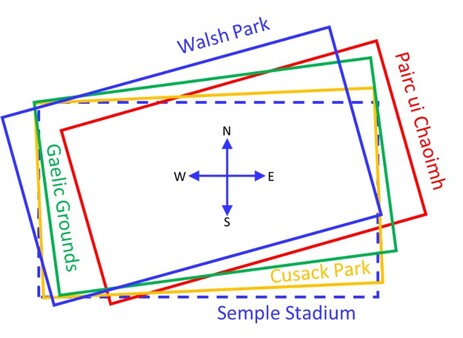
Google Earth also allows us to determine the direction in which the field runs. Corrigan Park runs North-South. The five venues for the Munster championship run mostly West-East with small deviations. This is illustrated below. This can cause the setting sun to impair the players vision. The prevailing wind is from the south-west and most likely to affect Walsh Park and Pairc ui Chaoimh. 
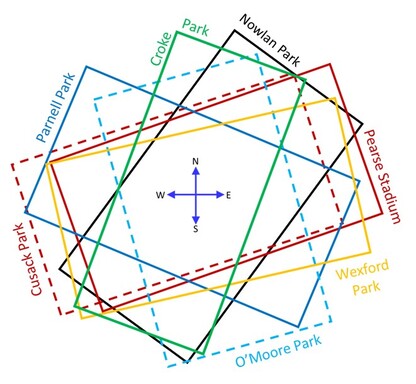
The fields for the Leinster hurling championship have different orientations in comparison to the Munster venues. This is illustrated below.
By Robbie Butler By last night we had seen all 32 teams at the 2022 FIFA World Cup. The 16 games were played across the 8 stadia, with each used twice. Two of the eight (Lusail Stadium and Stadium 974) saw an increase in attendance from Game 1 to Game 2. For Lusail it was an extra 91 fans while Stadium 974 had 3,293 more fans at Portugal vs Ghana, when compared to Mexico vs Poland. However, the remaining six venues have witnessed a drop in attendance demand from Game 1 to Game 2. I wonder why? The data is presented below. That's a lot of empty seats.
By John Considine On Monday night I was one of the participants on Monday Night Live. The second segment opened with the presenter asking me if money had an impact on success in the GAA. My answer was that financial and human resources have an impact on all competitions. One of the examples I listed was the national Irish academic competition known as the Leaving Certificate. The correlation between postcode and academic performance in the Leaving Certificate has been the subject of debate and action (here). Resources make a difference in sport and in education.
On Tuesday I got an email from a viewer who pointed out that the third level institution where I work distorts sporting competition by offering scholarships to students. I’m not sure if the writer of the email was primarily seeking to provide evidence to support my view about the impact of money on sporting competitions. I don’t think so because there was a line to say that the Universities were making it hard for the other Colleges. This line, making a distinction between the traditional universities and other third level institutes, made me smile. It reminded me of a time around the turn of the century where the traditional universities were complaining about the other institutions. The traditional universities claimed their new competition were making under-the-counter payments to players and having questionable academic standards. This is the usual response when the status quo is challenged. Alex Ferguson complained about the noisy neighbours. Jurgen Klopp is less than happy about what is happening at Newcastle. In the world of Irish third level education it was the new winners like Tralee Institute of Technology and Limerick Institute of Technology that provoked the ire of the traditional winners. The verbal responses eventually turned into financial competition via scholarships. The traditional institutions returned to the winner’s enclosure. My email correspondent pointed out that third level education institutions provide financial aid because of the associate prestige of winning the various competitions. That is indeed a line that is used as justification. They also pointed out that the scholarships are designed to ensure students do not have to take on paid employment. This is where my academic colleagues come in. They are not convinced that the scholarships facilitate attendance at classes. One colleague jokes that they get letters from the sports office asking that the sports person be accommodated academically but that they were never asked to provide a letter to a sports coach asking that the student be accommodated. The email also made a point about the differential help that some children get from having influential parents. It suggested that children of these parents get selected on teams ahead of better players. I don't agree. However, children born to parents who happen to live in Kilkenny have little chance of winning an All-Ireland senior men’s/women’s title in gaelic football. Children born to parents living in Kerry have little chance of winning the Liam McCarthy cup for hurling. Children born in some other counties have little chance of winning either title. Coaches are fond of talking about elite sport being about decision making. One of the best decision a child can make involves the selection of their parents! It will help their sporting and academic chances. By Robbie Butler
Where is all the added time coming from? The World Cup is only 5 games old and already we have seen almost 85 minutes of additional time! That’s about 17 minutes added on per game – effectively a half of extra time added onto each match. Those that watch football regularly will know this is far from the norm. First half added time is normally 1 to 2 minutes; on occasion it can be zero. So far at this World Cup an average of 382.4 seconds or more than 6 minutes has been added on at the end of the first half! In total, the five first halves to date have seen an extra 32 minutes added on. That’s two periods of extra time. The second half figures are even higher. Almost 53 minutes have been added on already in total in just 5 games. That’s more than a half of football! England vs Iran is the standout. More than 27 minutes were added yesterday. England and Iran have effectively played a game with extra time already in the Group Stage. Even though the World Cup is only 5 games old, the tournament minutes are almost six matches. I wonder what broadcasters and advertisers think of these extended halves… Those that want to read more about added time in football can check out our paper from 2017 "Fergie Time and the Allocation of Additional Time: Evidence from the English Premier League 2009 to 2013" available here. By John Considine It was only this week that I read a fascinating 2021 NBER working paper about umpire decisions in baseball. James Archsmith and colleagues examined 3.2 million decisions (ball/strike) by umpires in MLB. They find that the umpires make less errors on important calls. The error rate is measure by comparing the human call with the technological system (PITCHf/x). They measure the importance of a call by when it happens, the score difference, and so on. They call it "leverage". It is illustrated below in Figure 3 (taken from the paper). The black line, labelled "current", captures the importance of the current pitch. It rises dramatically in the 9th innings as there is a change in the scoreline. In these situations there are less errors. Very reassuring.
The story the authors tell is one of efficient use of mental resources by the umpires. It is an explanation that will appeal more to traditional economists than those of the behavioural variety. By David Butler
Football Manager 2023 was released last week. The history of the popular simulation can now be traced back thirty year, and I fondly remember the earlier manifestation of the game - Championship Manager. Like many simulations, the accuracy of the measurement in the franchise has become increasingly accurate as time has gone on. There are strong incentives for the developers to get this right. In a recently published paper in the International Journal of Sports Finance Dennis Coates and I used FM data to estimate the effect of specific player position on salary in Major League Soccer. Our data covers 1,174 salaries for the 2019 and 2020 seasons. We find that the that the ability measures in Football Manager do a good job in explaning a lot of the variation in salary. Also, the exact positional measurement in the simulation allow us to drill down into positional premia/penalties. We confirm the common finding that goalkeepers are paid less. The general 'defensive' penalty is not however borne out. Rather, specific peripheral defensive and wing back positions incur the salary penalty - often these are utility players that cover many defensive positions. We found no penalty, for example, for players that operate as central defenders only. Finally, the FM data also allow us to consider players that play in diverse positions. For example, Wayne Rooney - who could operate as defensive midfielder or forward. We find these generalists earn a premium. By Robbie Butler I am old enough to remember the past 8 World Cups, all the way back to Mexico 1986. Qatar 2022 will be the 9th I remember. For as far back as I can recall, I have never known a World Cup like this. The time, location and built-up all feel different. This is predictable and was predicted by many back in 2010 when Qatar won the right to host the event. The focus has been largely on non-football issues such as labour conditions and human rights issues. The negative attention that Qatar is receiving prior to this World Cup has largely followed the path of Russia in 2018 and Brazil in 2014. For Russia the issues focused the political actions of Vladimir Putin, particularly his annexation of Crimea in 2014. Brazil witnessed mass demonstrations in major cities due to the enormous public spending at the 2014 World Cup (77% approx. of all money spent) to build stadia that would be largely unused after the Finals. While human rights issues rightly dominate the agenda at Qatar 2022, less focus has been paid to the economic cost of hosting this tournament, a issue that has become much more important in recent decades. This is due to the substantial over-runs reported by host countries for all major sporting events and the decision by some countries and cities to withdraw from bidding for major tournaments. These withdrawals have been driven by various means including political promises (Rome) and plebiscite (Calgary).
The graph looks just like long run GDP or GDP per capita from 1 AD to 2022. Russia 2018 corresponds to the start of the Industrial Revolution around 1750. It is sometimes referred to in economics as the "hockey stick" graph. A sporting reference in macroeconomics. Now sports economics can give us the same representation. Here is why.
According to reports the main elements of expenditure include the eight stadiums used for the tournament and a new metro linking these. Six of the eight stadiums have been constructed from scratch, with development only starting in the past 5-6 years for most. These are estimated to have cost between $6.5 billion and $10 billion each - far and away the most expensive stadia ever built. The new metro system - a very impressive piece of infrastructure - will connect all eight venues, which are dispersed across a small geographic area in east Qatar. This will remain long after the event as will the stadia, with reports some will be partially dismantled and sent to other countries in need of sports infrastructure. The estimated economic impact of the event is just $17 billion. That's a loss of more than $200 billion. It makes the losses of Russia, Brazil and South Africa look very small. By David Butler
Waterford play UCD tonight in a repeat of last year’s League of Ireland Promotion/Relegation Play-Off final. It’s nearly 50/50 when it comes to which division the winner (who gains promotion) comes from. Since the playoffs were introduced in the 92/93 season slightly more success has come from the first division side (14 times winner). The remaining 13 winners were the Premier division club. There was 3 seasons with no playoff and the format has changed various times along the way. Waterford have reached the playoff final seven times and have yet to be successful as either the Premier division or First division team. This is UCD’s fifth playoff – they have won three of their previous four finals. What’s interesting from the data is that in the early days of the playoffs the Premier division sides were far more dominant. From 92/93 up to the change to summer soccer in 2003, nine of the twelve winners came from the Premier division. After the switch to summer soccer, the momentum has shifted to the first division team – eleven out of the last fifteen winners have come from the First division… I can't think of a causal reason for this though, it may relate to changing formats rather than the switch. By Robbie Butler In sport today we are familiar with terms such as salary caps, financial fair play, luxury taxes and squad/roster limits. It is less often once hears about the introduction of minimum wage laws, especially in soccer. But this week the League of Ireland gave us one such example and demonstrated the influence that the players' trade union - the Professional Footballers Association of Ireland (PFAI) - has had on the game. This followed negotiations with FAI's National League Committee and representatives of the clubs. From next season (2023) League of Ireland players over the age of 20 years of age will be entitled to a minimum weekly wage of €430. Players aged 19 years of age will be guaranteed at least €380 per week, with this falling to €330 for 18-year-olds and €280 for any player aged 16 or 17. Players on part-time contracts will be entitled to a minimum of €130 per week. 19, 18 and 17 or 16 year old's are then entitled to at least €120, €105 and €90 per week, respectively. The numbers are interesting for two reasons. Firstly, the minimum wage in Ireland today for all workers aged 20 and over is €10.50 per hour. A standard 40-hour week would result in a gross payment of €420 - almost identical to League of Ireland players. Rates from those aged 16 to 19 vary from €7.35 per hour to €9.45 per hour and result in payments of €294 to €378 - again, almost identical to above. Second, the economic theory is important. The standard price ceiling (left) and industrial union market structure (right) are presented below In order to be effective, the players union can only accept a price floor (minimum wage) that is above the market equilibrium. Clearly, they believe (or know) that the market currently pays players less than €430 per week in the league.
The PFAI has been is able to achieve outcome “R” (on the right diagram) through collective bargaining. It results in higher wages but few players, at least in theory. Whether the players as a group are better off depends on whether the increases in salary outweigh the loss of employment. However, if you are one of the lucky players to play on these new terms of employment you are more likely better off than you were before. By David Butler
Recently, I’ve come across the opinion that elite English players have one eye on the World Cup and are not giving it 100%. It’s an intuitive view of course, but I don’t buy it. Measuring whether players are engaging in some type of moral hazard with Qatar around the corner would be tricky to detect. The table below is a crude attempt to assess this. The table shows current offensive players for England and displays the average fouls they draw from opponents per 90 minutes from the 16/17 season to this season. This might be considered as a measure of how much a player puts themselves in harms way or risk injury for their club side. Not to my surprise, there are no clear patterns. The numbers for Jack Grealish are interesting as he is famous for drawing fouls. His fall coincides with his move to Man City. |
Archives
September 2023
About
This website was founded in July 2013. Categories
All
|