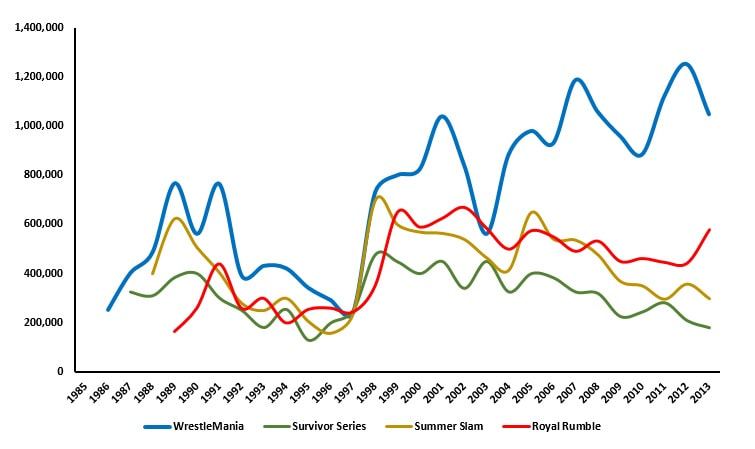
The Economics of Sport
  • Sports Economics
  • About
  • Workshop
  • Selected Publications
  • Book Reviews
  • A Primer on Gaelic Games
  • Upcoming Events
  • Media
  • Education
  • Resources & Links
  • Data

Position & Average Market Value in the Championship

29/4/2019

 
By David Butler

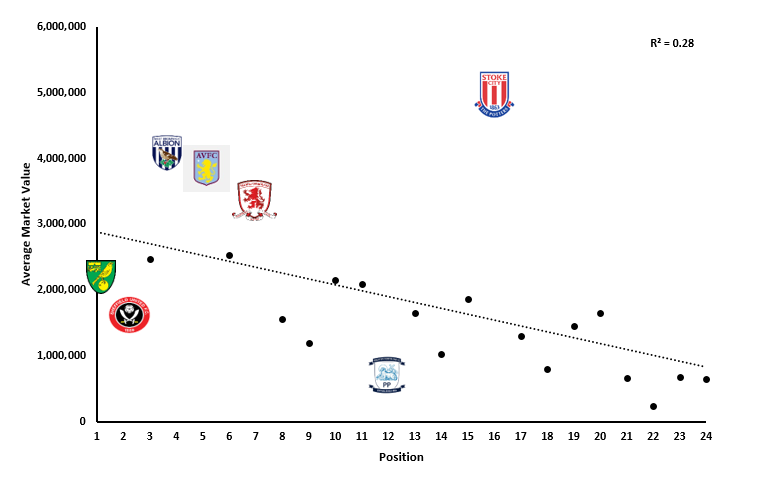
The Championship made many of the headlines over the weekend given that Norwich City and Sheffield United are due to return to the Premier League next season. An emphasis was placed on the models these clubs operate that allowed them to challenge for promotion in a very competitive league. While Norwich have recruited internationally, the Sheffield United squad is drawn solely from the UK and Republic of Ireland talent pool. Their promotion is good news for the Republic as these players may line out in the Premier League next season.

The chart below plots the average market value of each Championship squad according to their current position. These positions might change somewhat over the next few weeks. The issues with Birmingham and Bolton also alter their position. The valuation data is sourced from Transfermarkt.com.

Norwich and Sheffield United have both performed well considering the estimated value of the squad which I’m considering a proxy for expected performance. Reliable salary data is not accessible.  Norwich have an average market value of £2.04m and Sheffield United have an average market value of £1.65m. That’s the same as Reading who are currently 20th.

West Brom, Aston Villa and maybe Middlesbrough will make the playoffs. This is not entirely surprising given the average value of their squad. Stoke are a clear outlier. They are currently 16th with the highest average market value of £5.02m. Another team with a strong Irish influence, Preston North End, are overachievers. They are currently 12th with an average value of only £726k.
Picture

Premier League Totals

25/4/2019

 
By Robbie Butler

Manchester City's win last night means that only Burnley, Leicester and Brighton stand in the way of the Sky Blues defending their Premier League title. City's total of 89 points from 35 games, matches the total number of points they accumulated during the famous 2011-12 season, when they beat neighbours Manchester United on goal difference to the Premier League crown. In fact, 89 points would be enough to win more than half of the Premier League titles since the league started in 1992-93.
Picture
With that in mind, spare a thought for Liverpool. The table to the right lists the total number of points won by each league winner since 1992-93. There were even 42 games during the inaugural season and Manchester United needed just 84 points to win the league.

Liverpool's current total (88 points), and their maximum of 97, are highlighted in red. If Liverpool amass their maximum they may not win the league this season. But that would also have been true in 2017-18 and demonstrates the standard set by City.That said, they would have won 25 of the 27 other titles on offer, all the way from 1992 to 2016.

However, the beauty of a league format is that it is one of the fairest ways to organise competition structure when seeking to find out which team is the 'best'. The well-phrase "the league table never lies" is as true as ever.

Winning the Premier League has similarity to winning the Grand National. Tiger Roll has won the last two Grand Nationals. In 2018 the horse ran the race in a time of 9 minutes and 40 seconds. This year (2019) his time was 9 minutes and 1 second. Had the horse ran the race this year in 9:40 he would have finished well down the field. The time is secondary to winning the race.

The number of points Liverpool accumulate this season will be little consolation if they do not win the League. 

Falling and Pulling Up

23/4/2019

 
By David Butler

​The issue of horse welfare resurfaces at this time of year when the Grand National is taking place at Aintree. It was particularly relevant this year since we saw the first fatality in the Grand National since 2012. Apparently, Up For Review had died before the vet could even reach the scene after being brought down by Vintage Clouds who fell at the first fence. This first fence can be problematic if sometimes horses start too fast.

What should be remembered however is that the race has probably never been as 'safe'. The graph below shows two contrasting trends from 1970 to 2019. The number of fallers is on the decline and the number of horses being pulled up is on the rise. As time has passed jockeys have improved and the fences have definitely been adjusted in height. This year saw the joint highest number of horses pulled up in the race since 2012.

While it’s never nice to see fatalities in horse racing, the risk cannot be completely removed. As times has progressed this risk definitely has been mitigated. Others may disagree but I do not think this has affected the excitement or appeal of the race.

Picture

Premier League Shot Efficiency

21/4/2019

 
By Sean O'Connor

With some recent blog posts examining matters relating to the Premier League, this blog post will continue this theme, focusing on Premier League goal scorers and their efficiency in front goal. Data has the ability to provide illuminating insights into player performance and with that in mind I have collected information on all Premier League goal scorers (as of 19/04/2019). This post examines 202 separate Premier League goal scorers and plots the relationship between goals per game and shots per game.

The scatter plot below examines this relationship. On average these players score 0.15 goals per game (Red line) and have 1.2 shots per game (Green line). Therefore, individuals found to the right of the red line have on average, more goals per game then the average Premier League scorer. While those found above the green line on average have more shots per game then the average Premier League goal scorer.

To further examine shots efficiency we break our scatter plot into four quadrants. To summarise simply:
Top left quadrant as those players who “take more shots but score fewer goals”.
Bottom left quadrant as those players who “take less shots and score fewer goals”.
Top right quadrant as those players who “take more shots and score more goals”.
Bottom right quadrant as those players who “take less shots and score more goals”
Picture
Examining the graph above, much of the findings would not be a surprise to people. The Premier League’s top goalscorers are all found in the top right quadrant (Kane, Salah, Aguero etc.) What I find interesting however, are the players in the top left and bottom right quadrants. We see that Wolves' Ruben Neves, and Chelsea’s Willian take quite a lot of shots per game, but these don’t pay off in terms of goals. In contrast, Loftus-Cheek, James Ward-Prowse are much more efficient in front of goals, a finding that many people may not be aware of.

Moving Stadium - An Early Glance

16/4/2019

 
By Robbie Butler

Previously on this blog, David Butler has considered the impact of club's moving stadium in the long term. I consider it again here, over the (very) short run. 

​Recently, Tottenham Hotspurs moved into their new home and it is fair to say they have settled in quickly. At this stage the club have played just 3 games at the venue, but have a 100% record and are yet to concede a goal. I had a quick look at a random sample of other Premier League clubs that moved stadium in the recent past to see how they fared both in terms of points and goal difference.

The illustration below shows the difference in both, when comparing the final three league games at the old stadium, with the first three games at the new one. Of course, one of the Spurs games was a Champions League tie, but given that Manchester City were the opponents, I thought it fine to include. 
Picture
Spurs are certainly doing better than most. This might be because their new stadium is pretty much on the same site as White Hart Lane. Generally, when a club moves to a new stadium it involves a new location. The literature on home advantage is well-developed and it is surely helpful to players and fans that they have returned to familiar surroundings. 

It will be interesting to see if the North London club can sustain their excellent start as this season draws to a close. 

Demand for WWE PPV's

10/4/2019

 
By David Butler

There was two previous entries on this blog that considered World Wrestling Entertainment. Whether or not this is a sport is open to debate but I thought it may be due some attention in light of WWE’s flagship event 'WrestleMania' taking place last week.

The chart below shows the buy rate data for the four key wrestling pay per views: WrestleMania, Survivor Series, Summer Slam and Royal Rumble from 1985 to 2013. Demand has increased for WrestMania since the late 90’s. Only twice over this time period was WrestleMania outsold by another event -  in 1997 Survivor series had slightly more buys and in 2003 the Royal Rumble had slightly more. Demand for the Royal Rumble grew from the mid to late 90’s and has remained relatively constant. Summer Slam and Survivor Series are however trending downward since the late 90’s.

Demand  for these WWE PPV events has increased significantly since the late 1990’s - this could relate to WWE’s acquisition of competitors WCW and ECW
Picture

VAR In Action

10/4/2019

 
By Robbie Butler,

One year ago next week I wrote this. The piece tries to explain where the Video Assistant Referee (VAR) can be usefully deployed in football, and where it cannot.

It's fair to say, the response to VAR has been mixed. It is very much debatable where the benefits of the system outweigh the (often) unintended consequences of using the technology. My original piece explains that in certain instances in football, video technology can help referees make better decisions. However, in some cases it is unhelpful. The crux of the issue is whether the rule of law is being interpreted objectively or subjectively.

Tottenham vs Manchester City last night provides two perfect examples.

VAR 1: Danny Rose's "handball".
IFAB Laws of the Game state that handling the ball involves "a deliberate act of a player making contact with the ball with the hand or arm. The following must be considered: • the movement of the hand towards the ball (not the ball towards the hand) • the distance between the opponent and the ball (unexpected ball) • the position of the hand does not necessarily mean that there is an offence." Deciding whether or not Danny Rose's action last night was deliberate is purely subjective. Some may argue he made himself bigger. Others may suggest his hands were in a natural position for a defender making a last ditch tackle and that there was a short distance between Rose and Sterling. I don't believe it was a penalty, and more tellingly neither did the Man City players or staff. Not one opponent looked for a penalty.

VAR 2: Heung Son-Min keeps the ball in play.
The question put to the referee is simply did all of the ball cross all of the end-line. This is not subjective. The ball either did or didn't. Here VAR worked perfectly, just like it does in tennis and rugby.

VAR is supposed to eliminate controversy, not cause it. It needs to be dropped in the case of VAR 1 and kept in the case of VAR 2.

​Referee's should decide if the ball was deliberately handled. That's what they are there for after all!

The Non-Art of Hurley Making

8/4/2019

 
By John Considine
Picture
There is little art to making a hurley.  That is the view of the Minister for Finance.  He stated as much in a recent written reply to a Parliamentary Question.  The question was posed by Deputy Kevin O'Keeffe.  He asked the Minister if he would consider extending the artists' income tax exemption to the making of hurleys.  The Minister for Finance was not for turning as his reply makes clear (here).

The exemption applies to sculpture.  Is this not what a hurley maker does when they fashion the sporting stick from a piece of wood?

Books, including sports books, can qualify under the income tax exemption (as I wrote about here).    As I scrolled down the latest list posted to the website of the Revenue Commissioners, I found a few hurling (auto)biographies, e.g. At All Costs: Davy Fitzgerald, Ken McGrath: Hand on Heart, and The Warrior Code.  The subjects of these books performed their art using the instruments fashioned by their favourite hurley maker.

This raises questions about how we define art.  Should all books qualify for the exemption?  Some of the books on the list seem out of place.  For example, The Wisdom of Whores by Elizabeth Pisani is a wonderful non-fictional account of "bureaucrats, brothels, and the business of AIDS".  Chapter 8 is titled "Ants in the Sugar-Bowl".  Pisani explains how the Washington beltway bandits survive by devouring a large slice of the government money destined for tackling AIDS.  Is there some irony here?  Is the book any more of an artistic work than a well crafted hurley?

This is the latest instalment in a series of efforts to get hurling, and its associated activities, to get favourable treatment by the authorities.  Previously, an Irish Member of the European Parliament sought something similar (see previous post).  An notable success was achieved last November when hurling was added to UNESCO's Representative List of the Intangible Cultural Heritage of Humanity.  This may have raised the hopes of hurley makers that they might get a sympathetic hearing from the Minister of Finance.  Those hopes have been dashed.

5th Annual Workshop - Full Programme

5/4/2019

 
By Robbie Butler

Our 5th Annual Sports Economics Workshop will take place on Friday 24th of May 2019 in the Creative Zone of the Boole Library, University College Cork. The full programme is below. 

This event is free to attend but registration is required (see here). 
Picture
Picture

Tottenham & A Culture of Collapse - Fact or Fiction?

3/4/2019

 
By David Butler

Last weekend Tottenham gifted Liverpool a late own goal maintaining the momentum for the Premier League title race. As usual when these last gasp incidents happen the world of social media goes into overdrive. One of the more popular claims, that constantly reasserts itself, is that Tottenham have a proclivity to collapse and concede late goals. This view has crept into public perception – it is woven into Tottenham’s DNA to ‘bottle it’ and that this is a ‘cultural’ facet of the club. Mental strengths and resilience are often called into question.

Let’s consider the evidence on late goals for and against Tottenham when the margins are tight, meaning that they shape the result.  These are the late goals that matter as they swing the result when only a one goal margin between the teams exists. I define late goals as those from the 85th minute to the final whistle.

Since the Premier League began Tottenham have been involved in 133 of these encounters where late goals changed the outcome. The facts are that 56 late incidents have gone against Tottenham (where they conceded) but 77 have gone in their favour (where they scored).

The first table shows the breakdown of the 56 times Spurs went from winning to drawing (2 points dropped), drawing to losing (1 pointed dropped) and winning to losing (3 points dropped). Since 1992 Tottenham have dropped 78 points late on – the one total turnaround was against Everton in 2012 when Steven Pienaar (90), and Nikica Jelavic (90+2) scored in the dying stages.
Picture
The second table shows the 77 times Spurs went from drawing to winning (2 points gained), losing to drawing (1 pointed gained) and losing to winning (3 points gained). Since 1992 Tottenham have gained 130 points late on. Many of these have been against traditionally big clubs – twice in recent times they have trumped Liverpool at the death (Roman Pavlyuchenko and Aaron Lennon scored very late goals in 2008 and 2010 respectively). Spurs have also completely turned it around in the dying minutes four times in the Premier League. In 1993 Darren Anderton (88) and Darren Caskey (90) flipped an incoming loss to Everton on its head. More recently, Spurs have twice grasped a win from the jaws of defeat against West Ham courtesy of Dimitar Berbatov- Paul Stalteri (06/07) and two Harry Kane goals (16/17). They also turned around a losing position late on against Swansea in 2017
Picture
Tottenham have a net gain of 52 late points over the history of the Premier League – perhaps the perennial bottlers tag is misplaced. Easy to recall incidents, like last weekend, will likely skew judgements and detract from the evidence that paints a bigger picture. It will be interesting to compare this to the other five clubs that have always participated in the competition.
<<Previous

    Archives

    February 2023
    January 2023
    December 2022
    November 2022
    October 2022
    September 2022
    August 2022
    July 2022
    June 2022
    May 2022
    April 2022
    March 2022
    February 2022
    January 2022
    December 2021
    November 2021
    October 2021
    September 2021
    August 2021
    July 2021
    June 2021
    May 2021
    April 2021
    March 2021
    February 2021
    January 2021
    December 2020
    November 2020
    October 2020
    September 2020
    August 2020
    July 2020
    June 2020
    May 2020
    April 2020
    March 2020
    February 2020
    January 2020
    December 2019
    November 2019
    October 2019
    September 2019
    August 2019
    June 2019
    May 2019
    April 2019
    March 2019
    February 2019
    January 2019
    December 2018
    November 2018
    October 2018
    September 2018
    August 2018
    July 2018
    June 2018
    May 2018
    April 2018
    March 2018
    February 2018
    January 2018
    December 2017
    November 2017
    October 2017
    September 2017
    August 2017
    July 2017
    June 2017
    May 2017
    April 2017
    March 2017
    February 2017
    January 2017
    December 2016
    November 2016
    October 2016
    September 2016
    August 2016
    July 2016
    June 2016
    May 2016
    April 2016
    March 2016
    February 2016
    January 2016
    December 2015
    November 2015
    October 2015
    September 2015
    August 2015
    July 2015
    June 2015
    May 2015
    April 2015
    March 2015
    February 2015
    January 2015
    December 2014
    November 2014
    October 2014
    September 2014
    August 2014
    July 2014
    June 2014
    May 2014
    April 2014
    March 2014
    February 2014
    January 2014
    December 2013
    November 2013
    October 2013
    September 2013
    August 2013
    July 2013

    About

    This website was founded in July 2013.

    RSS Feed

    Categories

    All
    American Football
    Athletics
    Baseball
    Basketball
    Behavioural Economics
    Boxing
    Broadcasting
    Competitive Balance
    Cricket
    Cycling
    Darts
    David Butler
    Declan Jordan
    Drugs
    Ed Valentine
    Epl
    Esports
    Expenditure
    F1
    Fifa World Cup
    Finances
    Funding
    Gaa
    Gaelic Games
    Gambling
    Game Theory
    Gary Burns
    Geography
    Golf
    Greyhound Racing
    Guest Posts
    Horse Racing
    Impact Studies
    John Considine
    John Eakins
    League Of Ireland
    Location
    Media
    Mls
    Mma
    Olympics
    Participation
    Paul O'Sullivan
    Premier League
    Regulation
    Research
    Robbie Butler
    Rugby
    Simpsonomics
    Snooker
    Soccer
    Spatial Analysis
    Sporting Bodies
    Stephen Brosnan
    Swimming
    Taxation
    Teaching
    Technology
    Tennis
    Transfers
    Uefa
    Ufc
    World Cup
    Wwe

Related

The website is not formally affiliated to any institution and all of the entries represent the personal views and opinions of an individual contributor. The website operates on a not-for-profit basis. For this reason we decline all advertisement opportunities. 

Contact

To contact us email sportseconomics2013@gmail.com or find us on Twitter @SportEcon.