The Economics of Sport
  • Sports Economics
  • About
  • Workshop
  • Selected Publications
  • Book Reviews
  • A Primer on Gaelic Games
  • Upcoming Events
  • Media
  • Education
  • Resources & Links
  • Data

Purchasing power of record transfer fees (or Di Maria is literally worth more bread than Bob Latchford)

30/8/2014

0 Comments

 
by Declan Jordan
Of course the new English football transfer record set by Manchester United this week in signing Angel Di Maria from Real Madrid is generating a lot of column inches. In coming days we can expect to see some questioning the amount of money being spent on a footballer and whether this is moral. We saw similar pieces after the previous record signing of Fernando Torres by Chelsea from Liverpool in 2012. 

Robbie Butler posted on this blog a couple of times about the importance of adjusting for inflation when comparing transfer fees in deciding which are the largest transfers. Equally it's important to have a mechanism for comparing transfer fees across time. For example, how do we compare the transfer of Di Maria in 2014 to, for example, the then record transfer of another Manchester United Number 7, Bryan Robson from West Bromwich Albion in 1981 for £1.5m?

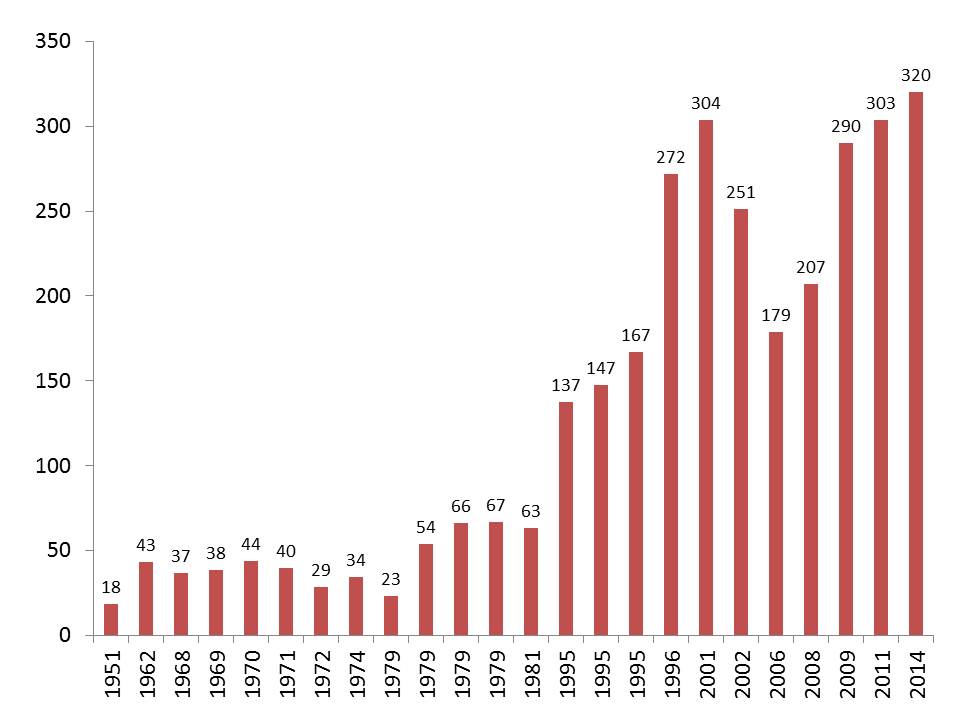
One approach would be to compare the purchasing power of the transfer fees in terms of another product. The graph below shows the number of average price houses that could be purchased with each record transfer fee paid by an English club. The data on transfer fees is sourced from Wikipedia (health warning attached) and the data on house prices is sourced from the Nationwide House Price Index (a little less of a health warning). The house price is the mean price for all housing units taken for the last quarter of the relevant year. This may be an appropriate benchmark as both are capital rather than current expenditure. Of course, housing will be a longer term investment than a striker.

So, in 1951, Jackie Sewell went from Notts County to Sheffield Wednesday for £34,500. That was the equivalent of 18 average priced houses. Angel Di Maria's fee is the equivalent of 320 houses. It's clear that football transfer fees have risen significantly in a relative context over the last 60 years. What is interesting, I think, from the graph is the decline in relative transfers fees through the 2000s - since these are all record transfers it must be driven by a booking UK property market. The Di Maria transfer is not significantly higher in relative terms than the transfer of Sebastian Veron from Laxio to Manchester United in 2001 for £28.1m. I really hope this latest transfer of an Argentinian to United works out a lot better than the last one.

Picture
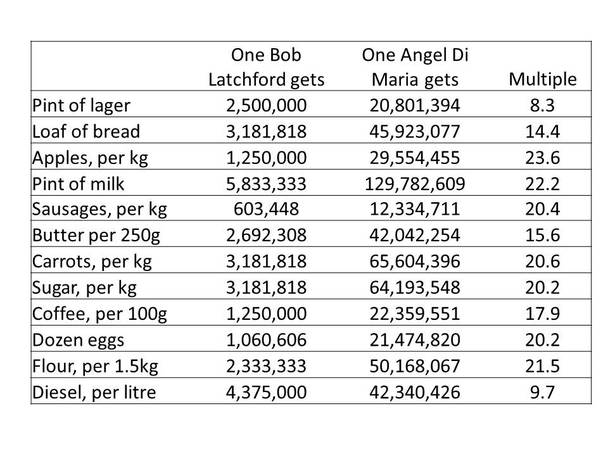
While gathering the data I also came across an article with the cost of everyday consumer items in 1973 and 2013. It may also be useful to see how many of these products could be purchased with the record transfer fees at those times. Using the prices from 1973 and the nearest record transfer to that time (Bob Latchford from Birmingham to Everton for £350,000 in 1974) it's possible to compare the Di Maria transfer in terms of purchasing power. The table below shows how many of the products could be purchased with the transfer fees and the multiple increase. So one Bob Latchford would have bought 5.8 million pints of milk in 1973 and one Angel Di Maria would get you just under 130 million pints now. That's a 22 fold increase.

What's noticeable in the table is the differences in the rate of increase for some products. While Di Maria is equivalent to 22 times more milk than Latchford, he would 'only' but 8.3 times more lager and 9.7 times more diesel. This indicates the choice of reference point can provide somewhat different stories.
Picture
0 Comments

Concentration In The Football Video Game Market

29/8/2014

 
By Robbie Butler

Something lighthearted for today. 

A number of weeks ago David Butler posted a very interesting piece on the football video game market for those interested in the ongoing battle among the main game producers. Here's another trip down memory lane, as we consider market concentration in the same market since 1994.

For those familiar with football video games, the market today is dominated by two game producers; EA Sports' FIFA and Konami's Pro Evolution Soccer. This was not always the case. The graphs below presents data from Sony's PlayStation 1 (PS1), PlayStation 2 (PS2) and PlayStation 3 (PS3) on the number of football video game titles during the lifespan of each console. 

Back in the days of the PS1 one could choose from a plethora of football games. Sixty-four different titles and title updates were available for sale in Europe during the days of the PS1. Once-off titles made up almost a quarter of all games released, with EA's FIFA the single biggest game in terms of the number of titles released (see below). Games such as Actua Soccer (4 titles), Addias Power Soccer (4 titles) and This Is Football (2 titles) were commonplace.   

Picture
Picture
Actua Soccer (1995)
Picture
Adidas Power Soccer (1997)
Picture
This Is Football (1999)
In 2000 the PS2 was launched and went on to become the best-selling video game console in history, selling over 155 million units. During it's lifetime there was a drop in the number of football video game titles available for sale. In total 48 football games have been released since March 2000. It was during the reign of this console that FIFA and Pro Evolution Soccer took control of the market. To date EA Sports have released 17 versions of FiFA while Konami have launched 11 variants of of Pro Evolution Soccer. This constitutes nearly 60% of all football games released during the lifetime of the PS2. LMA Manager (6 titles) and This is Football (5 titles) are the next most popular. The PS2 also saw a number of once-off football releases such as David Beckham Soccer (2002), Sega Soccer Slam (2002) and old favourite Sensible Soccer 2006. 


Picture
Picture
Picture
Picture
In November 2006 Sony launched the PS3. Since then two games have dominated the football market (see graph below). Titles outside of the FIFA and Pro Evolution 'duopoly'  make up just 6% of football games released on the console. David Butler examined the FIFA/Pro Evolution battle more closely and reports that FIFA is winning the battle, with EA's sales of their football title considerably greater than Konami since 2007.
Picture
The Playstation 4, launched in November 2013, currently boasted just one football title, FIFA 14. EA Sports are set to release FIFA 15 next month, with Konami launching Pro Evolution Soccer 2015 in November. It's likely that a pie chart for the PS4 (done years into the future) will have just two segments. The dominance of both EA and Konami has forced others out of the market. Others are now so far behind in terms of game development that the football video game market is a 'no-go area' for other developers. A far cry from when I was buying football video games... 

Paul Merson & Predictions

28/8/2014

 
By David Butler

[The final entry on this post can be accessed here]

I think most enjoy a casual prediction about the outcome of a match. Some braver individuals even stake their earnings on an opinion. Rarer still some individuals in the sports industry are paid to make predictions and preach about our sports. But how good are the professionals in predicting the outcome of a match?

One pundit who makes precise and weekly predictions about the Premier League's upcoming fixtures is Paul Merson of Sky Sports.  Every Thursday or Friday he gives his verdict on what the results and score line will be for the weekend matches. Last season BBC's Mark Lawrenson's made 380 estimates, getting the score line right for 11% (approx. 42 matches), the result right for 43% (approx. 163 matches) and being wrong 46% of the time (approx. 175 matches).

I intend to follow Paul’s prediction this year and use his estimates to test how good the experts are at predicting the
outcome of football matches.  Given that Paul will make 380 predictions over the course of the Premier League season (20/380 to date), we will have a rare opportunity to analyse the accuracy of a football pundit that systematically predicts.

'Paul’s Pie Chart' is below. After gameweek two and 20 matches he has predicted the correct results and score 16% of the time, the correct result (wrong score) 42% of the time and the wrong result 42% of the time.

I’ll update  'The Paul Pie Chart’ as the season progresses. After the first two weeks he has got over half of the results right, so not a bad start. Good Luck Merse!
Picture

Historical Transfer Fees

26/8/2014

0 Comments

 
By Robbie Butler 

This week Sky Sports reported that more than £660,000,000 had been spent on transfers during the 2014 Summer Transfer Window. This figure will break through the £700 million figure once Angel di Maria signs for Manchester United, and with the window not closing until Monday night, will no doubt rise further. The table below lists the sixteen most expensive transfers during the current window (including di Maria), each of which broke through the £20 million barrier.
Picture
It may seem crazy but £20 million is no longer an absurd amount of money to spend on a player. In fact, bids of this size raise few eyebrows in the world of football. While it’s obvious to see that transfer fees have increased in size over the years it’s more interesting to consider the ‘real’ value of a transfer through time. I previously investigated this with Cristiano Ronalado and Gareth Bale and showed that despite the fact Bale was bought for £85.3 million in 2013, Ronaldo was actually more expensive. The £80 million spent on the Portuguese star in 2009 was the equivalent of more than £90 million in 2013, when taking inflation into account.

But what about historical transfer fees? Where would these stand if one were to consider the impact of inflation over the years?

Given my age, I’m a little biased when it comes to where to start. For me Diego Maradona is the greatest player that’s ever played the game. The Argentinian was the most expensive player in the world twice, the second of which was his £5 million move from Barcelona to Napoli in 1984. It’s this point from where we start. The table below lists every transfer that broke the record transfer fee since 1984. Sixteen transfers are reported with the nominal fee (what was paid) listed next to the real fee (cost in today's money). 
Picture
It's clear to see that not only have nominal transfer fees soared but so too have real fees. Diego Maradona cost Naopli a mere £11.9 million in real terms today. Roberto Baggio cost less than £15 millions in real terms. The pending transfer of Angel di Maria to Manchester United is just less than the money paid by Real Madrid to Juventus for Zinedine Zidane. Di Maria is an excellent footballer but I'm not so sure he's a 'Zidane'.  

There are various reasons for the huge surge in the real cost of transfers over the past thirty years. TV broadcasting revenue have risen exponentially over the course of the past two decades. Merchandising is at saturation point and is now truly a global thing for the world's top clubs. Ticket prices have also soared. Attending football matches, historically a past-time of the working class, is now a pursuit for those with money. All of this means that transfers and by extension wages have rocketed since the early 1980s. If Maradona were playing today he likely to be sold for closer to £119 million rather than £11.9 million. What a bargain he was. 
0 Comments

2014/2015 Season Ticket Prices

25/8/2014

 
By David Butler

At a recent forum I attended on technology and football a point was raised that the League of Ireland (LOI) should not try to compete with the English Premier League (EPL) and that our domestic football model should be inspired by ones adopted in Scandanavian countries. This argument was made in the context of a discussion concerning LOI attendances.

Below is a price comparison of LOI season tickets prices to the Premier League and The Danish Superliga* for 2014/15. This may give us some insight to how similar the LOI model is to the Danish Superliga.

The average price for the Premier League season ticket is €657 while its €174 for the LOI and €171 for the Danish Superliga.

It should be noted that the Premier League season tickets are the cheapest that are available and that the data for the LOI is for standard unreserved season tickets. The Danish Superliga price discriminate in a similar fashion to EPL clubs so standard (non-premium) tickets were chosen. All season tickets are for adults.

Given the variation in the EPL prices, the comparison could be interpreted in many ways and really depends on ones outlook toward the LOI. It could be argued that adding €200 to the average LOI season ticket would gain you access to Premier League champions Manchester City (the cheapest) for a season. City would also play 3-4 more home games than the Airtricity or Superliga teams depending on the fixture allocation (as both Irish and Danish teams play 3 times). 

On the other hand, buying one season ticket for Arsenal would equate to buying 6 season tickets for Cork City and double that for Bray Wanderers! Sounds reasonable. The most common LOI price is €200. At the Premier League prices this would equate to purchasing  6 LOI season tickets for an Arsenal one, 5 for a Tottenham, 4 for a Liverpool and 3 for a Chelsea or Manchester United. Readers can do the math for their own clubs below.

Of course, this is a crude analysis as I don't take into account the obvious demand side costs of substituting LOI consumption for EPL (e.g travel costs associated with attending Premier League games for Irish fans). Nor am I appreciating the supply side costs of hosting matches for clubs of different sizes and the capacity constraints that they face. Alledgedly Tottenham have over 15,000 fans on a waiting list for season tickets, one would expect this supply constraint to exert upward pressure on price.

One insight we do gain however is that given the twelve team league in Denmark, the comparable fixture structure and their season ticket pricing system, the Danish and LOI are already quite similar.

*Many thanks to SarahThatt-Foley for providing the Danish price data.

Picture

So why did Cork perform so badly in last weekend's Hurling semi-final?

23/8/2014

0 Comments

 
By John Eakins
There has much been much discussion as to the reasons why Cork performed so poorly against Tipperary last weekend. One factor frequently mentioned is the long lay-off that Cork had between the Munster Final and the Semi-Final (5 weeks). From what I have heard the debate seems to be split 50/50 with some saying that it’s too long a period to keep players’ minds focussed while others citing the fact that Kilkenny haven’t been affected to the same degree in previous seasons. The table below might perhaps give some further insight. It details the provincial winners in Munster and Leinster since the introduction of the‘back-door’ in 1997 and the number of weeks between playing the provincial final and the subsequent semi-final or quarter final (quarter finals were introduced in 2005 and lasted for 3 seasons). Those teams highlighted in red are ones who lost their subsequent semi-final or quarter final after playing a provincial final.

Picture
In the majority of cases, one of the provincial winners loses their next match (this happened 9 out of the 18 seasons). In 7 out of the 18 seasons, both provincial winners won their next match (although as explained in the footnote to the table, Kilkenny and Waterford lost semi-finals in two of these cases). In 2 out of the 18 seasons, both provincial winners lost their next match (2004 and 2013). So instances where provincial winners lose their next match occur more often than they don’t. There doesn’t appear to be any clear relationship between these figures and the number of week’s lay-off however. Even in 2010, Waterford had a shorter number of weeks compared to Kilkenny (due to a replay against Cork in the Munster final) and still lost their semi-final (to Tipperary). 

One interesting statistic from the table which could lead to a working hypothesis is the fact that 5 out of the last 7 Munster hurling winners have lost their subsequent semi-finals. In almost all of these cases, the Munster win was from a team who hadn’t won Munster in a number of years. For example, the 2008 Munster winners, Tipperary won their previous Munster title in 2001. There was a gap of 3 years between Waterford’s win in 2010 and their previous win. When Limerick won in 2013 it was their first Munster win in over 17 years while Cork’s win this year was their first in 8 years. In contrast, in Leinster, Kilkenny won 7 in a row between 2005 and 2011 and never lost their subsequent match that followed. When Dublin won the Leinster title in 2013 for the first time in 52 years they also lost their next match in the semi-final with Cork.

It’s only a hypothesis and there are a number of examples which run counter to it (Cork in 2000, Galway in 2012, Tipperary in 2012) but perhaps the effort that is put in and elation in winning a provincial title (particularly in the ultra-competitive Munster championship) for the first time in a number of years leave teams flat for the next match. This may be exacerbated by the long wait for that match. So perhaps a shorter time period between matches may work but only in tempering the joy of a provincial title and focusing minds on the next task quicker.
0 Comments

Fraser Forster: 0 Minutes 1 Record

22/8/2014

 
By David Butler

Earlier in the month I presented data which indicated that World Cup squads for six European countries are getting taller on average. Previously, I have considered the height of central defenders in this year’s World Cup.

Below is the data for the average height of goalkeepers in World Cup squads for six countries from 1978 to 2014. As is the case with all World Cup footballers in general, the goalkeepers selected for qualifying squads are getting taller on average.

Each country took 3 goalkeepers to every World Cup since 1978 (with the exception of one Italian squad that only took 2). Interestingly, England has selected progressively taller goalkeepers from 1978 onwards. 

The first squad to break 190cm barrier for average goalkeeper height at a World Cup was the Netherlands in U.S.A 94’ when the cohort of Ed de Goeij (198cm), Edwin van der Sar (197cm) and Theo Snelders (193cm) travelled to America. The Italians later broke the 190cm barrier in France 98’ selecting Francesco Toldo (196cm), GianlucaPagliuca (190cm) and Gianluigi Buffon (191cm).

The Netherlands 1998 squad had the highest on average goalkeeper height and share the top spot with England’s current crop of Joe Hart (196cm), Ben Foster (193cm) and Fraser Forster (201cm). 

Fraser Forster (201cm) is the only goalkeeper in the sample to break the 200cm bound (despite the fact that he never recordered a minute on the field in Brazil) and was the tallest player at Brazil 2014.The second tallest goalkeeper over the years under analysis here was Ed de Goeij (198cm).

To my knowledge Forster was the joint second tallest player to ever travel to a World Cup, alongside his compatriot Peter Crouch (201cm). To my knowledge the tallest players ever to travel were both 202cm; Nikola Žigić for Serbia and Jan Koller for Czech Republic.

Goalkeepers have always needed to be tall but it appears to make it to an elite international level touching off 6 foot may not be good enough anymore, with the average height of elite international's advancing toward 6’3.

Picture

Where in the World?

22/8/2014

 
By John Considine
Below is the Google Analytics on the geographical location of the visitors to sportseconomics.org website.  Not surprisingly, Ireland tops the list with 51% of the visitors.  The site attracts 17.0% of its visitors from the UK and a further 11.3% from the US.  Dublin is the city location with the highest number of visitors.  This is followed by Cork and London.  The top non-Irish cities are London, Leeds, Aberdeen, New York, Melbourne, Sydney, Coventry, Oxford, Manchester, Toronto and Bangalore.
Picture

The Claiming Race

21/8/2014

 
By Robbie Butler

The Tramore Festival began last Thursday and as usual lived up to its billing. Large crowds attended the County Waterford track as both flat and national hunt events took place. One of the more interesting races of the four day event was Thursday’s Bet Online At thetote.com Claiming Race. 

A claiming race is quite different to other horse races. Owners are asked to put a value on their horse in the days prior to the race, a price at which they must sell to any prospective buyer following the race. Interestingly, the race handicap (the weight each horse must carry) is determined by the value placed on each horse by its owner. The highest valued horse carries the most weight (horse No. 1) with subsequent weights based on the difference in value between horse No. 1 and every other horse in the race.

This scenario is very interesting for economists to consider as it allows us to explore concepts such as the role of incentives and strategic behaviour. Owners may be stuck in a dilemma where they want to win the race but are not necessarily that interested in selling their horse. A higher value on the horse will potentially scare away would-be buyers but also diminishes the chances of success. On the flip side, a lower value will allow the horse to be handicapped more favourably, which could result in winning the race, but makes them more attractive to potential buyers.
Picture
On Thursday evening nine horses went to post for the Bet Online At thetote.com Claiming Race at 5.30pm. Horse No. 1 Coolfighter was valued at €10,000 by owners CLF Partnership and carried 140lbs. The lowest valued horse, No.9 Paple Blessing, was valued at €3,400 by owner Leo McCabe and carried 129lbs. Interestingly, Coolfighter won the race, pocketing connections just over €5,000, while Paple Blessing finished second winning just over €1,200. Both horses were subsequently purchased after the race for €10,000 and €3,400 respectively. 

Coolfighter’s new owner, Robert Dooley, wasted little time in seeking a return on his investment, with the horse entered again at Tramore on Saturday evening in the 6.25pm race. The horse duly won the race with the new connections collecting nearly €7,000 in the process. Not a bad return on their two day old investment.

And what about this for a first? Surely Coolfighter is the first horse to run at the same festival and win twice with a different owner, trainer and jockey. Thursday evening the horse was ridden by Danny Mullins, trained by Tony Mullins and owned by the CLF Partnership. On Saturday night the winner’s enclosure saw the horse surrounded by jockey Seamie Heffernan, trainer Noel Dooley and new owner Robert Dooley. Two days is a long time in horse racing.

French Top 14 rugby and Losing Bonus Points

20/8/2014

 
Picture
By John Eakins

The French Top 14 rugby season kicked off over the weekend with Jonny Sexton guiding Racing Metro to victory over Montpellier in one of the first games. This season should be interesting from a number of perspectives, besides the involvement of Sexton. In April, the governing body of French club rugby, the LNR (Ligue Nationale de Rugby), announced new plans (titled the ‘New Deal’) to improve the competition. One of the lesser publicised changes is to the losing bonus point system. From this season, losing teams will have to be within 5 points rather than 7 in order to get a losing bonus point. The suggestion is that teams are not attacking enough in the closing stages of games and are predominantly looking for a drop goal or trying to earn a penalty rather than looking for a try. Whether this will make any significant difference is debatable. If fact, you could argue that its simply shifting the goal posts (sorry - couldn't resist!). 
 
So before the rule change teams that are losing by 8-10 points had the incentive to kick for a 3-pointer. If you are losing by 11-12 points (or more) you had to go for a try. Now teams that are losing by 6-8 points have the incentive to kick for a 3-pointer and teams losing by 9-10 points must go for a try. The point being is that the incentive to kick for a 3-pointer to earn a losing bonus point is still there and instances will still occur. The other problem with the new rule change is that it only has an impact in the last 10 minutes or so of a game (to be fair this is a problem with the losing bonus point system in general). A clearer incentive to promote attacking play throughout the whole game would be to amend the try bonus points system, perhaps on a sliding scale, for example, 1 point for 3 tries scored, 2 points for 4-6 tries scored, 3 points for 7 or more tries scored.
 
Another interesting perspective is how the trend in losing bonus points in the Top 14 league compares with the Pro 12 (Celtic League) and the English Premiership. The figure below plots the average losing bonus points per team in each of the three leagues across the last 10 seasons. The French Top 14 and English Premiership both have similar levels of losing bonus points per team with the Pro 12 generally lying below these two competitions. This could be because both the Top 14 and English Premiership are national competitions and involve a greater degree of rivalry resulting in closer matches between teams. The Pro 12 on the other hand involves teams from a number of different countries with less traditional rivalry. It’ll be interesting to see how it all unfolds this season however given the difference that now exists in the losing bonus point system across the three competitions.

Picture
<<Previous

    Archives

    March 2023
    February 2023
    January 2023
    December 2022
    November 2022
    October 2022
    September 2022
    August 2022
    July 2022
    June 2022
    May 2022
    April 2022
    March 2022
    February 2022
    January 2022
    December 2021
    November 2021
    October 2021
    September 2021
    August 2021
    July 2021
    June 2021
    May 2021
    April 2021
    March 2021
    February 2021
    January 2021
    December 2020
    November 2020
    October 2020
    September 2020
    August 2020
    July 2020
    June 2020
    May 2020
    April 2020
    March 2020
    February 2020
    January 2020
    December 2019
    November 2019
    October 2019
    September 2019
    August 2019
    June 2019
    May 2019
    April 2019
    March 2019
    February 2019
    January 2019
    December 2018
    November 2018
    October 2018
    September 2018
    August 2018
    July 2018
    June 2018
    May 2018
    April 2018
    March 2018
    February 2018
    January 2018
    December 2017
    November 2017
    October 2017
    September 2017
    August 2017
    July 2017
    June 2017
    May 2017
    April 2017
    March 2017
    February 2017
    January 2017
    December 2016
    November 2016
    October 2016
    September 2016
    August 2016
    July 2016
    June 2016
    May 2016
    April 2016
    March 2016
    February 2016
    January 2016
    December 2015
    November 2015
    October 2015
    September 2015
    August 2015
    July 2015
    June 2015
    May 2015
    April 2015
    March 2015
    February 2015
    January 2015
    December 2014
    November 2014
    October 2014
    September 2014
    August 2014
    July 2014
    June 2014
    May 2014
    April 2014
    March 2014
    February 2014
    January 2014
    December 2013
    November 2013
    October 2013
    September 2013
    August 2013
    July 2013

    About

    This website was founded in July 2013.

    RSS Feed

    Categories

    All
    American Football
    Athletics
    Baseball
    Basketball
    Behavioural Economics
    Boxing
    Broadcasting
    Competitive Balance
    Cricket
    Cycling
    Darts
    David Butler
    Declan Jordan
    Drugs
    Ed Valentine
    Epl
    Esports
    Expenditure
    F1
    Fifa World Cup
    Finances
    Funding
    Gaa
    Gaelic Games
    Gambling
    Game Theory
    Gary Burns
    Geography
    Golf
    Greyhound Racing
    Guest Posts
    Horse Racing
    Impact Studies
    John Considine
    John Eakins
    League Of Ireland
    Location
    Media
    Mls
    Mma
    Olympics
    Participation
    Paul O'Sullivan
    Premier League
    Regulation
    Research
    Robbie Butler
    Rugby
    Simpsonomics
    Snooker
    Soccer
    Spatial Analysis
    Sporting Bodies
    Stephen Brosnan
    Swimming
    Taxation
    Teaching
    Technology
    Tennis
    Transfers
    Uefa
    Ufc
    World Cup
    Wwe

Related

The website is not formally affiliated to any institution and all of the entries represent the personal views and opinions of an individual contributor. The website operates on a not-for-profit basis. For this reason we decline all advertisement opportunities. 

Contact

To contact us email sportseconomics2013@gmail.com or find us on Twitter @SportEcon.