The Economics of Sport
  • Sports Economics
  • About
  • Workshop
  • Selected Publications
  • Book Reviews
  • A Primer on Gaelic Games
  • Upcoming Events
  • Media
  • Education
  • Resources & Links
  • Data

Despite a record win by the USA, goals are harder to get at the Women's World Cup

10/6/2019

0 Comments

 
by Declan Jordan
Picture
The FIFA Women's World Cup in France continues to throw up great games and surprises. The women's game is in the spotlight and, while the football has been great, there are frustrations at FIFA's organisation and commitment to the game, pay inequality, and sexism.

It is perhaps unavoidable that the competition and women's football generally is compared to the men's equivalent. It is not difficult to find patronising commentary on television and in print media whenever women's football is covered. There is almost surprise, particularly in the Irish and UK coverage with which I am most familiar, that professional athletes are technically skillful, competitive, and committed. (There are similarities in the treatment of female football analysts, referred to by Alex Scott here. That it is surprising that someone who has played 140 times for her country should be insightful about the game says a lot about our attitudes to women in football).

Perhaps these attitudes are based on an outdated notion of the women's game, though there are certainly socialised stereotypes at play as well. In a recent article in the Irish Examiner, Larry Ryan referred to a comment by England striker Toni Duggan that she was somewhat heartened to see the anger from opposition fans when she celebrated a goal she scored for Barcelona. For her it showed that the game mattered and the players were being taken seriously. The article though warns that the women's game should try to avoid going down the road of the men's game and should instead try to hold on to the values of inclusion, loyalty, and community.

This doesn't mean of course that the women's game will not get more competitive, skillful, and demanding.

The negative stereotypes will take time to break down of course, but it is interesting to review the data on previous World Cup Finals, both women's and men's, to shed some light on the game's development.The USA's 13-0 demolition of Thailand has led to some suggestions that the World Cup is losing credibility and the increase in teams from 16 to 24 will damage the tournament with more one-sided games.

The data doesn't back this up however.

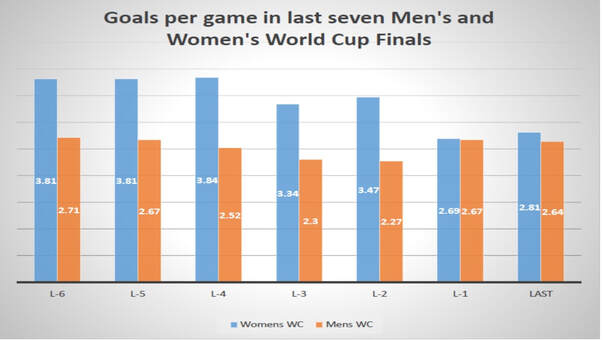
The graph below shows the goals per game at each of the last seven World Cup Finals tournaments (the last men's tournament was 2018 in Russia and the last Women's tournament was in 2015 in Canada). For information, in the first round of group matches in the current tournament (12 in all) to Tuesday June 11, there have been 3.17 goals per game. Excluding the USA-Thailand game the ratio is 2.27 goals per game).

It is striking how the ratio of goals per game has declined over the seven tournaments. From having just over a goal more per game, the women's tournament has now reached a comparable level with the men's. Whether this is a positive or negative development is unclear, though even as the number of countries in the finals of the Women's World Cup has increased goals have become more difficult to come by.


Picture


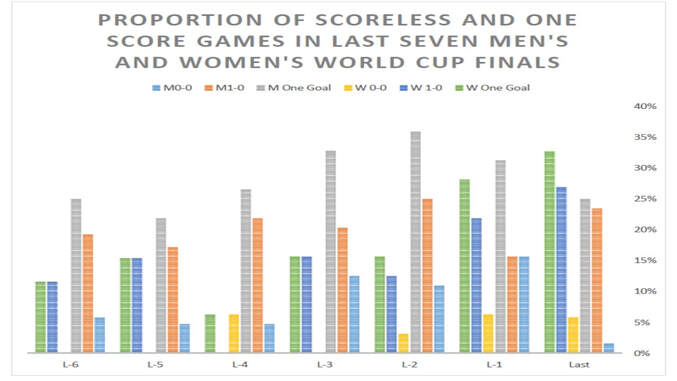
Similarly with the number of low-scoring games, there has been a narrowing in the differences between the tournaments over time. The Women's World Cup Finals did not see a scoreless match until the final day of the third World Cup (in 1999) when both the third place play-off and the final ended nil all. Up to the last World Cup finals there have been nine scoreless matches. There has been one more in current tournament when Argentina parked the bus against the favoured Japanese. In comparison over the last seven men's tournaments there has been an increase in scoreless matches from close to 5% of matches to 15% in 2014. In 2018 there was only one scoreless match.

It is interesting though to include the number of games that have ended 1-0. The green bar in the graph below shows the proportion of matches that have had one goal or less (within 90 minutes). The women's World Cup has gone from about 12% of matches in the first tournament in 1991 (and only 6% in 1999) to a third of matches in 2015. (A third of the 12 games in the current tournament have had one goal or less). 

​The grey bar shows the corresponding data for the men's tournaments. Rising from 1994 to 2010 before falling in 2014 and 2018, the level has been between about a quarter and a third. The women's rate has exceeded the men's in the most recent tournament. 

It may be that the fewer number of participants in the women's finals means the best teams are playing and the matches are closer. The number of teams taking part increased however in 2015 from 16 to 24. Adding the extra teams has not diminished the closeness of the games (measured by the proportion of low scoring games). It may instead point to an increase in standards - or at least a decrease in the variability of standards - at the elite level and the women's game converging with the men's game, whether for good or ill.

The data may also point to greater levels of organisation in coaching and associated resources from national bodies for the women's national teams, and further posts may explore that idea.
Picture
0 Comments

The Ever-Expanding World Cup Finals

18/1/2017

0 Comments

 
By Robbie Butler

FIFA recently announced that the World Cup Finals will be expanding from 32 teams to 48 for the 2026 World Cup. This decision has been largely criticised. Fears of diluting the quality and player burn-out are commonly cited as reasons to oppose the move.

From the organiser’s perspective, the World Cup is big business. Broadcasting revenue alone from the most recent tournament in Brazil was worth $2.4 billion. In total, FIFA made a profit of approximately $2.6 billion from the 2014 tournament. Expanding the tournament seems like a no-brainer.
​
There is another reason to expand the competition, which has been rather overlooked. There are many more national associations now than there were even twenty years ago.

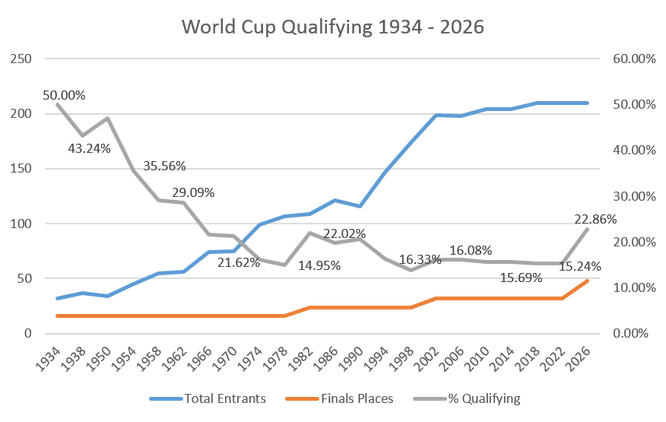
​A historical analysis of previous World Cup qualifications can help understand the evolution toward greater numbers of national associations. Starting in 1934 (the inaugural tournament in 1930 was invitation only), 1 out of 2 countries entering the qualification stage reached the Finals in Italy. This ratio has never been topped. The graph below plots the number of entrants, number of team qualifying (left-hand axis) and the percentage of countries qualifying (right-hand axis) from 1934 to 2026 (assuming the number of associations remains at 210 for the 2022 and 2026 tournaments). 
Picture
The expansion to 48 countries means just over one-fifth of all entrants will reach the finals. The 1982 expansion to 24 teams, and the 1998 expansion to 32, were outpaced by the rapid increase in associations, particularly in UEFA following the collapse of the Soviet Union and break-up of Yugoslavia.
​
Consider the UEFA confederation alone is worthwhile.

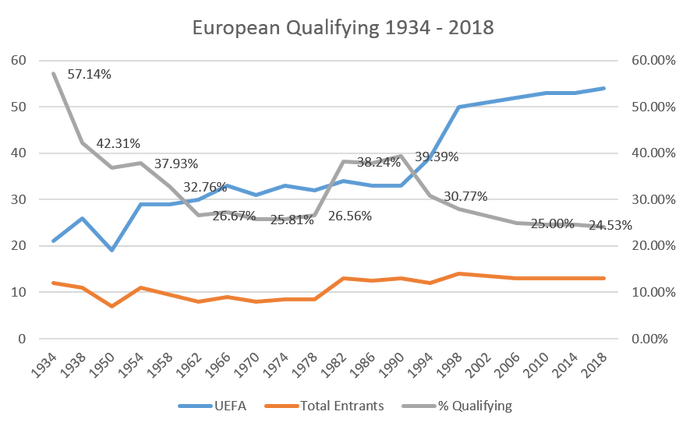
From a European perspective, an increase in the number of UEFA places must be a priority. The second graph below shows just how hard it has become to qualify for the World Cup as a UEFA member, with just 13 places for 54 countries trying to get to Russia 2018. This compares very poorly to the 13 spots available for Italia ’90 when just 33 countries entered the qualification phase. 
Picture
Almost 40% of UEFA countries entering the qualification stage reached the finals in 1990. With an identical number of places, just 24% of associations will be at Russia next year. ​Commentators can criticise the move, but let us not ignore the explosion in the number of FIFA and UEFA members. 
0 Comments

Age Effects in African Under Age Football

31/8/2016

 
by Declan Jordan
The news that broke recently that all but two of Nigeria's Under-17 first team failed age tests for the forthcoming African Cup of Nations was shocking, but not surprising. Nigeria have been remarkably successful in the last decade at U-17 level. Nigeria won the U-17 World Cup in the last two tournaments in 2013 and 2015. They were runners-up in 2009 (when they hosted the tournament) and won as well in 2007. They have won the competition 5 times in all.

However, there have been question marks about Nigerian players' true ages for many years now. Indeed there are strong suspicions that African football,and to a lesser extent other regions, have flouted the age rules for many years. In the 2013 tournament, 3 players from each of Morocco, Congo, and Nigeria were sent home from the U17 World Cup for failing the age test. In 2009 MRI bone scans were introduced to test players were the age they claimed to be.

It may not be surprising that countries would want to use older players, since there is a physical advantage for older players in underage tournaments. Indeed, there is a substantial literature on the 'relative age effect', a topic on which my colleagues on this blog have published research. FIFA rules dictate that a player is eligible for a competition if he or she was born in the designated calendar year, so for the U17 tournament in 2015 players must have been born on or after 1 January 1998 (17 years previously). This means players born earlier in the year (in January for example) can have up to 12 months age advantage (and associated physical advantage) - details on player eligibility is available on page 20 here. There is now substantial evidence that football squads are over-represented by players born in the early months of a calendar year relative to the general population.

What might be expected is that countries who are looking to enter players who are older than they actually are is that they would state an age earlier in the calendar year. For example, in this article it is reported that the Syrian squad for the U19 World Cup in 2012 included six players born January 1, 1993 and that the entire team had January birth dates. That approach seems to be a little bit obvious of course, so perhaps it would be better not to draw attention to your squad by spreading the month of birth out.

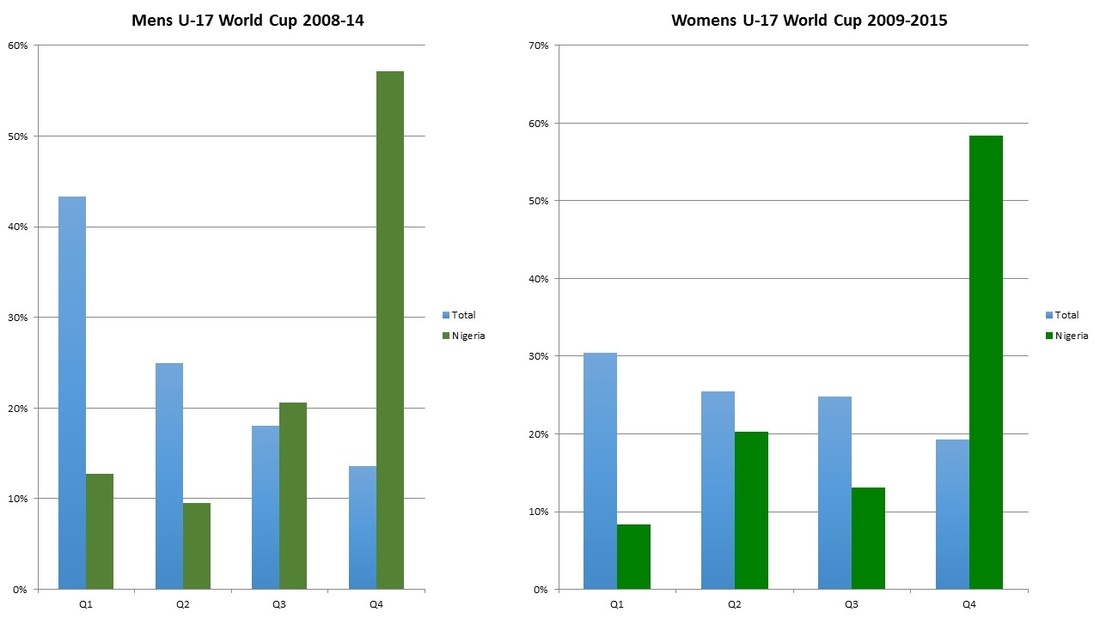
The graphs below show the profile of month of birth (by quarter) for four editions of Men's and Women's U-17 World Cup Finals from 2007 to 2014. There are 24 countries in the Men's World Cup and 16 in the Women's. It is noticeable that the age dispersion is greater for women, more players are born in the later quarters of the year (the difference is statistically significant). The graphs show quite a remarkable difference between the dispersion for Nigerian squads and other squads (excluding Nigeria). Nigeria appeared in all of the four Women's Finals and three of the four Men's Finals. The graphs show that Nigeria had a statistically different month of birth distribution than the average of the other countries.
Picture
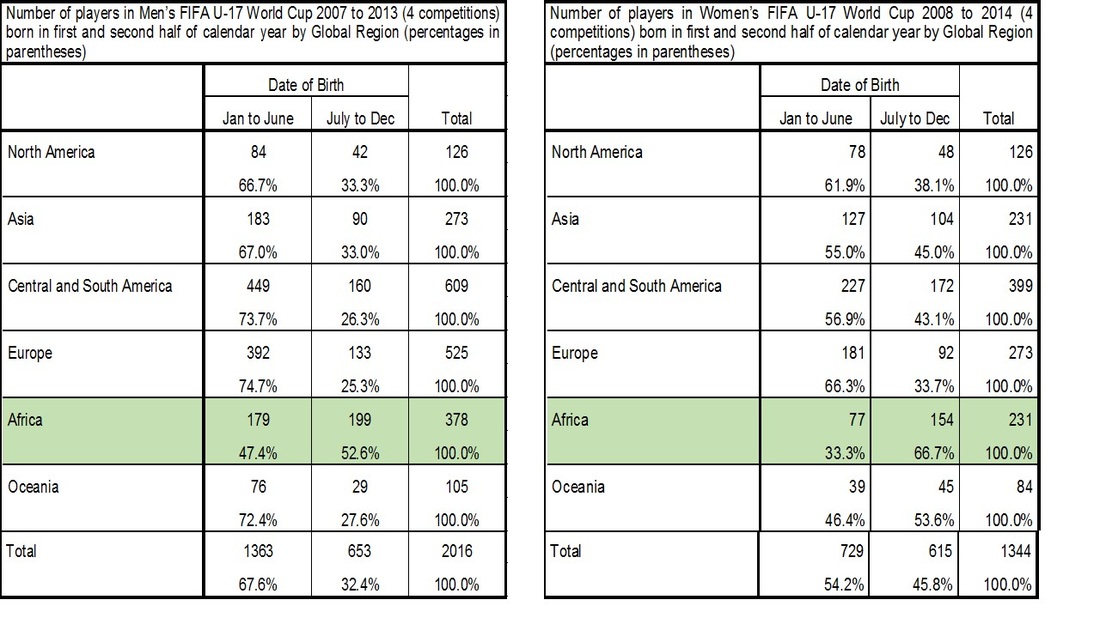
Extending the analysis to look at regional differences in relative age effects, the tables below show the classification of players by the half of the year in which they were born (January to June or July to December) for each global region.
Picture
Africa stands out as the only continent that shows a greater proportion of players born in the second half of the calendar year (the only exception is Oceania for the Women's Finals). The proportion born in the second half of the year is higher for African countries in the Women's Finals. Again, the difference between regions for men and women is statistically significant. 

It is difficult to know the reasons for Africa's exceptional result. If age fraud is a substantial problem there then perhaps the ages being registered are designed to deflect attention by having much less January birthdates. It may be that the birthdate registered is less important where it is different than an actual birthdate. In the absence of age fraud, perhaps there is less physical difference between African athletes of less than a year's age difference, or perhaps African football has avoided the traps of other countries that tend to select more older players and thereby lose younger players to the game. These latter explanations though would likely result in a flat distribution (similar to the dispersion of months of birth in the general population) rather than having such a large proportion in the second half and final quarter of the calendar year.

How was Russia 2018 for you? Stacking the odds against Africa

2/11/2015

0 Comments

 
by Declan Jordan
Picture
​In a recent post my colleague Robbie Butler raised the thorny issue of FIFA country rankings. He bemoaned the problem of countries achieving a higher world rank than should perhaps be warranted because some countries will play more competitive matches against tougher opposition because of their continental affiliation than others. He’s right of course. But the problem of games against tougher opposition is perhaps one that some countries might welcome.
 
The FIFA ranking (or to give them their full title the FIFA/Coca Cola World Ranking) is largely a marketing exercise and is of little consequence. Teams from different continents rarely play each other. In the World Cup finals, teams from various continents are generally kept apart in the group stage draw. This means the overall ranking has little impact, with a country’s position relative to other countries in the same confederation being the critical aspect. For this reason, comparing positions across confederations is of limited value.
 
It does however prompt comparison of how countries accumulate ranking points and inevitably calls into question the conduct of competitive qualification tournaments in each confederation. I have written before about my views on the unfairness of the African qualification process relative to Europe and South America. The African and European contexts are similar to the extent that both confederations have about the same number of affiliated members (54 and 55 respectively). The root of the unfairness lies in huge disparity between the number of qualifiers each continent has – Europe 13 has spaces (not including hosts Russia) and Africa has 5.
 
The African qualifying campaign for Russia 2018 has already begun, and for 13 countries has already ended. In the middle of this month it will have ended for another 20 countries – this is 30 months before the finals will be held. For me this was brought home when looking at the fixtures for my football-mad son, who is Ethiopian, and seeing that they managed to overcome Sao Tome e Principe after being surprisingly beaten 1-0 in the first leg. Their reward is a game against Congo (the eighth ranked African team) in two weeks' time. It seems he has a much better chance supporting Ireland.

Could football fans and national associations in Europe countenance a situation where the lowest 26 ranked teams would have a play-off to continue with World Cup qualifying and risk being eliminated from the World Cup in October 2015 for a 2018 World Cup Finals tournament? The bottom 26 nations in Europe currently includes Turkey, Serbia, Hungary, Bulgaria, Finland, Norway, and more importantly the Republic of Ireland.
 
The first play-offs in Africa were held last month and 13 countries have been eliminated from the 2018 World Cup – having played two matches, one at home. The second round puts the 13 winners from the first round with the remaining 27 African nations who play in a home and away qualifier – the 20 successful teams will progress to play in five groups of four teams with the winner of each group going to the finals in Russia. This means the majority of African countries (33 out of 53 in the current campaign) have less than four World Cup qualifying matches and two at home. 
 
(This contrasts hugely with the South American qualifying campaign where teams play 18 games in a league format with the top four  In fact, Ecuador and Uruguay both won less than half of their matches (7 from 16) in qualifying for the 2014 World Cup – there were 16 games in qualifying last time because Brazil qualified as hosts).
 
The argument of course is that the European teams are better and so deserve more places at the finals (one hopes it is not based on market size or Asia and Africa will soon be entitled to a lot more spaces on that criteria). The FIFA rankings can be used to justify the superiority of the European (and South American) nations. However, this is a circular argument where nations can achieve more points by playing more competitive games, with some of them against higher ranking teams). Playing these (and more of them) fixtures makes teams better – or at least gives them an opportunity to improve more rapidly. Is it possible that Wales’ dramatic improvement from 112th in the world in 2010 to 8th in 2015 could have been achieved in a qualifying environment like Africa’s? This shows the benefit of having games against the 'best' to develop players at international level.

0 Comments

So The IRFU Has Decided To Bid...

6/12/2014

0 Comments

 
By Robbie Butler

News broke on Friday that the island of Ireland is to officially bid to host the 2023 Rugby World Cup. The IRFU has formally announced it's intention to submit an all-Ireland bid, which if successful, will see venues on both sides of the border used to host the biggest rugby event on the planet. If Ireland is successful in attracting the tournament here in nine years time what a wonderful day that will be, for not only Irish sport, but cross-border relations on the island. 

Already there has been speculation as to how much the event might cost, how much the state may have to pay and what the economic impact might be on the island.

Major sporing events like these rarely, if ever, generate an economic surplus for a state, create sustainable long-term employment or even dramatically increase tourist numbers. I have written and spoken extensively, both national and internationally on this here, here, here, here and here. 

There will be winners of course, the biggest one being World Rugby (formerly International Rugby Board), but this tournament, if it comes to Ireland, will cost the state money. 

It's like throwing a big party, the biggest this country has ever seen. Anyone that's ever thrown a party will know you don't make money from them. But what fun it will be. 
0 Comments

The 'Young Lions' Myth?

9/8/2014

 
By David Butler

This week TheTelegraph reported that the England squad had not lived up to Roy Keane's expectations in the World Cup this Summer and that Keane believed England's young players were overrated. The article is one in a long line that has considered the young English footballers that travelled to Brazil. Similiar references to England's fledging talent have been reported recently by Sky Sports here and here and by FIFA here.

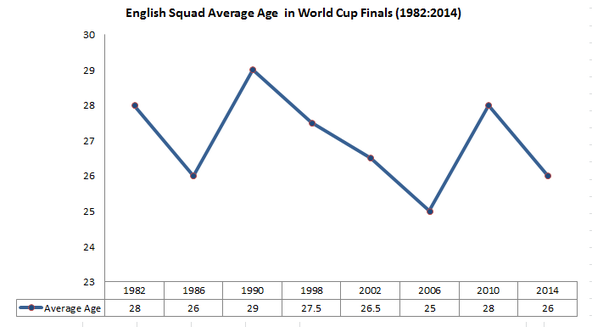
While the ability of England's footballers is a matter of opinion, their ages are not up for question.  The current England squad may have notable young individuals that stole the media attention but, taken as a whole, the squad is not disproportionately young.

England had a younger squad on average in the 2006 World Cup (Mean 25, SD 4.22) than the 2014 squad (Mean 26, SD 4.79). They were marginally older on average in 2002 (Mean 26.5, SD 5.44) and had the same average age for the 1986 World Cup (Mean 26, SD 3.14). The average age of the 181 players that have travelled to World Cups for England since 1982 has been 27.

Picture

While the current crop of English talent, at an average age of 26, do come in on the lower end of the age spectrum when compared to other nations in Brazil, the age composition of Roy Hodgson's squad this Summer followed similar models to the 1998, 2002 and 2006 cohorts. In short, this involved blending youth (<24) and experience (>30). The age structure of Hodgson's squad for Brazil was not particularly rare. For instance, in 2002 nine players were under 24 (see table below) but David Seaman, Martin Keown, Nigel Martyn, Gareth Southgate, Teddy Sheringham and David James were all over 30.

Perhaps I am wrong and my memory is a little hazy but I can't recall the 2002 squad receiving attention for its youth...

Is it the case that the 'youth argument' is being used as a crutch to rationalise England's worst performance in a World Cup since 1950? Perhaps it is not a question of youth but of the quality or experience of the youth relative to other countries or previous World Cups that is the bigger issue? Both sets of youth in 2002 and 2014 did however have the same levels of experience, with an average of 11 caps each for the footballers under 24. Michael Owen even brings up this average for the 2002 team as he had 35 caps travelling to Korea and Japan! 

Maybe one could disagree with Roy Keane and make the case that the youth in the current squad is just as good as it ever was and that the declining quality of England's senior players is the root cause of their poor performance in Brazil? As a corollary, maybe declining senior players pushed too much pressure on the under 24 cohort or lack the experience themselves as some came to the international stage late?

While lots of the questions posed above are debatable, two points are clear  - 1. The current England squad is not disproportionately young relative to their previous World Cup squads and 2. This is not the first time England had a squad with a youth focussed age composition at a World Cup.  

Picture

The Simpsons, FIFA & Match-Fixing

10/6/2014

0 Comments

 
By Robbie Butler

A number of weeks back we did a selection of sports economics and Simpsons pieces to coincide with the launch of Homer Economicus: The Simpsons and Economics. Last week’s Sunday Times report on the alleged corruption surrounding Qatar’s successful 2022 World Cup bid gives us more ammunition. The newspaper claims that large sums of money were passed between those behind the Qatar bid and FIFA representatives with voting privileges. At the centre of the allegations is former FIFA's executive committee member Mohamed bin Hammam. The Qatari national was supposedly a key figure in securing the 2022 World Cup. However, the Sunday Times reports that leaked email documents prove bin Hammam paid members of other nations' Football Associations prior to the 2022 FIFA World Cup bid. FIFA’s main sponsors (such as adidas and Sony) are now publically calling for an investigation into the matter. 

This corruption story comes hot on the heels of another. A recent international friendly between Scotland and Nigeria at Fulham’s Craven Cottage was supposedly targeted by match-fixers. These allegations of fraud in the “beautiful game’ were so serious that the Scottish Football Association contacted the National Crime Agency to investigate the matter.
PictureHomer with the Executive Vice President of the WFF
In March of this year, Fox aired You Don't Have to Live Like a Referee¸ the 16th episode of the 25th season of The Simpsons. The plot goes as follows. Following Lisa’s success in a school ‘hero’ competition, a speech she gives during the event goes viral, the result of which is Homer being asked to referee games during the World Cup in Brazil by the Executive Vice President of the fictitious World Football Federation (WFF). The VP satirically says to Homer “Mr. Simpson, please help us. The rot is everywhere. In fact, I see that eh, I myself am about to be arrested for corruption”, before being led away in handcuffs.

Following an excellent refereeing performance in an opening round match between Brazil and Luxembourg, Homer becomes the target of match-fixers. He is greeted by men who offer him a briefcase full of cash. Homer refuses the bribe and vows to be an honest referee despite the protests of the match-fixers. However, upon hearing that he is in fact not Lisa’s ‘hero’, he becomes depressed and decides to drink his problems away. Devastated by Lisa’s ‘betrayal’ he decides to accept a bride on the World Cup final between Brazil and Germany. Homer is offered $1 million so that Brazil will win the World Cup. Upon overhearing this conversation Lisa begs Homer not to take the bribe.  

During the game, a Brazilian by the name of El Divo dribbles into the penalty area before diving. Homer true to his morals however, does not award the penalty. Germany go on to win the match 2-0 and lift the World Cup.
While most of us strongly doubt the actual World Cup final will be the victim of match fixing, this Simpsons episode is a timely reminder of the dangers posed by match-fixers. The buildup to Brazil has been marred by street protests, unfinished stadia and alleged corruption at the highest level of the game. Above all things let’s hope the football is clean. Afterall that’s why we watch.
0 Comments

4 World Cup Tips

7/6/2014

 
By David Butler

With the World Cup starting next Thursday I’m sure plenty are filling out those prediction forms at work and school.  It may not be much help but here’s some quick advice based on the statistics of questions people are often asked to answer.

1. Qualifying: In terms of qualifying for the last 16 it's not always plain sailing for the top two teams in a group. If we a use (and trust) the FIFA rankings to categorise teams,  from 'the real pot C and D' teams in groups  over the last 4 world cups (since it became a 32 team competition),  14% of the 128 teams on the lower end of the relative rankings progress to the last 16. The advice: Mostly include favourites to qualfiy from the group but choose 4-5 teams that are not expected to qualify from the group.

2. Goals Scored: There was an average of 156 goals scored over the last 4 World Cups.  France 98’ saw the most goals ever scored in a World Cup at 171. This has reduced since to 161,147, and 145 respectively. There has been an average of 2.44 goals scored per game over the last 4 competitions.  The advice: use the average as a benchmark and perhaps guess a maximum of 12 goals either side. 

3. Golden Boot: There maybe another case of the cursed prolific goalscorer here. In the 19 World Cups to date only  25% of the top goal scorers have played for the champions (Schiavio – joint for Italy in 1934, Ademir for Brazil in 1950, Kempes for Agentina in 1978 and Ronaldo for Brazil in 2002). Just looking again at the last 4 world cups the top goal scorers have all played the maximum 7 games (Suker-Croatia 1998, Ronaldo-Brazil 2002, Klose-Germany 2006 & Mueller-Germany 2010) The advice: Choose an attacking player you believe will get to the end of the competition (third place play-off or final). He does not necessarily have to be in the winning team.

4. Winner: As Robbie Butler has suggested “the average age of the winning team since 1994 has been 27.75 years. Brazil’s most capped 18 will be aged 27.56 years.” Also only 1 in 5 World Cups have been won by nations outside of the host continent so the advice would be to stick with the bookies favourites, given that Brazil tick these two boxes of age and geography.... Their not bad footballers either..!

If these don’t help you may need to make friends with a mystic octopus or alternatively familiarise yourself with Stephen Hawking’s World Cup math! 

Who Will Win The World Cup? The Age Effect

5/6/2014

 
Picture
By Robbie Butler

Previously, we have examined the impact of age effects in football. An extensive literature has been built up in this area over the past number of years, with a growing number of people aware of the impact age can have on performance, from underage to adult football. With the World Cup just days away I thought it timely to examine the age of all 32 provisional squads travelling to Brazil. This analysis covers 736 players from the competing countries. Between them they have amassed a total of 24,500
plus caps!

The oldest player currently going to Brazil is 42 year old Colombian goalkeeper Faryd Mondragón. The Deportivo Cali stopper is 24 years older than Fabrice Olinga (Cameroon) and England’s Luke Shaw, both of whom are 18 years of age. 

Picture
Looking at previous World Cup’s over the past 20 years gives us an insight as to what to expect. The table below presents data on the average age of winning squads and the average age of the 11 players that lined out in the final for the winners. With the notable of expectation of the victorious Italians (2006), squads and teams are generally getting younger. 

So what does that mean for the 32 countries heading to Brazil? The table below takes a closer look.

Picture
Argentina bring the oldest squad to Brazil. Should Messi and co. lift the FIFA World Cup their squad will be older on average than the Italian’s in 2006. However, the data would suggest that this isn’t a good sign for the much fancied second favorites. England look worryingly ‘young’, with an average age across their 23 players of just 26.04. Spain were younger when they lifted the trophy in 2010 and bring a squad that is on average two years older to the 2014 tournament. One could question whether there are now too many miles on the clock for these legends.

Just to dig a little deeper, the final table (below) only considers the 18 most capped players in each squad. As we don’t know who will line out, and because some younger players (with very few caps) may not play at all, we might get a closer estimate of the average age of each starting eleven by considering the most capped players. The assumption is that these are most likely to play. This isn’t a perfect measure but will have to do for now.  
Picture
Honduras, Greece, Portugal and Iran all break the 29 year old mark and can probably be considered too old. Germany bring quite a young squad of 18 but could emulate the 2002 Brazil team who were aged just 26.18 on average when winning the World Cup. It would appear however that the hosts are perfectly poised. The average age of the winning team since 1994 has been 27.75 years. Brazil’s most capped 18 will be aged 27.56 years. Ominously close. 

Only time will tell.

A Stadium But No Team

23/5/2014

 
Picture
By Robbie Butler

The World Cup is only days away. Anticipation is growing by the day and I for one cannot wait for the tournament to start. Sadly, many in Brazil feel differently. Continued reports of civil unrest and street protests are emerging from the South American country. This week, football legend and Brazilian national icon Pele labelled preparations for the tournament “a disgrace”. The former Santos star and three-time World Cup winner blames “ongoing corruption that has  delayed construction of the stadiums”. 

Probably the best example of stadium excesses is the story of Estádio Nacional, the newly built multi-purpose stadium in the capital Brasília. Demolished in 2010, the stadium was rebuilt, and now boasts a maximum capacity of just over 70,000 seats. To date it is the second most expensive football arena on the planet, costing three times more than the original estimate ($300m).  Estádio Nacional will host seven matches during the month long World Cup, one of which is Cameroon versus Brazil.

Picture
While this might not sound too outrageous, here’s the catch. 

Brasília is located in the Distrito Federal (Federal District) and has about twenty football teams. Of these twenty, only five could be considered clubs of note, having competed in the upper tiers of professional football in Brazil. 
 
Next season, the highest rated football teams in the district will compete in the Campeonato Brasileiro Série D, the 4th tier of Brazilian football! Brasília Futebol Clube, Brasiliense Futebol Clube and Sociedade Esportiva do Gama will fly the flag in Série D for the Distrito Federal. To give you an idea of it's popularity, attendance at the first leg of the final game in Série D in 2013 was just over 4,000 people. Nearly 18,000 people attended the FAI Cup final between Drogheda United and Sligo Rovers in November 2013.  

The World Cup will end on Sunday 13th of July. One country will celebrate long into the early hours, and in the days and weeks ahead. For the vast majority, it will be a case of what could have been. Heroes will be born. No doubt villains will emerge. And while the rest of us get back to normal, happy in the knowledge that our memories will last a lifetime, the people of Brasília will be left with a white elephant. A stadium fit for the finest clubs on the planet with no team to fill it. 

70,000 empty seats. $12,857.14 per seat. Almost identical to the average annual income (GDP per capita) in Brazil. $900,000,000 could build an awful lot of new schools and hospitals. 

    Archives

    February 2023
    January 2023
    December 2022
    November 2022
    October 2022
    September 2022
    August 2022
    July 2022
    June 2022
    May 2022
    April 2022
    March 2022
    February 2022
    January 2022
    December 2021
    November 2021
    October 2021
    September 2021
    August 2021
    July 2021
    June 2021
    May 2021
    April 2021
    March 2021
    February 2021
    January 2021
    December 2020
    November 2020
    October 2020
    September 2020
    August 2020
    July 2020
    June 2020
    May 2020
    April 2020
    March 2020
    February 2020
    January 2020
    December 2019
    November 2019
    October 2019
    September 2019
    August 2019
    June 2019
    May 2019
    April 2019
    March 2019
    February 2019
    January 2019
    December 2018
    November 2018
    October 2018
    September 2018
    August 2018
    July 2018
    June 2018
    May 2018
    April 2018
    March 2018
    February 2018
    January 2018
    December 2017
    November 2017
    October 2017
    September 2017
    August 2017
    July 2017
    June 2017
    May 2017
    April 2017
    March 2017
    February 2017
    January 2017
    December 2016
    November 2016
    October 2016
    September 2016
    August 2016
    July 2016
    June 2016
    May 2016
    April 2016
    March 2016
    February 2016
    January 2016
    December 2015
    November 2015
    October 2015
    September 2015
    August 2015
    July 2015
    June 2015
    May 2015
    April 2015
    March 2015
    February 2015
    January 2015
    December 2014
    November 2014
    October 2014
    September 2014
    August 2014
    July 2014
    June 2014
    May 2014
    April 2014
    March 2014
    February 2014
    January 2014
    December 2013
    November 2013
    October 2013
    September 2013
    August 2013
    July 2013

    About

    This website was founded in July 2013.

    RSS Feed

    Categories

    All
    American Football
    Athletics
    Baseball
    Basketball
    Behavioural Economics
    Boxing
    Broadcasting
    Competitive Balance
    Cricket
    Cycling
    Darts
    David Butler
    Declan Jordan
    Drugs
    Ed Valentine
    Epl
    Esports
    Expenditure
    F1
    Fifa World Cup
    Finances
    Funding
    Gaa
    Gaelic Games
    Gambling
    Game Theory
    Gary Burns
    Geography
    Golf
    Greyhound Racing
    Guest Posts
    Horse Racing
    Impact Studies
    John Considine
    John Eakins
    League Of Ireland
    Location
    Media
    Mls
    Mma
    Olympics
    Participation
    Paul O'Sullivan
    Premier League
    Regulation
    Research
    Robbie Butler
    Rugby
    Simpsonomics
    Snooker
    Soccer
    Spatial Analysis
    Sporting Bodies
    Stephen Brosnan
    Swimming
    Taxation
    Teaching
    Technology
    Tennis
    Transfers
    Uefa
    Ufc
    World Cup
    Wwe

Related

The website is not formally affiliated to any institution and all of the entries represent the personal views and opinions of an individual contributor. The website operates on a not-for-profit basis. For this reason we decline all advertisement opportunities. 

Contact

To contact us email sportseconomics2013@gmail.com or find us on Twitter @SportEcon.