The Economics of Sport
  • Sports Economics
  • About
  • Workshop
  • Selected Publications
  • Book Reviews
  • A Primer on Gaelic Games
  • Upcoming Events
  • Media
  • Education
  • Resources & Links
  • Data

The Relative Age Effect And The U17 European Championships

29/5/2018

 
By Brian Cronin,

The Republic of Ireland U17 European Championship squad made national headlines recently when they controversially exited the tournament on penalties at the hands of the Netherlands. The performance of the squad raises hope for the future and is no doubt down to a combination of dedication, effort and skill on the part of the players, and excellence in coaching and tactics.

Another factor at play might be a relative age effect. The concept, which is now well understood, suggests relatively older children, assembly collectively under a selection year, will outperform their younger peers.  

To have been eligible to compete in the 2018 U17 European Championships, all players had to have been born on or after 1 January 2001. Indeed, the January 1 cut-off date is also used in Irish underage schoolboy competitions. Consequently, the Relative Age Effect (RAE) manifests itself, whereby players born closest to this cut-off date would tend to be physically more mature and co-ordinated when compared with players born later in the year. They are also likely to be both cognitively and psychologically more developed. Ultimately, this results in these players then getting chosen for representative squads at an earlier age where they are exposed to better coaching, better opposition and greater opportunities to progress within the game. 

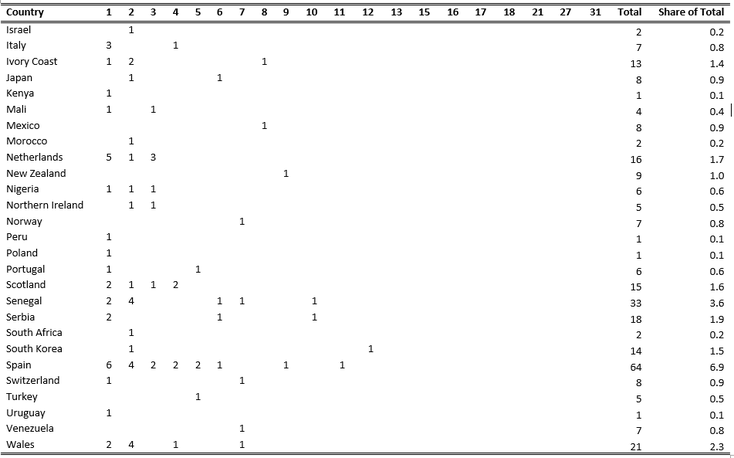
​The chart below shows that of the 21 players selected in the Republic of Ireland squad for the 2018 UEFA U17 European Championships (Kian Clarke, who was originally selected but ruled out through injury, is also included). 
Picture
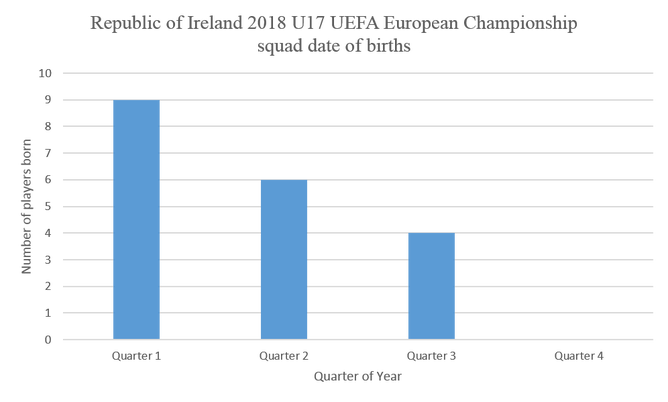
9 (43%) were born in the first three months of the year (seven in 2001 and two in 2002). Conversely, not a single player selected was born in the final three months of the year, even though the distribution of the general population in Ireland is evenly spread throughout the year.

The particularly interesting feature of this Irish U17 squad is that, although there were no players born in the final three months of 2001, there were two players born in the first three months of 2002 - both of whom started all four games at the tournament (Troy Parrott and Jimmy Corcoran). This accentuates the pervasiveness of RAE - these players, being two of the more physically developed within their 2002 age group, would have been more likely to have been exposed to elite coaching growing up when compared with those born in the final months of 2001.

Perhaps some food for thought for underage schoolboy soccer coaches.

Brian Cronin is a 3rd year student at University College Cork and has just completed an Erasmus Year in France as part of his BComm International (French) Degree. Brian represented the Republic of Ireland at U16 level and is now the goalkeeping coach to four Cork Schoolboys League Kennedy Cup teams, and has coached goalkeepers at regional Emerging Talent level as well as internationally, with the Irish Amputee Football team. 

For more on Irish soccer and the relative age effect see here.

Economic History Of Sport & World Cup Workshop

28/5/2018

 
By Robbie Butler

Professor James Reade at the Centre for Institutions and Economic History at the University of Reading is hosting two  gatherings next month.

Day 1 kicks-off on Wednesday the 13th of June and examines the history of sport. Contributions will be made by Robert Simmons, Stefan Szymanski, James Reade, Rafaelle Nicholson, Dilwyn Porter and keynote Wray Vamplew.

Day 2 on Thursday the 14th of June coincides with the start of the FIFA World Cup and is aptly focused on the tournament. Academic papers will be presented by Adrian Bell, Bernd Frick, Alex Bryson, Babatunde Buraimo and Katrin Scharfenkamp. The evening keynote will be delivered by Stefan Szymanski.

These events are free but registration is required. Those interested in attending should contact James Reade at
j.j.reade@reading.ac.uk

Sackings & Style

21/5/2018

 
By David Butler

‘Style’ has cost Sam Allardyce his job at Everton apparently. Despite being quite forward thinking throughout his career and doing a sterling job (in terms of points accumulated) since taking over at Everton, Sam has found it hard to shake his managerial identity.

It seems fans and owners of traditionally elite clubs want their team to not only win, but to win well.  Such are the demands of modern management.

Measuring style can be tricky. Goals scored from set pieces is one way that comes to mind. Another is passes completed by a team. Typically, teams that are easier on the eye can effortlessly string together passes into neat moves. Arsenal’s invincibles come to mind and so to do the Barcelona and Spain teams that adopted ‘tiki-taka’ so successfully.

The graph below shows passes per match (PPM) plotted against points for premier league clubs this season. Maybe a more granular measure would be a count of strings of forward passes.
Picture
Maybe the style of teams can be considered this way.

Manchester City were outstanding to watch this season. Manchester United on the other hand, while second, were criticised for effective but boring performances – Liverpool, Tottenham and Chelsea all ‘outpassed’ Manchester United. Arsenal’s style also stands out.  Wenger’s team had the second highest PPM in the league at 619.05 but it was accompanied by a leaky defence.

What about Sam and Everton? Their PPM is wedged between Brighton and Huddersfield. While Sam delivered in terms of points accumulation, the ‘product’ he delivered, as measured by PPM, was no more attractive than that provided by the promoted teams.

Burnley are an interesting case. The fans seem happy with Sean Dyche despite their relatively unattractive football. They have the 3rd lowest PPM 357.16 in the league. Burnley are only ahead of two relegated teams on the PPM stat - Stoke and West Brom. Expectations are important – managers not afforded big budgets or those freed from the anticipations of free-flowing football are lauded once things go right with a relatively abrasive style.

Trying to play beautiful football when you’re stuck in the trenches may not be the best idea either. Southampton have a relatively high PPM of 451.95. The Southampton fans were arguably offered a more attractive style than plenty of other club but Pellegrino still got the sack. Would they trade off the style value for a season like Burnley’s?

2018 Sports Economics Workshop

21/5/2018

 
By Robbie Butler

The 4th sportseconomics.org workshop will be held on Monday 23rd and Tuesday 24th of July 2018 at University College Cork. The event is being hosted by the Centre for Analysis and Risk.

The theme of these year's event is sports betting and a selection of technical academic papers in the area will be presented over the two days. 

​General Information

Betting on sports is an enormously popular activity, which earns significant revenues, enhances many fans’ sense of emotional involvement with sports, and, on the downside, causes substantial welfare loss to people who gamble recklessly or addictively. For the economist interested in people’s preferences over risk, and the interaction of these preferences with their beliefs about probabilities, sports betting provides a field setting almost ideally designed for supporting rich inferences. Policy makers and regulators who have responsibilities associated with sports, leisure, and gambling can gain crucial insights into, and predictive leverage over, responses to changes in odds and incentives through observations of naturally occurring sports betting, as well as through economists’ laboratory and field experiments with punters. The CEAR workshop on Sports Betting brings together both researchers who specialize in the economics of sport, and theoretical and experimental risk specialists who use sports betting contexts as environments for establishing more general insights into risky choice.

Conference Program

Monday July 23
​
9:15 – 9:45        Launch of the UCC Centre for Sports Economics and Law
9:45 – 10:00      Workshop welcome and Background on CEAR
10:00 – 11:00    Filippos Papakonstantinou: History-dependent risk preferences: Evidence from individual choices                               and implications for the disposition effect

11:15 – 12:15    Angie Andrikogiannopoulou: Heterogeneity in risk preferences: Evidence from a real-world betting                              market
12:15 – 1:15      Glenn Harrison & Eberhard Feess: Welfare Evaluation of Sports Betting Conditioned on Elicited                                  Risk Preferences and Subjective Beliefs


2:30 – 3:30        Sylvan Herskowitz: Gambling, Saving, and Lumpy Liquidity Needs
3:30 – 4:30        Amit Gandhi: TBA

Tuesday July 24

9:30 – 10:30      Raymond Sauer: TBA
10:30 – 11:30    Rob Simmons: Betting Markets, Outcome Uncertainty and Competitive Balance in Sports: What                                    Have We Learned?

11:45 – 12:45    Brad Humphreys: A Simple Test of Semi-Strong Form Market Efficiency Using US College Sports                                Betting Data

2:00 – 3:00        Alasdair Brown: The Use of Framing Manipulations By Victorian Bookmakers
3:00 – 4:00        David Butler, Robbie Butler and Justin Doran: Turf Accountancy - A Spatial Analysis of                                              Bookmakers
4:00 - 4:05         Close 

The Disappearing Midtable

18/5/2018

 
By Robbie Butler

With the dust settling on the 2017/18 Premier League season, preparations for the league's return in August are already gathering pace. With World Cup 2018 on the horizon, club activity usually occurs in two bursts. before and after the tournament, making World Cup years feel somewhat different.

This is no more evident that the recent sacking/parting company of Premier League managers in the past number of days. Arsenal have been joined by West Ham United, Everton, and today Swansea and Stoke, who are all seeking a new managerial appointment. 

In a previous post, I illustrated the downward trend in the number of days managers stay in their job, which the League Managers Association chief Richard Beven described as "embarrassing" for the sport. His words have had little effect on club owners.

During the 2017/18, excluding the recent exists of Arsene Wenger, David Moyes, Sam Allardyce, Carlos Carvalhal and Paul Lambert, ten managers lost their jobs. This includes two changes at West Bromwich Albion. That's a total of 16 managerial changes. 

The pressure that managers come under, particularly at the start of the season, seems to be growing year on year. Within this, the league itself appears to be breaking into two groups. Teams fighting for the top 4 and teams in a relegation battle.The mid-table appears to be disappearing. In fact, this season one could argue only Burnley and possibly Watford (although their season tapered off) were not in a relegation battle or in with a realistic chance of reaching the top 4.

The graph below would support this somewhat, and illustrates how the league is squeezing out the mid-table teams.
Picture
"Safe" assumes same number of points as 18th place team but superior goal difference.
The data used in the graphic is drawn from Premier League tables from 1995-96 season to 2017-18. Data prior to this is not useful as the league contained more than 20 teams. 

The number of points required to win the league and finish 4th (last Champions League place) is upward trending. The points needed to survive is downward sloping.

As a general rule, 40 points is used as a benchmark for safety. One would have to go back to 2002/03 to find the last time 40 points was actually required to be safe. in the past five seasons, an average of just 34.4 were required to stay in the division. The average from 1995-96 to 1999-00 was 37.4

On the other hand, the number of points needed for the top 4 is climbing. Just 65.6 points were required in the first five seasons show above. Since 2013-14 this has risen to 73.2. In the first twelve seasons (1995 to 2007) only once did the 4th place team break 70 points. In the eleven since May 2007 the 4th placed team was broken 70 points on 8 occasions. Arsenal finished 4th in 2013-14 with a whopping 79 points. 

Follow the Pundit 17/18

16/5/2018

 
By David Butler

For the last four seasons I’ve kept a record of the predictions for the Sky Sports pundit Paul Merson and the BBC pundit Mark Lawrenson. The ‘Follow the Pundit!’ section of the website provides updates on the success of these tipsters who systematically predict score lines for Premier League matches. 

The stats for this season are based on 367 (Merson) and 359 (Lawrenson) predictions. A similar pattern to past season exists – in any given gameweek the pundits typically call half of the outcomes correctly.
 
While Merson does slightly outperform Lawrenson again this season, both performed worse when compared to last season.  

If you were to place €1 on each of their scoreline predictions, Lawrenson would have actually turned a profit of €58.81 through predicting 12% of the scorelines correctly. Following Merson's scoreline estimates with a €1 stake per match renders a loss of -€47.77.
Picture

Is Irish Sports Participation Really 43%?

14/5/2018

 
By John Considine
Last week, the latest edition of the Irish Sports Monitor was presented with the usual positive spin.  The first bullet point in Section 3 says "43% of the population regularly participate in sport. This is at the same level as 2015 ...".  A nice colour picture is used to illustrated the point and is reproduced below.  The website of Sport Ireland reiterates this point as one of the key findings of the latest report.
Picture
Was it really 43% in 2015?  That was not my memory of it.  But my memory is not what it used to be.  Therefore I decided to check out the 2015 Irish Sports Monitor that is available on the website of Sport Ireland.  The corresponding Figure 3.1 from the 2015 report is produced below and seems to suggest that the 2015 participation rate is 45%.  The picture says 2016 but directly above it the text talks about 2015 ("The 2015 survey finds that 45% of ...").
Picture
Maybe the method of data collection has changed?  In Section 2 of the 2017 report there is a paragraph that suggests that 2015 and 2017 are directly comparable - whatever about previous years.  A screenshot of the paragraph is reproduced below.
Picture
So it seems the figures for 2015 and 2017 are comparable.

Let us suppose it was 43% in 2015, 45% in 2016, and 43% again in 2017.  This raises further questions.  This would mean it increased by 2% in one year and decreased by 2% in the following year.  A previous Irish Sports Monitor suggested participation rarely changes by more than 1% per year.  Strange.

I will have to return to the documents and try to uncover something that I must be missing.

Rule Changes or Gimmicks

9/5/2018

 
By John Eakins

A recent article on the42.ie caught my eye (here). It outlined how World Rugby have approved of temporary rule changes to the scoring system for a new series of invitational matches. These matches, dubbed ‘World Series Rugby’, have been established to provide games for the Australian rugby franchise team, the Western Force. For those of you who don’t know, the Western Force were dropped from the Southern Hemisphere Super Rugby competition last year as the number of teams were condensed from 18 to 15. The Force are scheduled to play matches against Fiji, Tonga, Samoa and Hong Kong along with other Super Rugby teams, the Melbourne Rebels and Crusaders, over the coming months.

While a number of temporary rule changes have been approved for the series of matches, including placing a one minute limit on scrums and allowing lineouts to be taken as quickly as possible, what has generated most interest is the introduction of a seven point try (which turns to nine points if converted). A seven point try will be awarded, if a team initiates an attack from behind their own 22 metre line and there is no break in the continuity of their possession before they score, that is, when the ball is turned over to the opposition through a penalty, scrum or lineout.

According to the42.ie article, Rugby Australia is hoping the change “will reward positive play.” I wonder if this is the main rationale to be honest. The fact that the try is to be called a ‘Power Try’ and that the goalposts will light up to indicate to fans when a ‘Power Try’ is possible or has been scored suggests to me that this is more of a gimmick to attract people's attention to the new series of matches.

Another recent example of this, is a proposal by the English Cricket Board to introduce a new domestic cricket competition which will be based on each team bowling one hundred balls, 20 balls less than the current twenty20 format (see here). The working title of the new competition is 'The Hundred'. The shorter format, they say, will appeal to families and TV audiences. In addition to the shorter nature of the game, another element being proposed is to have a 10 ball final over (as opposed to the traditional 6 ball final over in 50 over and twenty20 games). Given that most twenty20 games are decided in the last few overs, I suspect most games in this new cricket competition will be decided in this last 10 ball over. Which is probably what the organisers want, that is, to ensure the outcome is undecided until the very end. The only issue I would have with this new format is audiences may focus too much on the final over and not bother with the rest of the game.

Are these changes genuine attempts to enhance the quality of the game or are they gimmicks? I’m not so sure. Many cricket players share my feelings too (see here, here and here). And this is where I think care needs to taken in treading that fine line between a genuine rule change and something which is intended more for marketing purposes. Of course gimmicks are not necessarily a bad thing and can add to the sense of atmosphere and excitement in a game. But the danger is that, with the increasing pressure on sports executives to maintain attendances and TV audiences, games could become more about the gimmick than the game itself.

Shares, Shots and Statistics

8/5/2018

 
By Sean O'Connor

With the Premier League winding down after what could be considered a fairly uncompetitive title race, it’s interesting to point to some facts and figures from the season thus far. As of the time of collecting this data (02/05/2018), a total of 927 goals have been scored. Of these 927 goals there have been 245 unique goal scorers. However, how is this broken down in terms of nationality? Table 1 charts this.
Picture
Picture
​The 927 goals scored have been scored by players from 53 different countries. Interpreting Table 1 columns titled 1 to 31 indicate the number of goals scored so far in a season. Each value in the accompanying table denotes the number of nationalities which have scored that number of goals. So, one Algerian (Islam Slimani) has scored a single goal this season, while another Algerian (Riyad Mahrez) has scored 10 goals. In terms of a share of the total, Algeria has contributed to 1.2% of the total Premier League goals.
​
As is to be expected, English players contribute the largest share of goals to the Premier League (28.8% or 267). Of these 267 goals, 23 have come from 23 players scoring a single goal. Although Egypt’s Mohamed Salah is the current Premier League to scorer, Egypt, have only contributed 3.8% of total Premier League goals.  From an Irish point of you, it has been a disappointing season so far. Ireland’s share of total goals stands at 1.2% with 5 players only scoring a single goal and 3 players scoring two. Although Table 1 provides an interesting examination of a country’s share of goals in the Premier League, it would be interesting to analyse these trends on a longitudinal basis. A future blog will look at this.

Sports Broadcasting and Horse Racing

4/5/2018

 
By Robbie Butler

There are presently 86 racing courses operating in the United Kingdom (UK) and Ireland, or British Isles to use the geographic terminology. The breakdown by country is England (52), Ireland (24), Scotland (5), Wales (3) and Northern Ireland (2). Racing at these locations is an all year round occurrence, with only Christmas Day and Christmas Eve in the UK certain to have no fixtures each year.

The regularity of the sport ensures a constant stream of live content for sports broadcasters. Traditionally available on free-to-air television and within bookmaker betting shops, the market for live content changed in the early 2000s with the arrival of subscription channels. Much like the market for Premier League football a number of broadcasters now exist and “compete” with one another.

As Hoehn and Lancefield (2003) identify, completion occurs in a two-stage game; the first stage involves competing for rights to the race courses, if rights are non-exclusive or face close substitutes, broadcasters compete in respect of the quality of their coverage and analysis. The second is competition in the downstream market for consumers.

In the UK, there are two main racecourse owners. Arc Racing Company and Jockey Club. Between the two they control almost half of all British race courses. The remainder are owned independently.

Ireland is somewhat different. Horse Race Ireland (HRI), a government financed government body, manages the sport on an all-island basis with the two tracks in Northern Ireland directed from Co. Kildare. While ownership of the courses is largely private, direction, fixtures and the vast majority of funding comes from HRI.

Racing is available on free-to-air channels in the UK and Ireland on a weekly basis. That said,  the number of races shown is limited and coverage is normally restricted to a Saturday. Remaining races can be viewed on a subscription basis by purchasing one of two channels; Attheraces (to be rebranded Sky Sports Racing from on or before January 1st, 2019) and Racing UK.
​
As on May 2018 Attheraces has the rights to all 15 Arena Racing Company, Hereford Racecourse (run by the local council), a number of independent tracks and all 26 race course on the island of Ireland. Racing UK holds the rights all 14 Jockey Club tracks, two run by Chester Race Company and numerous independent course.
Picture
Things are set to change however as it was recently announced the Racing UK had won the rights to show all racing from Ireland from 2019 onwards. While Sky Sports Racing recently announced an agreement to take over broadcasting of live races from Chester Race Company’s course in Bangor-on-Dee and Chester, the loss of 26 courses will be seen as a major blow. The graphic above demonstrates the change in market power from 2018 to 2019 for both channels.
​
Attheraces coverage of Irish racing has been excellent over the past decade or more. It will be interesting to see how the move to Racing UK (which may now require rebranding) works out.
<<Previous

    Archives

    March 2023
    February 2023
    January 2023
    December 2022
    November 2022
    October 2022
    September 2022
    August 2022
    July 2022
    June 2022
    May 2022
    April 2022
    March 2022
    February 2022
    January 2022
    December 2021
    November 2021
    October 2021
    September 2021
    August 2021
    July 2021
    June 2021
    May 2021
    April 2021
    March 2021
    February 2021
    January 2021
    December 2020
    November 2020
    October 2020
    September 2020
    August 2020
    July 2020
    June 2020
    May 2020
    April 2020
    March 2020
    February 2020
    January 2020
    December 2019
    November 2019
    October 2019
    September 2019
    August 2019
    June 2019
    May 2019
    April 2019
    March 2019
    February 2019
    January 2019
    December 2018
    November 2018
    October 2018
    September 2018
    August 2018
    July 2018
    June 2018
    May 2018
    April 2018
    March 2018
    February 2018
    January 2018
    December 2017
    November 2017
    October 2017
    September 2017
    August 2017
    July 2017
    June 2017
    May 2017
    April 2017
    March 2017
    February 2017
    January 2017
    December 2016
    November 2016
    October 2016
    September 2016
    August 2016
    July 2016
    June 2016
    May 2016
    April 2016
    March 2016
    February 2016
    January 2016
    December 2015
    November 2015
    October 2015
    September 2015
    August 2015
    July 2015
    June 2015
    May 2015
    April 2015
    March 2015
    February 2015
    January 2015
    December 2014
    November 2014
    October 2014
    September 2014
    August 2014
    July 2014
    June 2014
    May 2014
    April 2014
    March 2014
    February 2014
    January 2014
    December 2013
    November 2013
    October 2013
    September 2013
    August 2013
    July 2013

    About

    This website was founded in July 2013.

    RSS Feed

    Categories

    All
    American Football
    Athletics
    Baseball
    Basketball
    Behavioural Economics
    Boxing
    Broadcasting
    Competitive Balance
    Cricket
    Cycling
    Darts
    David Butler
    Declan Jordan
    Drugs
    Ed Valentine
    Epl
    Esports
    Expenditure
    F1
    Fifa World Cup
    Finances
    Funding
    Gaa
    Gaelic Games
    Gambling
    Game Theory
    Gary Burns
    Geography
    Golf
    Greyhound Racing
    Guest Posts
    Horse Racing
    Impact Studies
    John Considine
    John Eakins
    League Of Ireland
    Location
    Media
    Mls
    Mma
    Olympics
    Participation
    Paul O'Sullivan
    Premier League
    Regulation
    Research
    Robbie Butler
    Rugby
    Simpsonomics
    Snooker
    Soccer
    Spatial Analysis
    Sporting Bodies
    Stephen Brosnan
    Swimming
    Taxation
    Teaching
    Technology
    Tennis
    Transfers
    Uefa
    Ufc
    World Cup
    Wwe

Related

The website is not formally affiliated to any institution and all of the entries represent the personal views and opinions of an individual contributor. The website operates on a not-for-profit basis. For this reason we decline all advertisement opportunities. 

Contact

To contact us email sportseconomics2013@gmail.com or find us on Twitter @SportEcon.