The Economics of Sport
  • Sports Economics
  • About
  • Workshop
  • Selected Publications
  • Book Reviews
  • A Primer on Gaelic Games
  • Upcoming Events
  • Media
  • Education
  • Resources & Links
  • Data

Tom Brady and The Importance of Small Decisions

30/9/2019

 
By John Considine
Think of all the people that recruit Tom Brady and the New England Patriots to illustrate their arguments.  A sort of intellectual product endorsement.  This is especially so when it comes to decisions.  Tom is an exemplar.  His decision making under time constraints.  His decision making off the field to ensure his 42 year old body can compete at the highest level.  His decision making about the structure of his contract that enables the Patriots to remain at the top of the NFL.
Picture
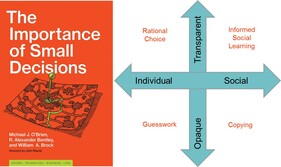
The latter example of Tom's decision making plays a central role in a nice small book called The Importance of Small Decisions (2019).  There is a section in the third chapter titled "Drafting Tom Brady".  There is a discussion of the Scouting Combine and the Wonderlic Test.  There is also a brief discussion of some economics literature on the draft.  Relatively standard stuff.

The discussion of Brady's contract arises in a later section in the same chapter.  The authors are interested in Brady's decision to restructure his deal in 2015 so as to "free up $24 million so it could be used to buy other players".  They use this decision to illustrate one quadrant of their decision making framework.  The authors locate Brady and the Patriots in the top left hand corner of their map.  [This is also the place where they locate economic (wo)man.]  Tom Brady is used to add weight to the argument that they seem to want people to live in the Northwest.

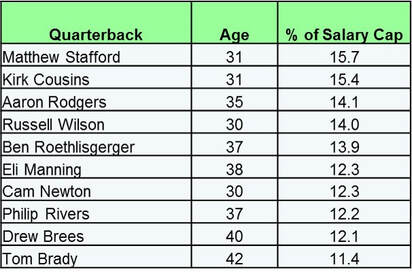
I was reminded of this when watching Sky's coverage of Week 3 of the current NFL season.  The presenter and guests were discussing the percentage of the salary cap taken up by the quarterback.  They divided the quarterbacks into two groups - older and younger quarterbacks.

​When discussing the younger quarterbacks, the year of the draft and the pick was listed.  The key seemed to be the pick number.  Lower pick numbers took up larger shares of the salary cap.  Baker Mayfield (1) was at 4.0% of the salary cap.  Patrick Mahomes (10) gets 2.4% of the salary cap.  Dak Prescott (135) gets only 1.1%.

The older quarterbacks tended to have a larger share of their respective salary caps.  Here we see some evidence of Brady's decision discussed above.  Maybe Tom illustrates the usefulness of the decision making map.  Maybe.

Picture

League Tables, Sponsorship and Reading

27/9/2019

 
By Robbie Butler

On Friday last, we joined a group of academics and industry experts from around the world at the 1st Reading Football Economics Workshop. My paper examined the evolution of the football jersey through time, and was presented just before the keynote address.

The keynote fitted nicely with my work, as Prof. David Forrest (University of Liverpool) spoke about the economics of sport and the gambling industry, and started his presentation with a picture of the Real Mallorca jersey bearing the sponsor "Betfred". 

As the presentation advanced, the audience heard that today 10 Premier League teams (50%) are sponsored by a gambling company. However, none of the Big Six are sponsored by this industry.

The tables below are the league standing, where the club name has been replaced by the sponsor's industry, for 2018/19 (left) and 2019/20 as of the 27th of September 2019. I think they speak for themselves and should be cause for concern for football policymakers and other stakeholders.
Picture

Captains at the Rugby World Cup 2019

25/9/2019

 
By John Eakins

​​While watching the Ireland v Scotland Pool game last Sunday, it occurred to me that the Captain for both teams played in the same position in the team (Hooker or Number 2 - Rory Best for Ireland and Stuart McInally for Scotland). It made me wonder if this was a more common occurrence as I could recall some international captains in the past who also played in that position (Dylan Hartley of England and Sean Fitzpatrick of New Zealand were two that sprung to mind).
 
While admittedly a crude sample to examine, I collected data from the squads of the teams at the Rugby World Cup currently taking place (looking at club teams and/or teams over time would increase the sample size and perhaps give more insights). At least it is contemporary. The following Wikipedia page lists the squad members of each team and indicates the captain of the squad. In addition, information on their position, age and number of caps is also given. Of the 20 Captains at the Rugby World Cup, 10 are positioned in the Back Row (Numbers 6, 7 and 8), 3 at Hooker (Number 2), 3 at Centre (Numbers 12 and 13) and 1 each at Lock (Numbers 4 and 5), Fly Half (Number 10), Wing (Numbers 11 and 14) and Full Back (Number 15)
 
One should be careful with these numbers however as the back row position covers three personnel while the centre covers two and the hooker just one. To adjust for this, we calculate a ratio of the number of captains per players in that position in the squad listed at the Rugby World Cup. The table below presents the figures and shows that even when adjusting for the number of players, the Back row is still the most popular position for a captain in the current Rugby World Cup.
Picture
​The obvious question now is why. An initial reaction might be to say that players in the back row positions touch the ball or are involved in the majority of plays during a game but if that is the case, why are scrum-half’s or fly-half’s not captains more frequently? One thing that we can test using our data is the influence of experience in the form of both the number of caps and age. The table below presents the average age and average number of caps by position. Interestingly no obvious pattern appears to be present with the Back row/Flanker/Number 8 position being one of the lowest rather than one of the highest in both categories. 
Picture
A more sophisticated analysis is perhaps required. The final table present results from two logit regressions which seek to explain the factors which significantly determine the odds of being a captain or not (the dependent variable is a 1, 0 dummy variable). In the first regression we include dummy variables to represent each position on a rugby team. Because some positions are never captains and are perfectly collinear with the dependent variable we ‘lose’ some observations in this specification. The second regression codes the positions as simply forwards (Hooker/Prop/Lock/Back row) and backs (Scrum Half/Fly Half/Centre/Wing/Full Back) in order to circumvent this problem. As can be seen in both regressions, the number of caps is a significant predictor (significant at the 1% level) of the odds of being a captain while position and age are insignificant. In simple terms, once you control for the number of caps, the position on a rugby team doesn’t actually matter in determining the odds of being a captain or not. With a further calculation based on the coefficient estimates, it can be estimated that an extra cap will increase the odds of being a captain by approximately 4.8%.
Picture

Pukki's Productivity

17/9/2019

 
By David Butler

Teemu Pukki has taken the Premier League by storm, winning player of the month for September. Currently he has scored a 6 in 6 matches. This is rare for a promoted striker.

Previously I've looked at GTG ratio's and how they adjust for top scorers for promoted clubs. In the Championship these top scorers typically get 1 goal in every 2 games. On promotion to the Premier League they naturally find it more challenging, on average scoring one goal every five games.

Pukki bucks the trend. Whiie his championship goal scoring was relatively good (0.67) and was only surpassed by the likes of Pierre van Hooijdonk, Glenn Murray and Kevin Phillips, Pukki would still do well to come close to his Championship form.

Andy Carroll was the only promoted striker to maintain his GTG ratio on promotion. This ratio was only 0.45 however. The most impressive is Kevin Phillips who held a championship GTG ratio of 0.76 which only fell by 0.04 upon promotion.

The Finn has a long way to go to match up to Phillips but is definitely on track.

Franchise Expansion and the MLS

17/9/2019

 
By Robbie Butler

Next year, Club Internacional de Fútbol Miami, more commonly known as Inter Miami will join Major League Soccer (MLS) and become the 26th active franchise in North America. The arrival of the Florida based team is well flagged, even within European circles, as it is linked to the 2007 contract that David Beckham signed when agreeing to play for LA Galaxy. MLS is different to European leagues in regards to many aspects, and here is yet another example.

The goal of most sports franchise owners in North America is to maximise profit. While this is advantageous in European leagues, clubs are more often regarded as 'win maximers'. The reason North American sports can focus on profit (as well as winning) is helped by the behaviour of franchise owners, who often manage or directly influence the leagues they compete it. Acting as a monopsony, owners behave in a manner that reduces the power of other stakeholders. e.g. players.

One way this can occurs is through league expansion. Creating a new franchise is no easy task. As North American leagues generally don't facilitate promotion and relegation, successful entry to a league means 'permanent' status. Such entry is then only permitted with the payment of a sizable fee, and full agreement of the current league members.

For evidence of league expansions one need only look at US soccer. By 2022, the MLS should reach 28 franchises. Inter Miami will be joined by Nashville SC next year, Austin FC (2021) and St. Louis (2022). 28 is a good number and a far cry from the original 10-team MLS that started in 1996. However, as the image below shows, it hasn't been all plain sailing.
Picture
​Since the league was inaugurated in 1996, three franchises have gone out of business. Worryingly for Backham and Co., two of these were based in Florida (Tampa Bay and Miami).

The most recent bankruptcy was Chivas USA, which left the MLS in 2014. Sale of the franchise to a group of businessmen, including Cardiff owner Vincent Tan, resulted in the emergence of Los Angeles FC in 2017.

This brings the number of major franchises in LA to 10! (NFL - Rams and Chargers; MLB Dodgers and Angels; NBA - Lakers and Clippers; NHL -Kings and Ducks; MLS - Galaxy). Only New York (11) has more.

One can only guess as to how much more the MLS will expand, but it would seem that 30 to 32 franchises may be the target. This would then put the sport in line with MLB, NBA or NFL. In fact, the current franchise map is starting to look very like the other major sports.

Picture
Picture
On the left, the current locations of the MLS sit reasonably well with the locations of NFL franchises. The return of a second MLS franchise to Florida would appear to make sense. As does the arrival of the first franchises in Missouri and Tennesse. 

The decision to create a 3rd franchise in Texas is a little less obvious but a first for the MLS. No other state will have 3 MLS teams. In fact, the only example of  major US sport with the three NHL franchises in the same city is that of New York - New York Rangers, New York Islanders and Buffalo Sabres.

Slow Play

16/9/2019

 
By John Considine
Picture
After playing with J.B. Holmes during the 2019 British Open, Brooks Koepka articulated his displeasure with his partner’s slow play.  A few weeks later at the Liberty National, Brooks was more proactive but only a little more direct (initially speaking to Bryson DeChambeau’s caddy).  Brooks clearly identified the problem as primarily being associated with individual players.  Recently published research on the time taken on tennis serves finds that the biggest single explanation is the individual player involved.  More of that later.
 
A different perspective on slow play dominates Super Golfonomics by Stephen Shmanske.  The second chapter is called “The Economics of Slow Play”.  The third chapter is called “Golf Course Waiting: The Good, the Bad …”.  The fourth chapter is called “Golf Course Waiting: … and the Ugly”.  Shmanshe is more concerned with how the owner of the golf course can sweat the asset.  This is not surprising as economists tend not to see particular individuals as the primary cause of problems.  Monopolists might be bad for economic performance but it does not matter if the monopolist is called Mr Holmes or Mr DeChambeau.
 
The shot clock is not as obvious a solution in golf as it was in college basketball after the North Carolina and Virginia game of March 1982.  It is the type of solution that economists like.  It is straight forward and easy to apply.  Moreover, it applies equally to all teams.  Given the variety of shots in a round of golf, a shot clock is not as neat a solution in that sport.  Where a shot clock, and an associated time limit, is introduced then there is the issue of the appropriate time limit.
 
Time limits and shot clocks have started to play a greater role in tennis.  Looking at the research presented in a 2019 Journal of Sports Analytics paper one wonders why this is the case.  The paper examines first serves in the 2016 Australian Open – excluding exceptional events and circumstances.  Only 2 out of the 2034 time-rule violations were penalised.  Only 2.  And these were not the worst offenders in terms of time.  Is it the case that umpires do not see time violations as a problem?  Or are they unwilling and/or not capable of implementing the rule?
 
“A closer look at the prevalence of time rule violations and the inter-point time in men’s Grand Slam tennis” shows that physiological and tactical considerations influence the time taken.  The first may be subconscious whereas the latter is deemed to conscious.  But the highest impact on time taken is the identity of the individual player.  The authors note that it is a “well-accepted public perception that some players take more time between points”.  The same can be said of golf.

"Universities Behaving Badly"

13/9/2019

 
By Robbie Butler

As a teenager of the 1990s one of my favourite programmes on television was British comedy Men Behaving Badly. The sitcom followed the lives of two main charters (Gary and Tony) and their attempts to prolong their youth whilst sharing a flat together in London. The show was often highlighted for its political incorrectness and one has to wonder what reaction it might receive if it were aired today for the first time.

As a consequence, I was immediately drawn to a recent paper in the Journal of Sports Economics entitled "Universities Behaving Badly: The Impact of Athletic Malfeasance on Student Quality and Enrollment". The paper explore the relationship between the behaviour of university teams during competitions run by the National Collegiate Athletic Association in men’s basketball and subsequent student enrolment.

For example, it has long been viewed the superior performance in football or basketball at national level could attract more students to one of the 1,268 North American institutions and conferences under NCAA regulation. This paper finds that negative media attention also has an impact - such behaviour "could serve as a signal to prospective students regarding the quality of the institution". In other words, if the behaviour of sports teams does not meet the standards of the institution which they represent, how can we know the quality of teaching doesn't suffer from the same problem?

The paper goes onto say that following the introduction of a ban, as a result of impropriety, student enrolment suffers. However, this is likely short-lived and "rebounds" (no pun intended) once the ban is lifted. There may be a long term reduction in student quality. 

Those representing university teams therefore need to remember exact what they are playing for. ​The privilege to play is more than the opportunity to win. But also to promote one's university to prospective students and past alumni. 

Chess Players, Academic Training & Strategic Thinking

9/9/2019

 
Picture
By David Butler

Last February I had an entry about Magnus Carlsen,  the Norwegian chess grandmaster who (at the time) placed 111th in the fantasy football premier league game.

I went on to talk about a paper by Palacios-Huerta and Volij in 2009 in the AER that considers games of strategy and the process of backward induction. In a series of experiments, they show that chess players, who would be expected to have a superior strategic acumen to laypeople, behave closer to the actions predicted by game theory. Laypeople deviate from equilibrium predictions to a greater extent. 

This year, elite chess players have their own fantasy football league. This league features 13 identifiable chess players, many of whom are Grand Masters. If chess players are superior strategic thinkers would this give an opportunity to test how much of the fantasy football game is down to chance?

In UCC there is also a fantasy football league, many players are academics with a specific training in a particular subject.  A similar question could be asked - would economists, who study strategic decision making and rational choices score better than individuals with an background in other disciplines? The big assumption of course is that participants knowledge of Premier League football is constant. 

The table shows the average scores for game week 4 grouping individuals by their general subject areas. The economists didn’t come out on top last week. Of course, this was just one gameweek. The average score for the chess players in game week four was 61.54, an average that would put them second on this list. 

‘Air’ Jordan still soars above the NBA Rich List

6/9/2019

 
By Stephen Brosnan

Michael Jordan is widely considered the greatest player ever to pick up a basketball. Jordan, and the Chicago Bulls, dominated the sport throughout the 1990’s. The Chicago Bulls won six consecutive NBA titles in the seasons Jordan played between 1990 and 1998 (he took two years out to play professional baseball). Furthermore, Jordan won finals MVP in each of his six appearances.
​
Jordan played his last NBA basketball game for the Washington Wizards on April 16, 2003. Yet, sixteen years later his name still sits atop of the NBA’s Richest Shoe Deals. Table 1 shows the highest ranked players by earnings from shoe sponsorships in 2019.  Jordan made $130 million in 2019 from shoe endorsement deals. This is four times the value of second place Lebron James’ deal with Nike, valued at $32m.
Picture
The rich list contains each of the last twelve winners of the NBA MVP award (James, Durant, Curry, Bryant, Harden, Westbrook, Rose and Antetokounmpo). However, there are some names on the list that may surprise people. The list contains three retired players (Jordan, Kobe Bryant and Dwayne Wade) highlighting the long-lasting effect of star power. Also, the number one overall pick of the 2019 NBA draft Zion Williamson is ranked number 7 on the list, ahead of last season’s MVP Giannis Antetokounmpo, despite having not played a single minute of NBA basketball.
​​
Nike and the Jordan brand still dominate the NBA landscape for shoe deals, accounting for 76% of the sponsorship for top 14 ranked players. Adidas ranks second with 11% of the sponsorship deals followed by Under Armour (6%), and Chinese companies Ni-Ling (4%) and Anta (3%). The popularity of the NBA in the Chinese market has proved very lucrative for many NBA players. For example, newly recruited Brooklyn Net Kevin Durant (3rd) now sells more shoes in China than in North American market.

Pre-season Tours and Attendance

3/9/2019

 
By David Butler

During the later stages of Joshua Robinson and Jonathon Clegg’s book ‘The Club - How the English Premier League Became the Richest, Most Disruptive Force in Sports the authors discuss the growing importance of pre-season tours. The big six now travel to the United States, Dubai, Indonesia, Japan, South Africa and Australia to showcase their brand. These trips are typically outside of Europe and involve tours of 2 to 3 matches or some sort of pre-season tournament such as the International Champions Cup.

Attendance data is available for all of the Big 6 (non-European) preseason friendlies for six recent seasons. I take account of when the big six play each other abroad outside of Europe.

Prior to the 2011 season a combined average attendance for the Big 6 pre-season tour was circa 250,000. This grew to circa 315,00 in 2013 and peaked in 2017-18 at approximately 340,000. Since then it has dropped back down to about 300,000 for the start of this season.

While there appears to be a minimal amount of growth at an aggregate level, this may however have been down to specific countries visited or stadium capacities. 

    Archives

    March 2023
    February 2023
    January 2023
    December 2022
    November 2022
    October 2022
    September 2022
    August 2022
    July 2022
    June 2022
    May 2022
    April 2022
    March 2022
    February 2022
    January 2022
    December 2021
    November 2021
    October 2021
    September 2021
    August 2021
    July 2021
    June 2021
    May 2021
    April 2021
    March 2021
    February 2021
    January 2021
    December 2020
    November 2020
    October 2020
    September 2020
    August 2020
    July 2020
    June 2020
    May 2020
    April 2020
    March 2020
    February 2020
    January 2020
    December 2019
    November 2019
    October 2019
    September 2019
    August 2019
    June 2019
    May 2019
    April 2019
    March 2019
    February 2019
    January 2019
    December 2018
    November 2018
    October 2018
    September 2018
    August 2018
    July 2018
    June 2018
    May 2018
    April 2018
    March 2018
    February 2018
    January 2018
    December 2017
    November 2017
    October 2017
    September 2017
    August 2017
    July 2017
    June 2017
    May 2017
    April 2017
    March 2017
    February 2017
    January 2017
    December 2016
    November 2016
    October 2016
    September 2016
    August 2016
    July 2016
    June 2016
    May 2016
    April 2016
    March 2016
    February 2016
    January 2016
    December 2015
    November 2015
    October 2015
    September 2015
    August 2015
    July 2015
    June 2015
    May 2015
    April 2015
    March 2015
    February 2015
    January 2015
    December 2014
    November 2014
    October 2014
    September 2014
    August 2014
    July 2014
    June 2014
    May 2014
    April 2014
    March 2014
    February 2014
    January 2014
    December 2013
    November 2013
    October 2013
    September 2013
    August 2013
    July 2013

    About

    This website was founded in July 2013.

    RSS Feed

    Categories

    All
    American Football
    Athletics
    Baseball
    Basketball
    Behavioural Economics
    Boxing
    Broadcasting
    Competitive Balance
    Cricket
    Cycling
    Darts
    David Butler
    Declan Jordan
    Drugs
    Ed Valentine
    Epl
    Esports
    Expenditure
    F1
    Fifa World Cup
    Finances
    Funding
    Gaa
    Gaelic Games
    Gambling
    Game Theory
    Gary Burns
    Geography
    Golf
    Greyhound Racing
    Guest Posts
    Horse Racing
    Impact Studies
    John Considine
    John Eakins
    League Of Ireland
    Location
    Media
    Mls
    Mma
    Olympics
    Participation
    Paul O'Sullivan
    Premier League
    Regulation
    Research
    Robbie Butler
    Rugby
    Simpsonomics
    Snooker
    Soccer
    Spatial Analysis
    Sporting Bodies
    Stephen Brosnan
    Swimming
    Taxation
    Teaching
    Technology
    Tennis
    Transfers
    Uefa
    Ufc
    World Cup
    Wwe

Related

The website is not formally affiliated to any institution and all of the entries represent the personal views and opinions of an individual contributor. The website operates on a not-for-profit basis. For this reason we decline all advertisement opportunities. 

Contact

To contact us email sportseconomics2013@gmail.com or find us on Twitter @SportEcon.