We would like to wish all of our readers a happy Christmas and prosperous New Year.
|
We will be taking our usual Christmas break and will return on Monday the 14th of January.
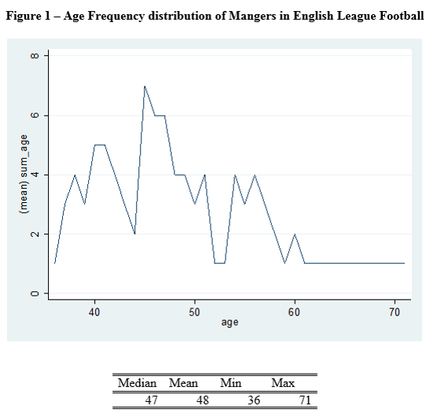
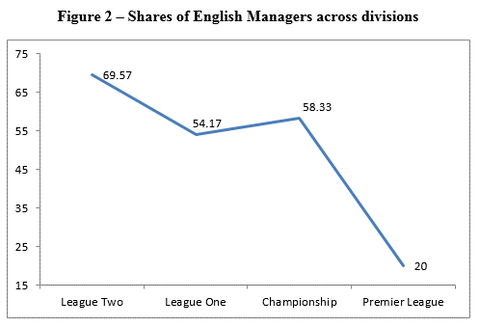
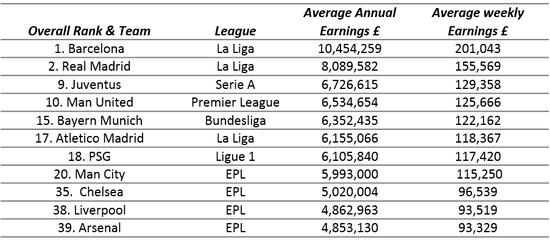
We would like to wish all of our readers a happy Christmas and prosperous New Year. By Sean O'Connor December is generally a hectic month in football in England. With a plethora of fixtures, the month of December can see the final nail driven into many a managerial coffin. With that in mind, this blog will provide some insights into the characteristics of football managers from the Premier League to League Two. To begin we plot the age distribution of English football league managers and compute some summary statistics.  As can be seen from above, the majority of managers in England are to be found in their mid to late forties. There are very few managers in England to be found in sixty plus category. However, where do the majority of managers in England hail from? We examine this below. Probably, not surprising over half of managers in English football are English, followed by Scottish. However, is this trend ubiquitous across the different leagues? Figure 2 plots this. League Two has the largest share of English managers followed by the Championship. Interestingly, but again perhaps not surprisingly, this share drops dramatically in the Premier League, where only 20% of managers are English. A future blog will examine a different European League to see these trends in ages and shares mirror. By Stephen Brosnan In their popular book ‘Soccereconomics’, Simon Kuper and Stefan Szymanski find spending on players’ wages is a better predictor of football clubs league position than net spending on transfers. In this post I explore whether findings from the Global Sports Salaries Survey 2018 support these findings. Table 1 shows the top 11 clubs ranked by average earnings by players. The findings in Table 1 certainly support the findings of Kuper and Szymanski with many of the heavyweights that have dominated European football over the last 20 years featuring. For example, the clubs featured have won 16 of the previous 20 Champions Leagues (and 9 of the last 10). Under fire Manchester United manager Jose Mourinho will be quick to point out he masterminded two of the exceptions, Porto (2004) and Inter Milan (2010) while the AC Milan claimed the other wins in 2003 and 2007.
The Premier League is the most represented league in the top 11 with five teams. The five teams included have won every Premier League since it’s inception in 1992 with the exception of two years (Blackburn 1995 and Leicester 2016). Barcelona and Real Madrid occupy the top two overall spots in the rankings. They are joined by Atletico Madrid who rank 6th (in soccer teams) and 17th overall in terms of average spending on player’s salaries. These teams have dominated the Spanish domestic league, winning every La Liga since 2005. Juventus, the third highest ranked soccer team and ninth team overall, have dominated Serie A over the last decade. The Old Lady has won seven Serie A titles in a row including four consecutive doubles (Serie A and Coppa Italia). In Germany, Bayern Munich have won six Bundesliga titles in a row and 14 of the previous 20. Furthermore, since Qatar Investments purchased PSG in 2011, and made them the richest ( and highest spending) club in France, they have won five of the last seven Ligue 1 titles. By Robbie Butler, On the 14th of November I wrote about the 2018 MLS season, and the rise of Atlanta United. The piece was in the context of competitive balance in Major League Soccer, and the fact that 12 franchises had won the US title, making it more competitive than any major European league over the past 23 years. We can make that 13. Atlanta United were crowned MLS Champions on Saturday evening at around 10pm EST. The remarkable thing about the "The Five Stripes" is that they are playing in just their second season of the Eastern Conference. In total the franchise has played under 80 games in its entire existence, yet is now the number 1 US football team.To put this into context, it is great to compare the closed system in the US, to the oldest set of interconnected leagues in the world in England. It is difficult to know how many tiers there are in England (there could be up to 22) but it is safe to assume that there are at least 8 interconnected divisions. These range from regional leagues at the lower end, to the Premier League at the top, and are list below. Assuming Atlanta United were an English club, and had won promotion in Years 1 and 2 of their existence, the club would be heading into the National League South (given Atlanta's location in the US we will assume South rather than North). From a starting point in this league, it would take a minimum of 6 seasons before the club could even challenge for the Premier League title.
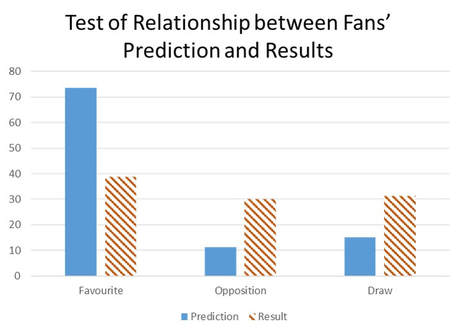
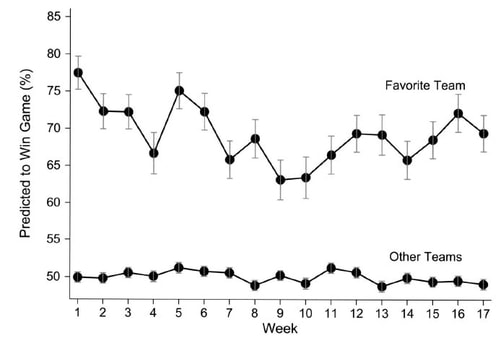
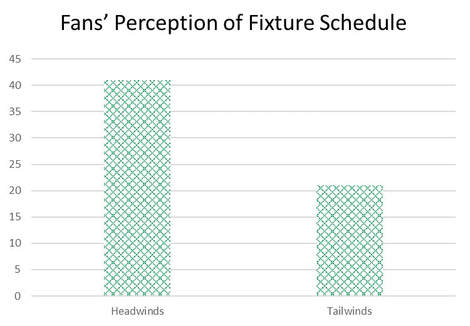
The current dominance of the big six clubs in England's means they have little to fear from the remaining Premier League clubs (Leicester City may obviously disagree), never mind clubs in the lower tiers of English football. The rise of Atalanta United is not something you can expect to be replicated in England anytime soon, if ever. Just another example of how the structure of the same sport on either size of the Atlantic is different, and can result in very different outcomes. By John Considine The Shawshank Redemption seems to feature regularly amongst the favourite movies of sports people. The story of a person overcoming the odds that seem unfairly stacked is the theme of many a sports book (it can even feature in economics books as a previous blog post on this site demonstrated). When it comes to sports betting it seems sports fans also seek to overcome the odds. A recent article in European Sport Management Quarterly warns fans/supporters against betting on their favourite team. The article is written by Sangwon Na, Yiran Su, and Thilo Kunkel. Their bottom line is that fans lose money when betting on their favourite team. Using data from betting on the German Bundesliga the authors test for the extent of fans' "errors" or "biases". One set of their results is reproduced in the picture below. Citing previous literature, the authors note that "highly identified fans exhibit greater bias in their evaluation of their teams than fans with lower team identification". The words "bias" and "evaluation" suggest errors. However, there are other perspectives. One could say that that more committed supporters spend more money on their team in the betting shop. Viewing the bet as a consumption decision rather than an investment decision should be considered. More committed supporters probably also spend more buying replica kit in the club shop. Should we warn supporters against buying replica kit? The title of the article is "Do not bet on your favourite team ...". The literature cited within is impressively broad. Of particular interest are some of the frameworks and concepts more frequently used in psychology and sociology. One of the articles cited examines fans' predictions regarding their team and the remaining 15 NFL teams. The data in this paper by Cade Massey, Joseph Simmons and David Armor did not require the fans to wager their money. Instead prizes were offered for predictions. The predictions from this paper are reproduced in the picture below. It is clear that the fans appreciate that for every winner there is a loser. But there is a clear bias when it comes to their favourite teams. The authors call it optimism. But is it? It is not the case that sports fans always look on the bright side of things. NFL fans may have optimism when it comes to the likelihood of success but they also tend to believe that the odds are stacked against their team. This was illustrated by a 2016 article by Shai Davidai and Thomas Gilovich. Davidai and Gilovich examined the perspective of NFL fans when the schedule for the season was released. How did the fans perceive the schedule for their team? Was the schedule favourable (tailwind) or was it unfavourable (headwind)? Twice as many fans saw the schedule as unfavourable as illustrated in the picture below. The above picture is hardly a representation of optimism. However, it does feed into a narrative of having to overcome the odds to succeed. Fans overestimate both the difficulties of the task and the chances of success. A strange combination. Unless one is constructing a heroic story.
By Stephen Brosnan Last week the latest edition of the Global Sports Salaries Survey (GSSS) was released by Sporting Intelligence (available here). The GSSS provides a breakdown of sports clubs average spending on players’ salaries globally. Table 1 shows the top 10 clubs globally by average annual spend on player’s salaries. It should be noted that these figures are based on basic pay and do not include performance based bonus’, loyalty bonus’ and endorsements.  Table 1 Average Annual Earnings by Team 2018 Table 1 Average Annual Earnings by Team 2018 Table 1 shows the top 10 spenders by players average wages are composed of six basketball teams and four soccer teams. Barcelona have gained the number one spot at the expense of the Oklahoma City Thunder (OKC) who drop to third in terms of average earnings per player. Barcelona have become the first club since the introduction of the GSSS nine years ago to pay their players over £10 million a year on average (£201,043 a week on average). The Catalan club’s wage bill increased this year with the signings of Phillipe Coutinho, Arthur, Malcolm and Arturo Vidal. Also, Leo Messi signed a contract extension which pays the talisman in excess of £50 million per year. The 3rd to 8th positions in Table 1 are held by teams from the NBA. OKC have the highest paid players on average with both Russell Westbrook and Paul George both earning NBA max contracts. In 2017, Westbrook signed a five year $205 million with George signing a four year $137 million contract the following year. The Thunder have slipped in the rankings after releasing ten time NBA All Star Carmelo Anthony from his $28 million a year deal. Last seasons, NBA Champions Golden State Warriors are fourth on the list as a result of the earnings of their four NBA All-stars: Kevin Durant, Steph Curry, Klay Thompson and Draymond Green. In 2017, Steph Curry became the highest paid player in the NBA at the time signing a five-year $201 million contract. Current NBA finals MVP, Kevin Durant has actually taken a pay cut in order to facilitate paying the other stars and back up players. However, three of the Warrior’s star players: Durant, Thompson and Green are on expiring contracts and the team are faced with difficult decision given the NBA’s salary cap will make it impossible the pay the three players the kind of salary they could earn at other teams. The highest climbers in the Top 10 are Juventus who have climbed from 32nd place in 2017 to 9th in 2018. The signing of five time Ballon D’Or winner Cristiano Ronaldo coupled with Douglas Costa and Leonardo Bonucci on big contracts have contributed to the sharp rise in average salaries at the Turin based club. Manchester United are the only Premier League team to feature in the top 10 with average annual salaries of £6.5 million. Manchester City (£5.93 million) are the next highest English club in 20th, with Chelsea (35), Liverpool (38) and Arsenal (39) all appearing in the top 40. By Robbie Butler Yesterday, Liverpool secured a dramatic last minute win in the Merseyside Derby to bring them back to within two points of Manchester City. As a fan of the Reds I was delighted at the end of the game, albeit in highly unusually circumstances. As is commonplace, once the final whistle sounded the league table almost immediately appeared on our screens. Liverpool, highlighted in blue, stood in second on 36 points from 14 games. This got me thinking. Had any team in the Premier League era amassed 11 wins and 3 draws from their first 14, yet still find themselves second!? The answer is no. Thanks to friends in OPTA, the data below can demonstrate just how hot the race for the league is this year. It will be very interesting to calculate competitive balance for the 2018/19 season, come May of next year. The first table demonstrates just how strong the top of the table is this season. Quite remarkably, Manchester City are two points worse off when compared to 2017/18. Newcastle United are a notable inclusion on the list, during the 1995/96 season, and are the only team not to go on and win the league having accumulated 35 points or more from 14 games. This record will have to fall this year, as either City or Liverpool, or maybe both, fail to win the league having reached 36 and 38 points respectively from 14 games. The second table lists the seasons since 1992/93, 19 in total, where Liverpool would be top at this stage. The column on the right shows the number of points clear the Reds would be. On two occasions, they would be 9 points clear. One of these is compared to the Liverpool team of Gerard Houllier. On a further three occasions the Merseyside club would now be 8 points clear at the top. There certainly is a long way to go until next May but the pace that City and Liverpool are setting, and the evidence from past seasons, suggests the Premier League is a sprint more than a marathon. Exciting times lie ahead.
|
Archives
June 2024
About
This website was founded in July 2013. Categories
All
|



 RSS Feed