The Economics of Sport
  • Sports Economics
  • About
  • Workshop
  • Media
  • Selected Publications
  • Book Reviews
  • A Primer on Gaelic Games
  • Upcoming Events
  • Education
  • Resources & Links
  • Data

Attendance in the League of Ireland

28/9/2018

 
By David Butler

Below I provide a picture of League of Ireland (LOI) attendance based on some fresh data for this season. The analysis rests on publically available information, accessible at extratime.ie, and is for an even sample of the first 11 home matches for all LOI Premier Division clubs. Some of the data points for individual match attendances are estimates.

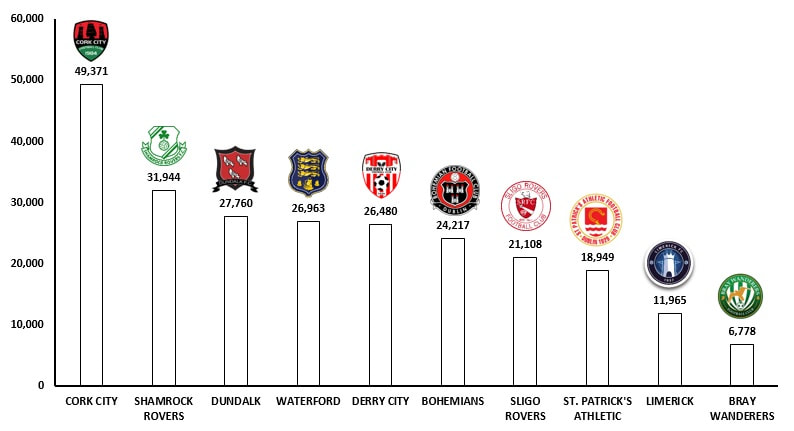
​The average attendance at a Premier Division LOI fixture so far this season is 2,232. The biggest attendance was Cork City vs Dundalk at Turners Cross (6,672). The Munster derby of Cork City vs Waterford FC attracted a similar crowd (6,443). The lowest attendance so far saw 271 supporters turn out to watch Bray Wanderers defeat Sligo Rovers 2-1 on the 8th of July. The chart below shows total attendance for each club after 11 home matches.
Picture
Some interesting points come out in the data.
​
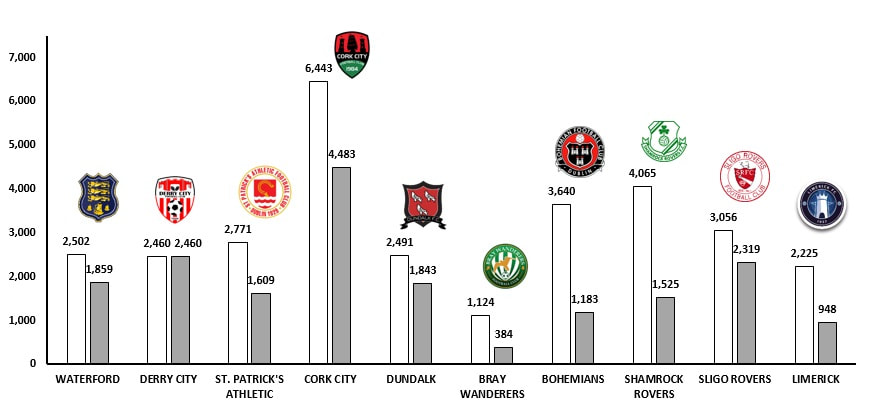
Firstly, the large drop-off between the first and second home fixture, for nearly all LOI clubs, is interesting. A total attendance of 30,777 was achieved when all clubs first home attendances are added up. This falls to 18,613 for all second home fixtures. It seems many casual fans cannot be retained or perhaps the curiosity of a new season is quickly satisfied.

Fixture quality is probably important here but there is a big drop-off after the opening home fixtures (note: some second game fixtures are also on a Monday night which may also have an impact). This is an area clubs could try to target – retaining those first-day fans that may not come back. The chart below details this dip by club (white bars - first home match, grey bars - second home match).
Picture
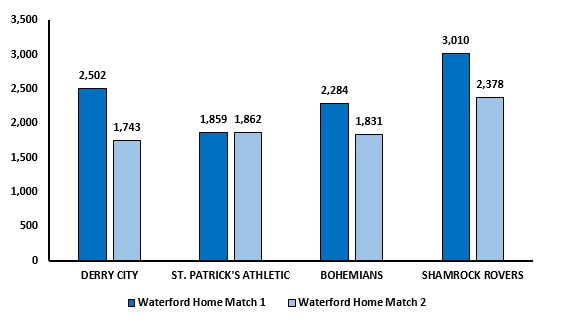
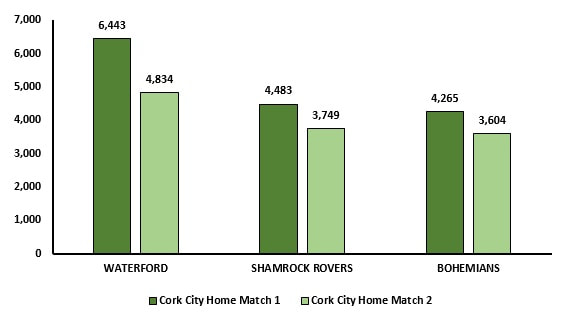
Secondly, I’m interested to see if average attendances fall as the season progresses - my hunch is that LOI supporters can suffer from ‘fixture fatigue’ given the competition design; teams play each other twice at home and twice away. There is perhaps diminishing utility associated with a team coming to town for a second time (and a lower utility associated with heading on the road, to the same place, within a few months for away fans). Playing clubs twice at home also seems to lead to easily forgettable fixtures.

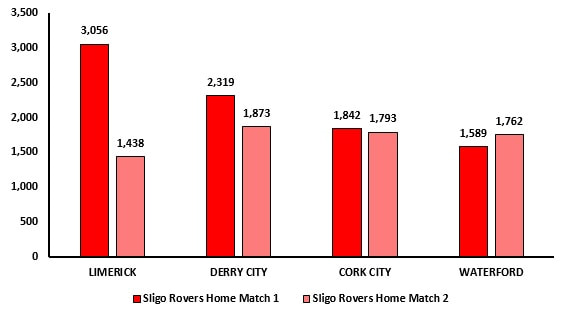
Below is a basic exploration of this idea. I’ve randomly looked at Waterford FC, Cork City and Sligo Rovers. To date, they’ve played several teams twice at home. The data seems to support the view that the second fixture attracts a lower crowd. Perhaps the quality of the second home fixture is diluted? Fans may have already had their fill. Of course, there are many other factors that that can influence the trend (time of the year, weather, match time, competing sporting events, the televised LOI match etc.) but looking at the same fixture twice does, for the most part, control for match quality and uncertainty of outcome. It may not be systematic across clubs either but is probably worth more investigation.

If attendance does suffer for this reason, it might be an inevitable trade-off of a more competitive league; having a competition where teams only play twice would require more, and most likely weaker, teams in the top tier. This could  cause competitive balance issues, especially at individual match level.
Picture
Picture
Picture
​For more on these topics; David Peel and Dennis Thomas had a paper from 1996 on the impact of repeat fixture on attendance in Applied Economic Letters (paywall). For a thorough analysis on the topic of demand for League of Ireland football see Barry Reilly’s ESR article here.

The Use (and Abuse) of Metrics to Measure Performance

27/9/2018

 
By Stephen Brosnan

Recently, I attended the 23rd International Conference on Science, Technology and Innovation indicators. The focus of the conference was to stimulate discussion on comprehensive approaches and indicators in the study of science, technology and innovation. A key debate at the conference was the use of quantitative and qualitative approaches to research evaluations. Typically, there are two approaches in the evaluation of scientific quality: peer review vs metrics. Peer review refers to a process of research assessment based on the use of expert opinion and judgment while metrics refer to a quantifiable measure used to track and assess the status of a specific process.

The use of metrics as a tool for evidence-based decision making has gained traction amongst sports teams, most famously by Billy Beane of the Oakland A’s. The ‘Moneyball’ strategy has been implemented by many sports teams with varying rates of success. Daryl Morey, General Manager of the Houston Rockets, has utilised metrics to assemble the team with the best regular season record in the NBA while Bill Gerrard has provided data analysis for both AZ Alkmaar in soccer and Saracens in rugby.  However, similar to the academic debate, there has been significant push back towards the overreliance on metrics to guide decision making. Charles Barkley, an 11-time NBA All-Star, argues that “analytics is crap” because the NBA is all about talent, that Morey is “one of those idiots”, and that proponents of analytics are "a bunch of guys who ain't never played the game [and] they never got the girls in high school”.

A key issue in the debate is that metrics tend to ‘count what is easily measurable rather than measuring what counts’. The argument is that metrics fail to capture important tacit elements of performance such as hard work, heart and determination. Furthermore, there is an argument that once a measure becomes known it is no longer a useful measure due to ‘gaming’ of the system. This occurred last year when OKC point guard Russell Westbrook was accused of padding his stats to achieve a season average triple-double. In the final regular season game, he needed 16 rebounds to average a triple-double for the second-straight year. Westbrook wound up grabbing 20, a career-high.

Another limitation associated with using metrics to guide evaluations and decision-making is that choosing the right metrics is not easy and the choice of metrics can lead to contrasting recommendations. This issue is evident every time there is a debate surrounding the greatest NBA player of all time. Michael Jordan’s fans point to his 100% record in NBA finals along with his six final MVP awards as reason he is the GOAT. The choice of these metrics paints the narrative that Jordan was the ultimate competitor with a win at all costs mentality and always showed up on the big occasion. However, Karim Abdul Jabbar’s supporters point to the fact he is the NBA leading scorer of all time with the most unstoppable shot ever, the Skyhook while Lebron James fans point to the fact that he is the only player to be top 10 all time in scoring and assists, thus painting the narrative of the perfect teammate that makes everyone better.

Recently, Jerry Muller published a book entitled “Tyranny of the Metrics” which highlights the dangers associated with the quantification of performance metrics in education, medicine, business and finance, government, the police and military. I think it is clear from this piece that sport may also be added to the list. Metrics may be used (and abused) in sport to convey particular narratives and recommendations and should be used as a complement - not a substitute for- judgements based on experience and expertise.

Removing The "Away Goals" Rule

24/9/2018

 
By Robbie Butler,

It was recently reported (see here and here) that UEFA intend to hold a discussion about the future of the "away goals" rule in European club competitions. Introduced in the mid-1960s, the rule is used as a tie-breaker where, in the event a two-legged match remains level, goals scored away from home count double. For example, if Team A and Team B drew 1-1 in the first leg (with Team A at home), and 2-2 in the second leg (with Team B at home), the 3-3 deadlock would be broken by virtue of the fact that Team A's 2 away goals exceeds Team B's single away goal.

Football has changed dramatically since the 1960s, with coaches and managers now suggesting that scoring away from home is not as hard as it once was. The costs associated with travel have collapsed in recent years, while labour mobility has shot up. Once unknown and distance places are much easier to now play in. Those in favour of the move also argue that an unintended consequence of the rule, is actually more defensive play, with teams afraid to concede away goals. Similar rule changes in rugby, to encourage more tries with the use of a bonus point, have had the same perverse effect. 

What does the data suggest? Below are the number of away goals scored in the UEFA Champions League, since the move in 2003/4 to the current competition structure. ​
Picture
The coaches and managers appear to be right. The most recent competition in 2017/18 saw the greatest number of away goals (44). This is six more the the previous record of 38 set during the 2013/14 competition. The trend is also upward, with the three lowest totals since 2003/4 reported in 2006, 2008 and 2012. Just 20 goals were scored away from home during the 2005/6 knock-out stage, less than half of last years' total.

In the months ahead it will be interesting to see what UEFA decide to do. A removal of the rule will allow for a nice comparisons in the years ahead, to see if teams (especially those are home) become more offensive. 

Regional Distribution of FAI International Footballer Awards

21/9/2018

 
By Sean O'Connor

Beginning in 1989, the now annual Football Association of Ireland (FAI) Awards night is a time to celebrate Ireland’s stand-out players across various underage categories. Over its lifespan this ceremony has recognised the achievements of players, both males and female, from U-15 level, all the way up to those who have represented the Republic of Ireland at senior level.

It’s interesting to note the regional distribution of awards over the previous 28 ceremonies. While this post only focuses on the distribution of awards given to males, a future post will examine the distribution of awards for females. In total data is collected for awards given over the last 28 ceremonies, for U-15, U-16, U-17, U-19, U-21, Young Senior International of the Year and Senior International of the Year. As certain awards were not awarded in 1989, a total of 135 separate players of the year awards have been given across the various categories. Figure 1 charts the share of awards by region of birth for those who won player of the year from U-15 to U-21.
Picture
As can be seen, at underage level Dublin dominates the distribution of awards given to players, followed by players born in England. Readers may notice that one African born player on the list. This is Noe Baba, the former Fulham youth player who was awarded U-16 player of the year.
​
The second graph charts the Regional Distribution of players who have won either the Young Senior or Senior Player of the Year award.
Picture
Similar to underage awards we note a strong concentration of Player of the Year awards in Dublin. Although not as pronounced as it is at underage level, we see that over 40% of player of the year awards are given to a player who has been born in Dublin.

Perhaps these findings shouldn’t be all that surprising. For instance, Dublin is Ireland’s most populous region and arguably the area where football is most popular. Therefore, it would be fair to assume that Dublin would have the largest share of awards given out.

However, those of a sceptical nature may look at the distribution of awards and ask a number of questions. Firstly, how are winners of these awards chosen? A search online doesn’t provide any indication but one might assume that it is some kind of committee which chooses the winners of these awards. If this is the case, that a committee or a number of individuals provide input into this selection, it would be interesting to know the regional distribution of these decision makers. For instance, perhaps these decision makers are all based or are from Dublin, hence the large representation of the region in the figures above. Of course, it may just be the case that players born in Dublin are better at Football than others, a theory the Dublin Men and Ladies Gaelic Football teams might agree with.

The Ryder Cup Return?

19/9/2018

 
By Robbie Butler,

While the annual majors in golf are widely anticipated, it is probably this month's biennial event that is most coveted in the sport. On Friday the 28th of September, the Ryder Cup will return to our television screens from Le Golf National, Albatros Course, Saint-Quentin-en-Yvelines, Paris, France.

It is the first time that France has hosted the three-day event, and only the third time in the history of European staged-events that the tournament has left the United Kingdom. The two previous times being Spain (1997) and Ireland (2006). It is to Ireland that I now turn.

There is speculation that the 2026 Ryder Cup could return to Ireland, with Adare Manor a possible location. In terms of major sporting events, the Ryder Cup is on the boundary of what Ireland should be attempting to host. The 2006 event is widely regarded as a success .

While state support is probably necessary, this would be nowhere near the scale required for the 2023 Rugby World Cup, which the island unsuccessfully bid for. The three-day golf tournament would require some capital investment, as well as temporary overlay, but nothing like the government promised support for our most recent mega-event bid. 

The Shannon region is reasonably well equipped at this point in time, and fulfils one of the major European Tour requirements for hosting - a major international airport. The airport is also importantly connected to the US.  Owner of Adare Mannor JP McManus has said it is his "dream" to see Adare Manor host the Ryder Cup.

I for one hope his dream becomes a reality. 

Looking More Closely At Measuring Competition

18/9/2018

 
By John Considine
There are two recently published papers that take a closer look at the way competition is measured in sport.  Both papers suggest we need to look beyond/under the more commonly used measures.  Both papers ask us to think a bit more critically about the measures we use and the comparisons we make.  Both papers are worth reading - particularly for sports economists.

One paper is written by Hayley Jang, Young Hoon Lee and Rodney Fort.  It is published in Economic Inquiry.  They note that "Quite often, competitive balance is measured by some version of the standard deviation of winning percentage or by the behaviour of winning percentage in the tails of its distribution. But again, nearly nothing is known about the distribution of winning percentages in the first place".  They recommend analysis of the basic tests of the form of the distribution.  A neat illustration is presented where they point out that the North American Leagues exhibit negative skew (longer left tail) whereas the European Leagues exhibit positive skew.  Why is this important?  The negative skew in North American Leagues suggests the imbalance is due to the weaker teams whereas in Europe the opposite is the case.  There is some suggestions as to why this might be the case.

This first paper lends further support to the literature showing reduced competitive balance in European Soccer Leagues.  A similar finding appears in the second paper.

The second paper is written by Francisco Triguero Ruiz and Antionio Avila-Cano.  It is published in Applied Economics.  The paper examines various measures of competitive balance and proposes an alternative measure.  This alternative measure allows the calculation from ideal competitive balance in "distance" terms.  As a result, it facilitates comparisons between competitions with different numbers of teams and games.  Section II and III provide some technical comparison on measures.  There is also a nice appendix providing calculations of various measures for the top European leagues for the last two decades.

Ryder Cup Rookies

14/9/2018

 
By David Butler

Over the last few weeks there has been plenty of talk in the media on the Form vs. Experience debate in the build up to the Ryder Cup – this got me thinking about rookie performance in the competition..

The 2018 events features eight rookies. Five are from Europe (Tyrrell Hatton, Tommy Fleetwood, Jon Rahm, Alex Norén and Thorbjørn Olesen) and three are from the U.S (Justin Thomas, Bryson DeChambeau and Tony Finau).
What can be expected of the newcomers? Below are some basic stats and specifics based on the data since 1979.

- In total, 151 rookies have featured in the competition since the 1979 event in West Virginia. 71 are European and 80 are from the U.S. The highest number debuted in 1979 (14 newcomers) and the fewest in 1985 (just 5 newcomers). While there has always been a new face for both sides, four Ryder Cups have seen a Captain choose just one rookie: José Rivero (1985), Ronan Rafferty (1989), David Duval (1999) and Nicolas Colsaerts (2012).

- Larry Nelson’s 1979 Ryder Cup tally of 5 points is still the best ever haul by a rookie since the competition was extended to include continental European golfers, albeit he was given the opportunity to reach this points total. Thomas Pieter’s tally of 4 points is the second best total for a rookie and best European rookie total. In fact, Europe’s 2016 rookie average is masked by Pieter’s excellent performance as other newcomers to the competition such as Danny Willett, Andy Sullivan and Matthew Fitzpatrick all failed to gain even half a point.

- On average the U.S rookies have outperformed the European ones. From 1979 to 2016, the average U.S rookie point total is 1.67 in comparison to 1.33 for the Europeans.

- The last two Ryder Cups have seen leading rookie performances from U.S players. In 2014 Jimmy Walker (2.5), Jordan Spieth (2.5) and Patrick Reed (3.5) put in the best rookie performance on average. The second best was in 2016 by Brooks Koepka (3) and Ryan Moore (2). The third best performance was by the European rookies in 1987: Gordon Brand, Jnr (1.5) and José María Olazábal (3).

Although the U.S didn’t win in Gleneagles in 2014, their rookies haven’t left them down over the past two competitions. The pressure will be on Justin Thomas, Bryson DeChambeau and Tony Finau to keep this going. For the Europeans, the five rookies will have to avoid drawing blanks like last time out when three players failed to even get a half point. This also happened in 99 when Sandelin, van de Velde and Coltart all failed to get on the scoreboard. 
Picture

Satisfaction with sports facilities in Dublin

12/9/2018

 
By John Eakins

Eurostat, which is the official statistical agency of the European Union, provides a wealth of information relating to the economic, social and general activities and conditions of European countries. It has also begun to focus on collecting more statistical information relating to sports activities, which the organisation themselves state is due “to its growing impact on Europe's economy and society”. The web page of which of Eurostat’s sports statistics can be accessed here.

In perusing the various web pages I came across an interesting recent survey carried out by Eurostat. They asked inhabitants of a number of European cities to state their degree of satisfaction with the city’s sports facilities. The actual question was as follows: “Generally speaking, please tell me if you are very satisfied, rather satisfied, rather unsatisfied, or not at all satisfied with the sports facilities in your city, such as sport fields and indoor sport halls?" The survey was carried out in 2015 and the full results can be accessed online here.

What is interesting is that Dublin (the only Rep. of Ire city in the survey) fairs very well in comparison to other European cities. The figure below shows the level of satisfaction with sports facilities in EU capital cities as a percentage of the resident population. Dublin lies joint 4th with Prague and is only behind Luxembourg, Helsinki and Amsterdam. If we just look at the ‘very satisfied’ percentages Dublin lies 3rd overall. It is therefore ahead of the likes of London, Paris and Berlin, cities which have hosted or are due to host events such as the Olympics and the Football World Cup.
Picture
The figure below looks specifically at UK and Ireland cities and also provides data from previous surveys which have asked the same question (data can be accessed here). Cardiff (76% very or rather satisfied) just edges ahead of Dublin and Glasgow in joint 2nd (75% each) using the recent 2015 survey. But over time, Dublin had experienced greater increases in the level of satisfaction relative to the other UK cities. It is hard to know what is driving the large increase between 2006 and 2009 in particular. Perhaps it is a positive hangover from the extensive construction work done during the Celtic tiger. The new Aviva stadium for example was redeveloped between 2007 and 2010.
Picture
Obviously the subjective nature of the survey is a strong limitation and if one where to objectively count the number and quality of the facilities, Dublin might be expected to be lower in relative terms than many other European cities. I also wonder if the inhabitants of Dublin had much more information about the number and quality of the facilities in other cities, would they still rate their own facilities as high (the same would obviously go for the inhabitants of other cities as well). Still, it is interesting to see a survey which presents a relatively positive view of sport facilities in Ireland.

Iniesta, Eriksen, Falcao and Smolov

10/9/2018

 
By Robbie Butler,

What do Andrea Iniesta, Christen Eriksen, Radamel Falcao and Fyodor Smolov all have in common?

The answer is that each took the opening penalty kick in one of the four shootouts at the 2018 FIFA World Cup in Russia. What is more interesting is that all four ended on the losing side. For those familiar with penalty shootouts, and recent rule changes, it should come as a surprise that the team kicking first lost on all four occasions.

Why?

Last October, I wrote about rules changes that have been initiated by some football associations, including the Football Association (FA), altering the structure of the penalty shootout. The traditional ABAB sequence (where team A shoots first, followed by Team B, back to Team A, and so on) has been replaced by ABBAA system.The need for this change was highlighted by a 2010 paper in the American Economic Review by Jose Apesteguia and Ignacio Palacios-Huerta called Psychological Pressure in Competitive Environments: Evidence from a Randomized Natural Experiment.

The authors demonstrate that the team kicking first, had a persistent and statistically significant advantage, winning roughly 60% of the time. The 2018 World Cup goes against these findings. Our course, with a sample size of just 4 this is entirely possible. The 60/40 split from the 2010 study is based on  a data-set comprising 1,343 penalty kicks from 129 penalty shoot-outs over the period from 1970 to 2003. 

It begs the question however, if the sample was increased or decreased how would the results change? If we had data on 5,000 shootouts would a statistically significant result prevail? 

LOI Clubs in the Europa League

7/9/2018

 
 By David Butler
​
This post is a follow up to an entry on League of Ireland (LOI) clubs in the Champions League. Here, I look at the UEFA Cup/Europa League performances since 2003. Various competition changes to the qualification process have been enacted over this time so again I've tried to simplify the structure down to make it amenable to analysis. 

Since 2003 most LOI clubs have not encountered too much difficulty in the first qualification stage. St Patricks Athletic have progressed the most. On my count, 21 LOI clubs have progressed from 36 fixtures. 

​The second phase is often a stumbling block. Since 2003 only 8 out of 25 clubs have progressed. In 14/15 all three first round entrants reached the second round of qualification, but all were defeated. Recently, AEK Larnaca put pay to both Cork City and Dundalk, with neither club scoring a goal over the two legs. The table shows the results from round two qualification fixtures.
Picture
The LOI record for the teams entering the third qualifying/playoff phases is generally weak, save Shamrock Rover's memorable performances. In most ties the LOI club was defeated, typically because they were coming up against a far superior opponent such as PSG, Hertha BSC or Juventus to name but a few. Goals are few and far between here and in ten away legs no goals were scored by the LOI club

In 2016, Dundalk were guaranteed a place in the group stage of the competition, by the virtue of reaching the play-off round of the Champions League. They really improved on Shamrock Rovers 11/12 group stage performances, collecting 4 points. 
Picture
<<Previous

    Archives

    June 2022
    May 2022
    April 2022
    March 2022
    February 2022
    January 2022
    December 2021
    November 2021
    October 2021
    September 2021
    August 2021
    July 2021
    June 2021
    May 2021
    April 2021
    March 2021
    February 2021
    January 2021
    December 2020
    November 2020
    October 2020
    September 2020
    August 2020
    July 2020
    June 2020
    May 2020
    April 2020
    March 2020
    February 2020
    January 2020
    December 2019
    November 2019
    October 2019
    September 2019
    August 2019
    June 2019
    May 2019
    April 2019
    March 2019
    February 2019
    January 2019
    December 2018
    November 2018
    October 2018
    September 2018
    August 2018
    July 2018
    June 2018
    May 2018
    April 2018
    March 2018
    February 2018
    January 2018
    December 2017
    November 2017
    October 2017
    September 2017
    August 2017
    July 2017
    June 2017
    May 2017
    April 2017
    March 2017
    February 2017
    January 2017
    December 2016
    November 2016
    October 2016
    September 2016
    August 2016
    July 2016
    June 2016
    May 2016
    April 2016
    March 2016
    February 2016
    January 2016
    December 2015
    November 2015
    October 2015
    September 2015
    August 2015
    July 2015
    June 2015
    May 2015
    April 2015
    March 2015
    February 2015
    January 2015
    December 2014
    November 2014
    October 2014
    September 2014
    August 2014
    July 2014
    June 2014
    May 2014
    April 2014
    March 2014
    February 2014
    January 2014
    December 2013
    November 2013
    October 2013
    September 2013
    August 2013
    July 2013

    About

    This website was founded in July 2013.

    RSS Feed

    Categories

    All
    American Football
    Athletics
    Baseball
    Basketball
    Behavioural Economics
    Boxing
    Broadcasting
    Competitive Balance
    Cricket
    Cycling
    Darts
    David Butler
    Declan Jordan
    Drugs
    Ed Valentine
    Epl
    Expenditure
    F1
    Fifa World Cup
    Finances
    Funding
    Gaa
    Gaelic Games
    Gambling
    Game Theory
    Gary Burns
    Geography
    Golf
    Greyhound Racing
    Guest Posts
    Horse Racing
    Impact Studies
    John Considine
    John Eakins
    League Of Ireland
    Location
    Media
    Mls
    Mma
    Olympics
    Participation
    Paul O'Sullivan
    Premier League
    Regulation
    Research
    Robbie Butler
    Rugby
    Simpsonomics
    Snooker
    Soccer
    Spatial Analysis
    Sporting Bodies
    Stephen Brosnan
    Swimming
    Taxation
    Teaching
    Technology
    Tennis
    Transfers
    Uefa
    Ufc
    World Cup
    Wwe

Related

The website is not formally affiliated to any institution and all of the entries represent the personal views and opinions of an individual contributor. The website operates on a not-for-profit basis. For this reason we decline all advertisement opportunities. 

Contact

To contact us email sportseconomics2013@gmail.com or find us on Twitter @SportEcon.