The Economics of Sport
  • Sports Economics
  • About
  • Workshop
  • Selected Publications
  • Book Reviews
  • A Primer on Gaelic Games
  • Upcoming Events
  • Media
  • Education
  • Resources & Links
  • Data

The Pareto Distribution in Sport

30/11/2015

 
PictureThe Pareto Distribution
By David Butler

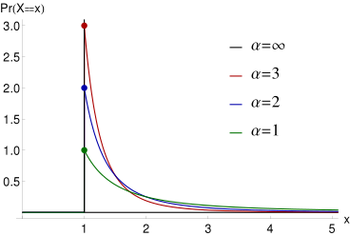
The Pareto distribution is quite famous in Economics and is named after the Italian polymath Vilfredo Pareto (1848-1923). Mathematically,  the distribution is referred to as a power law probability distribution (see graph) and it is applicable to phenomena in both the natural and social sciences.

The distribution has its origins in the income data Pareto  published in 1897 when he explored how wealth across society was allocated. Pareto found that the income distribution was not a bell shaped curve. There was many people at the bottom end of the wealth distribution, a wide middle class and some super wealthy individuals. His distribution is usually explained through the 80-20 rule of thumb.  80% of the wealth is usually owned by 20% of the people. This is usually a good approximation.

A fun and accessible way to  learn about the Pareto (and Pareto-like) distribution is through sports data.

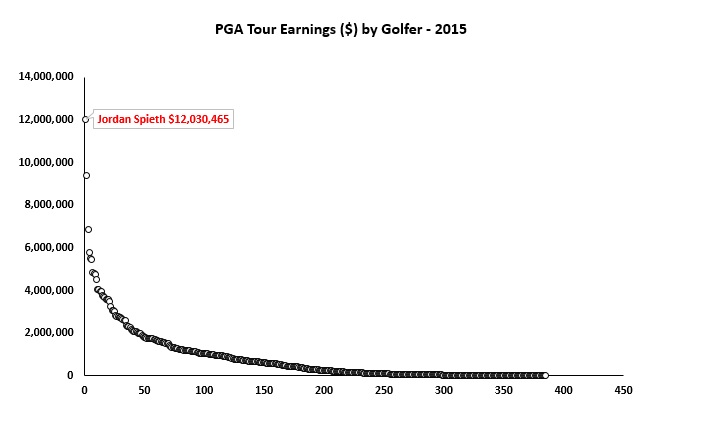
The graph below shows the PGA Tour Earnings for Golfers in 2015. Out of the 385 golfers on the tour Jordan Spieth has the highest earnings.  Like Spieth, there are a few very high earners but these are in the minority (e.g. Jason Day, Bubba Watson, Rickie Fowler, Dustin Johnson, Justin Rose and Rory McIlroy). There are some golfers earning a reasonable sum, the middle-class,  and then a glut of lower earners. The top 20% (77 Golfers) earned $218,010,501 together, that’s 68% of the total earnings. The remaining 80% (308) golfers divided the remaining $101,434,093 between them.

Picture
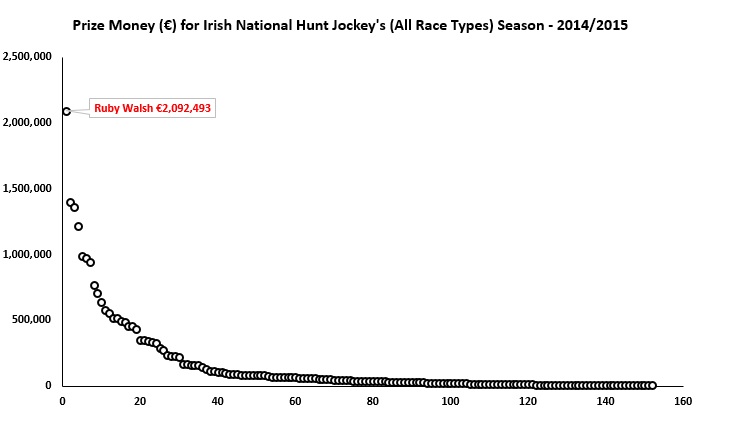
What about a different sport? The second graph shows the prize money earned by Irish National Hunt Jockey's (all race types) for the 2014-2015 season. While the earnings are far less than in golf, we still see a similar pattern. Ruby Walsh tops the list out of 152 jockeys. Bryan Cooper, Jonathon Burke,  Paul Townend and  Paul Carberry all perform very well too.  The top 20% (30) of the jockeys shared €18,785,125 between them. That’s 78% of the pie.  This left only €5,211,170 worth of earnings for the other 122 jockeys.
Picture
Of course, the more interesting question is why do such patterns emerge? The answer to this question has puzzled social scientists for years and is far too complex to address in detail here. To hazard a guess, these outcomes are not unicausal; no exclusive factor is probably causing the outcomes above. Albeit somewhat of a weasel word, the skewed distributions are often referred to as an ‘emergent property' of a system. Small, random differences at the start can amplify themselves and lead to significant differences down the road.

Geographical Spread of Sporting Success in Ireland - A first look

27/11/2015

0 Comments

 
by Declan Jordan
My research interests of regional and sports economics probably mean I am very drawn to locational or spatial factors affecting sports performance. There is a very large literature on the effects of location on the performance of businesses, whether measured by innovation, productivity or profitability. As far back as 1890, Alfred Marshall recognised the tendency for economic activity to concentrate spatially - driven, he suggested, by external benefits to concentration (now referred to as localisation economies) including knowledge spillovers, availability of skilled labour, and access to specialised inputs. Michael Porter argued in 1998 that "paradoxically, the enduring competitive advantages in a global economy lie increasingly in local things". Recently I have done some work on this spatial aspect of performance, such as here. 

This area is a potentially very interesting one for sports economics and regional science, as the special features of sports leagues and competition and the availability of data make it possible to get at important spatial effects.

An obvious feature of sports is the importance of different sports across locations. Of course some of this may be obvious, where winter sports are perhaps more likely to be popular in colder locations. However, are there significant differences in success rates spatially, and can these be attributed to local features? Ireland may be an interesting case here, since the country is so small it is difficult to see why sports may be consistently successful on a regional or spatial basis.

I have just begun to look at the data for Ireland, but the table below is an interesting starting point. It shows the location of the winners of the League of Ireland (football), All-Ireland Gaelic Football championship, All-Ireland Hurling championship and All-Ireland rugby league since 1980 categorised by NUTS3 region. There are, of course, some data issues. NUTS3 classification has not been in place since 1980, there have been winners of each title (with the exception of hurling) from Northern Ireland in that period [these have been excluded], and the rugby league has only been in place since 1992. I have chosen 1980 because it allows me to include a football winner from the Mid-West - my own club Limerick who last won it back then.

Some counties do not have a senior hurling team or a team playing in the League of Ireland or at senior club level in rugby. However, there is nothing to prevent a team from any county participating and progressing in each of these sports, and the failure to have a team at those levels may indicate the lack of popularity of those sports in that county and/or the dominance of another sport there. (A difficulty also arises for the separation of Tipperary into two NUTS regions, while they compete as one county in gaelic games. Tipperary championship wins have been split 50:50 between the Mid-West and South-East regions - which explains why there are "half-wins" in hurling).
Picture
The table shows the number and proportion of winners by region. It is noticeable that for each sport there is a region that has won over half of the titles. Also, the most successful region is different for each sport. In some regions the success is driven by one county (such as Kilkenny in hurling in the South-East or Kerry in Gaelic football in the South-West).

It is clear that even in a small country like Ireland location matters for success in particular sports. There are some possible explanations, such as a type of demonstration effect where athletes in a county/region are drawn to the success of a particular sport in that area. This means history matters and there is an element of cumulative causation. This could also occur in relation to attracting funding and sponsorship. Perhaps there are strong clubs at the level under these elite championships that generate stronger competition and better players and teams at the elite level.

These are all interesting potential explanations and the research agenda for spatial analysis of sports performance in a fascinating future research area.
0 Comments

More Euros But Less World Cups

25/11/2015

 
Picture1-8 represent World Cups 1986 to 2014 and Euros 1988 to 2016
By Robbie Butler

I'm lucky enough to be able to recall Ireland’s first win at a major football competition in June 1988. Ray Houghton’s header that day in Stuttgart was enough to see off England and gave Ireland its first taste of success at a major tournament. Despite a credible display in the remaining two games, the Republic of Ireland had to wait another twenty-four years before appearing at the European Championships again. In the intervening period the country appeared at three World Cup Finals (1990, 1994 and 2002).

Is there is reason for this? The answer is probably yes.

Historically, World Cups have been easier for UEFA member nations to qualify for. In 1986 and 1990 more than 40% of UEFA members qualified for the finals. Between 1994 and 2002, 14 UEFA members qualified for the World Cup Finals. Since 2006 this has been reduced to 13. While the number of places has fallen by just one in recent competitions, the number of UEFA members has nearly doubled in size since 1986.  The opposite has happened with the Euros.

For me, Ireland’s qualification for Euro ’88 is still the country’s greatest achievement. Only 8 countries travelled to Germany that summer. France, Portugal, Sweden, Poland, Romania, Greece, Turkey, and many more missed out on those finals.  The Euro 1992 Finals were an even harder competition to get to, with less than a quarter of the teams entering the initial stage qualifying. Since then the competition has expanded, with 16 teams at the finals from 1996 to 2012. Next year’s expansion will mean nearly half of the countries that entered the qualifying round will appear at the finals.

The World Cup has become much harder to reach for European teams, and the Euros much easier (see graph).

An even better illustration of is provided by Wikipedia pages for the European Championships. The maps below are taken from the website and show the qualifying countries in blue (sometimes light blue) against those that did not qualify (red, orange, and yellow). Compare the blue in the Euro ’88 map with the blue of Euro ’16.

Next summer, you'll be able to drive from the Algarve to Moscow and never leave a country that has reached the finals in France!

Picture

Ronald Koeman & Moral Hazard

23/11/2015

0 Comments

 
By David Butler

Last week the Southampton manager Ronald Koeman expressed his unhappiness with Martin O’Neill’s decision to use Shane Long in Ireland’s second leg play-off win against Bosnia.  Koeman was “very surprised he played 40 minutes. The player didn't train for five or six weeks, [and] had only one training session on the Sunday”.

Such instances are becoming increasingly common in modern football where a tension exists between parent clubs and home countries.  This outcome of the problem is often moral hazard. This is some form of after the fact opportunism; you take on an amount of risk while someone else pays the costs if things go wrong. For example, you may be more likely to drive your car dangerously or live an unhealthy lifestyle if you have car and life insurance respectively. 

While Ireland and Southampton have no formal contractual agreement, Southampton are paying the wages of Shane Long on a weekly basis and it is, of course, in their interest to have a fit performer for the entire Premier League season. Ireland however faced a crucial match where short term success was in their interest. Southampton gave advice to Martin O'Neill but ultimately Ronald Koeman had no decision making power – Ireland were deciding on how much risk to take on, Southampton were carrying the costs if things went badly!

Economists are often interested in designing contracts to ensure that efficient risk bearing occurs between two parties stuck in dilemmas like these. It will be interesting to see whether such mechanisms arrive in football in due course or whether a club will legally challenge an international association if their asset returns as damaged goods from international duty. Should clubs be compensated when an international manager decides to outsource the costs?

As a fan it was great to see Shane Long play for Ireland last week, as an economist I think some of the risk needs to be shifted to international associations.
0 Comments

Am I right here Michael, am I right?

21/11/2015

 
By John Considine
I'm gutted.  My hopes are dashed.  Here I was thinking that things had changed when it came to sports capital grant allocations.  In previous posts I was starting to sing the praises of Michael Ring (here).  I even saw documents from the Department of Transport, Tourism and Sport (DTTS) that said Leo Varadkar agreed with Michael Ring that they should use "the Considine rule".

Then I saw another document on the DTTS website (here).  One with two grant allocation.  Both to Mayo.  And one of these for just under €4m.  It must be a mistake.  Song titles spring to mind.  "Say it isn't so" (Hall & Oates).  Or Percy French's "Are you right there Michael?".  Even Bonnie Tyler's "I need a hero".

I took the nine documents on the DTTS website for the period since 2012.  Below is the per person allocation by county I calculated.  There must be a mistake.  Am I right here Michael, am I right?  Say it isn't so!  Where have all the good men gone?
Picture

Doping - The Importance of Credibility

20/11/2015

 
By John Considine
Those Irish people watching the equestrian events at the 2004 Olympics were delighted when Cian O'Connor, and his horse Waterford Crystal, won a gold medal.  An equestrian medal may be more widely celebrated in Ireland because horses have a special place in Irish sport.  Unfortunately, the medal was eventually lost due to a breach of anti-doping regulations (the series of events surrounding the testing were far more intriguing than those currently surrounding FIFA of IAAF).  When news first broke of the potential doping, it seemed to confirm, at least to some, that the Irish competitors were no different to others when it came to performance enhancing drugs.

Eight years before the efforts of O'Connor and Waterford Crystal, Michelle Smith brought home to Ireland a collection of 3 gold medals and a bronze medal from her efforts in the swimming pool.  The feat remains one of the more impressive in Olympic history.  A couple of years later, Smith was landed in a controversy involving the tampering with a urine sample.  This was the context in which the news of Waterford Crystal's failed drug test arrived.

The hope is that the darker doping days are behind Irish sport.  However, Irish sport competitors continue to fall foul of the tests.  Only last month the Irish Independent reported on a failed test for a League Of Ireland soccer player (here).  A few months earlier, it was reported that a gaelic footballer failed a drugs test (here).  In September, a slightly humorous story appeared where an Irish trainer was fined over a substance found in a horse's bedding (here).  And, it is just over a year since an Irish horse trainer was banned over having a prohibited substance (here).  Despite these setbacks there does seem to be a rigorous system of testing in Ireland driven by the Irish Sport Council (see 2013 test numbers below).  Partly as a result of this system, there was never going to be an issue over Katie Taylor's gold from London 2012.  It is crucial that there is confidence in this system for Irish sport.

One of the more damaging elements of the recent controversies involving FIFA and IAAF is the way they undermine our confidence in those charged with running a sport.  It means we are likely to dismiss good news stories and impressive performance.  Earlier this year, the Minister for Agriculture reported that only 2 out of 3,085 tests on horses in 2014 revealed positive tests for prohibited substances (here).  Surely a good news story.  However, if people stop having confidence in the governing bodies of sport then will the test results be interpreted perversely.  Then a failure rate of 2 out of 3,085 could be used as lacking credibility.  Will they then point to the dramatic rise in the number of Irish winners at Cheltenham (here)? And so forth.

It is critical that there is confidence in the governing body of a sport and those charged with testing for illegal drug use.  This credibility will come from how they conduct their business because there is little oversight.  According to a Roger Pielke, writing in the Financial Times, the World Anti-Doping Agency offer little by way of guidance of how to deal with problematic sporting bodies or nations (here).  Pielke points out that the WADA code, "has 5,300 words about how to punish athletes who transgress, but only 47 words on penalties for sports bodies and nothing at all on nations that break the rules".  In this sort of context, how confidence can we be that Russia will clean up its act?  Not much, if you were to read Matthew Syed's work in either Bounce or in The Times.  Ireland is no Russia but there are no grounds for complacency.
Picture

Age Is Just A Number

20/11/2015

 
Picture
By Ed Valentine

Vienna is not entirely typical of the sort of location a group of lads in their early 20s would choose to go for a few nights in the summer. Ajax, a team of young, inexperienced players contested the 1995 Champions League against the much older, sturdier and robust AC Milan. Despite losing twice to Ajax in the group stage the Rossoneri were of course going to win as the media at the time had constantly admonished that “experience counts for everything”. After 85 minutes of play a 19 year old Patrick Kluivert scored the game’s only goal and Louis Van Gaal’s men left The Earnst Happel Stadion with the Champions League trophy.

Though Kluivert was only 19 years old he was very much part of the furniture having signed with Ajax aged 8. Their squad that day contained 13 home grown players and the average age of the entire 16 man squad at recruitment was just about 17. With a group of nascent and unheard of players, some earning as little as £500 a week, the club had won Europe’s greatest prize with only two players over 25. Only Real Madrid in 2000 can claim to have won the trophy with as young a squad though the Ajax starting 11 had been with the club for an average of 8 years – a surely never to be repeated feat.

Johnny Giles was commentating on the game for RTE and quipped that Marco Simone, who was wearing all white boots with the all-white kit, “looks like he has just made his 1st Communion tonight”. Some of the Ajax players that night were young enough to probably still have their communion money.

Picture
Football has changed a lot since the standard definition days of the 1990s though analysing the data from this season (data based on the top 31 European Leagues) more closely we can see that Ajax are still true to their philosophy of producing young players who make it in 1st tier championships. The Amsterdam club however have not made it past the group stage of the Champions League since the 2005-06 season.

The table clearly demonstrates how the landscape for player recruitment has fundamentally changed. Many of the teams are from Eastern Europe and in some cases export 8 times as many of their cadets as they have playing in their own team.

In Eastern Europe a team can expect to give a debut* to about 1.43 players per team per season. In the top 5 leagues this figure is .68 debuts* (based on ave values over previous 3 seasons). It would appear that the major clubs are less willing to take a risk on new, unproven talent. So it would seem the days of younger squads lifting Europe’s elite prize mainly with players trained in house will be unlikely to happen again - unless Dinamo Minsk can mount a challenge.

* Debut refers to a players 1st ever professional appearance in a senior team as opposed to their 1st match for a new club
** Previous work on player age and recruitment can be read here

Chelsea's Fall From Grace

18/11/2015

 
By David Butler

On the 29th of March 2013 I wrote about Manchester United's fall from grace under David Moyes. The article concerned how teams faired the season after winning the Premier League title. For the most part, teams that win the title offer a strong challenge the following season too, often retaining the trophy.

Given Chelsea’s current plight I thought it was pertinent to resurrect this idea. Only twice was a Premier League winner outside of the top three teams the season after winning the league; Blackburn Rovers were 7th in the 1995-96 season after topping the pile the year before and Man United’s infamous 2013-14 season under David Moyes saw them finish 7th.

Winning the league usually doesn't just have repercussions for the successful season only. GIven that the human capital on the field typically changes minimally, the champions often come back to win the league or are runners up the season after too.

The table below looks at the same pattern for La Liga and the Bundesliga.
Picture
The lowest position a champion has finished the following season in La Liga was 7th (Valencia 2004-2005) while Werder Bremen (1993-1994) and Wolfsburg (2009-2010) both finished 8th the year after being crowned champions. While approximately 80% of champions in the EPL have returned to win the league or finish runner up the the next season, this rate is lower for La Liga (60%)  and Bundesliga champions (50%).

Something has definitely gone wrong for Mr. Mourinho. In my view Chelsea's fall is a product of many factors coming together: underperforming or burned-out stars, the sale of key personalities in the summer,  aging defenders, transfer failures (not securing the signing of John Stones), fielding young talent that may not  be quite ready, public relation disasters with staff and injuries to key players (such as Costa and Courtois) have all contributed to the 'crisis' .  While the stats would indicate that the champions may well bounce back from 16th, could Chelsea manage to finish worse than 7th?
Picture

The Silent Invasion?

16/11/2015

 
By Robbie Butler

Last year I wrote about the increased incidence of English trained horses running in big races at Dundalk. The trend continues.

Two of the biggest races of the year at the County Louth venue were run on the 23rd of October and 30th of Ocotber. Prize money on offer for both races was worth a combined €62,250. The first race resulted in an English trained 1-2-3. The second an English winner trained by Sir Mark Prescott. 

Why are horse travelling, in what many might see, as the opposite direction across the Irish Sea? It's simply down to prize money. The best paying races in England on both days fell well short of what is on offer in Dundalk. Despite incurring travel costs coming to Ireland, the potential rewards far outweigh those on offer at Wolverhampton, where all-weather racing happens on the same day. Six of the seven races on the card at the English track offer total prize money of less than £3,000. 

The Horse Racing Ireland 2014 Factbook (an excellent read) illustrates that nearly 2/3 of all prize money in 2014 was provided by the governing body. Investment in prizes will no doubt attract international competitors, as Dundalk so aptly illustrates, but the problem is that this money can then leave the country. A great spectacle for race fans but at a cost.   

A History Of The UEFA Play-Offs

13/11/2015

0 Comments

 
PictureTable includes the upcoming play-off matches but does not include the match at Anfield in 1995 or the 1966 World Cup play-off.
By Robbie Butler

​With Ireland’s crucial Euro 2016 play-off first leg with Bosnia & Herzegovina tonight, I thought it timely to have a closer look at some of the data behind UEFA play-off matches.

If any nation can claim to be more at home with the concept of the play-off, surely that's Ireland. Fifty years ago, the country’s place at the 1966 World Cup in England was decided by a play-off in Paris against Spain (we lost). Fast-forward thirty years and Jack Charlton’s legendary reign as Irish manager comes to an end following a play-off defeat to the Netherlands at Anfield in November 1995. Twenty years on again and the country faces it eighth opponent! 

The concept of the play-off has changed since the early days and now involves two-legged ties, home and away for both teams. This format started when deciding UEFA qualification to the 1998 World Cup in France. Since then, thirty-seven play-offs have taken place involving UEFA members, including Ireland’s famous UEFA/AFC Intercontinental play-off win over Iran in 2001 and the four ties this weekend. Thirty-three UEFA members have been involved in play-off matches since that time. The list includes Spain, Italy, Germany, France and England. No prizes for guessing who tops the number of matches played. (Republic of Ireland finally top a league table). 

What can we learn from past matches?

Home or Away First?
There is a belief that playing at home in the second leg increases the chances of qualification. The Republic of Ireland experience this for just the second time. The only other time the country played at home second was when beating Estonia 5-1 on aggregate. It seemed to work then, although qualification for World Cup 2002 was secured playing at home first against Iran, followed by an away leg in Teheran. Is this scenario replicated across other play-offs?

No. The current score is 16 – 17. Sixteen countries have qualified for European Champions and World Cups having to play the second leg of their play-off tie away from home.

Seeded or non-seeded?
Seeding has been used since the 2006 World Cup play-off matches and has been used for all play-offs since. The seeded teams do have a better chance of qualifying.

Fifteen ties have involved seeding. Eleven times the seeded team has qualified. Only Switzerland (World Cup 2006), Slovenia (World Cup 2010), Portugal and France (both World Cup 2014) have overcome the odds.

The First Leg?
There are some interesting facts regarding the first leg. Only three times has the home team won the first leg and not gone onto qualify - Scotland Euro 2004; Russia World Cup 2010 and Ukraine World Cup 2014. Interestingly both Russia and Ukraine were seeded teams. If Ireland lose tonight it's not the end of the world. Ukraine were 2 - 0 winners against France in November 2013 and still failed to qualify for the World Cup in Brazil.

On an even more positive note, no away team has ever won the first leg and not gone onto qualify. After last night, it would appear Norway are all but eliminated. If they do qualify, it will be a first for a UEFA team. If the Republic of Ireland win tonight you can book your ticket for France, unless of course the country become the first in the history of the play-offs to blow an away win in the first leg.

Ireland’s Task?
Being at home second we can confine this analysis to the seventeen successful countries that played away first. Eight wins, six draw and three defeats were achieved. The second leg is more positive with twelve wins, four draws and only one defeat on the records. England beat Scotland 2-0 in Glasgow in the first leg of a Euro 2000 play-off and were beaten 1-0 in the return leg; the only home defeat for a qualifying country while playing away first. It was still enough to secure their place at Euro 2000.

A draw is what many see as good enough tonight. It may well be. Six times a draw has been good enough for the away team in the first leg. Croatia and Russia have even qualified on the back on 0-0 draws.

A word of caution on the draw however. On three occasions Slovenia (1-1), Wales and Ukraine (both 0-0) returned home level after the first leg, hoping to finish the job, only to be dumped out in front of their own fans, with all three beaten 1-0 at home. 

​COYBIG! 

0 Comments
<<Previous

    Archives

    March 2023
    February 2023
    January 2023
    December 2022
    November 2022
    October 2022
    September 2022
    August 2022
    July 2022
    June 2022
    May 2022
    April 2022
    March 2022
    February 2022
    January 2022
    December 2021
    November 2021
    October 2021
    September 2021
    August 2021
    July 2021
    June 2021
    May 2021
    April 2021
    March 2021
    February 2021
    January 2021
    December 2020
    November 2020
    October 2020
    September 2020
    August 2020
    July 2020
    June 2020
    May 2020
    April 2020
    March 2020
    February 2020
    January 2020
    December 2019
    November 2019
    October 2019
    September 2019
    August 2019
    June 2019
    May 2019
    April 2019
    March 2019
    February 2019
    January 2019
    December 2018
    November 2018
    October 2018
    September 2018
    August 2018
    July 2018
    June 2018
    May 2018
    April 2018
    March 2018
    February 2018
    January 2018
    December 2017
    November 2017
    October 2017
    September 2017
    August 2017
    July 2017
    June 2017
    May 2017
    April 2017
    March 2017
    February 2017
    January 2017
    December 2016
    November 2016
    October 2016
    September 2016
    August 2016
    July 2016
    June 2016
    May 2016
    April 2016
    March 2016
    February 2016
    January 2016
    December 2015
    November 2015
    October 2015
    September 2015
    August 2015
    July 2015
    June 2015
    May 2015
    April 2015
    March 2015
    February 2015
    January 2015
    December 2014
    November 2014
    October 2014
    September 2014
    August 2014
    July 2014
    June 2014
    May 2014
    April 2014
    March 2014
    February 2014
    January 2014
    December 2013
    November 2013
    October 2013
    September 2013
    August 2013
    July 2013

    About

    This website was founded in July 2013.

    RSS Feed

    Categories

    All
    American Football
    Athletics
    Baseball
    Basketball
    Behavioural Economics
    Boxing
    Broadcasting
    Competitive Balance
    Cricket
    Cycling
    Darts
    David Butler
    Declan Jordan
    Drugs
    Ed Valentine
    Epl
    Esports
    Expenditure
    F1
    Fifa World Cup
    Finances
    Funding
    Gaa
    Gaelic Games
    Gambling
    Game Theory
    Gary Burns
    Geography
    Golf
    Greyhound Racing
    Guest Posts
    Horse Racing
    Impact Studies
    John Considine
    John Eakins
    League Of Ireland
    Location
    Media
    Mls
    Mma
    Olympics
    Participation
    Paul O'Sullivan
    Premier League
    Regulation
    Research
    Robbie Butler
    Rugby
    Simpsonomics
    Snooker
    Soccer
    Spatial Analysis
    Sporting Bodies
    Stephen Brosnan
    Swimming
    Taxation
    Teaching
    Technology
    Tennis
    Transfers
    Uefa
    Ufc
    World Cup
    Wwe

Related

The website is not formally affiliated to any institution and all of the entries represent the personal views and opinions of an individual contributor. The website operates on a not-for-profit basis. For this reason we decline all advertisement opportunities. 

Contact

To contact us email sportseconomics2013@gmail.com or find us on Twitter @SportEcon.