The Economics of Sport
  • Sports Economics
  • About
  • Workshop
  • Selected Publications
  • Book Reviews
  • A Primer on Gaelic Games
  • Upcoming Events
  • Media
  • Education
  • Resources & Links
  • Data

Reading Online Sport Economics Seminar (ROSES)

30/4/2020

 
By Robbie Butler

A number of weeks ago, the University of Reading started an excellent online sports economics seminar series. Led by James Reade, Carl Singleton and Adrian Bell the virtual gathering is a brilliant place to hear about the latest research in sports economics.

So far there have been 4 seminars delivered by Alex Krumer, Stefan Szymanski, James Reade and Bernd Frick. The YouTube Playlist for these talks can be found here.

ROSES now have seminars scheduled until the 19th of June 2020. The list is as follows:
May 1 Ruud Koning (Groningen),
May 8 Dennis Coates (Maryland),
May 15 Jorge A. Tovar (Wisconsin/Bogota),
May 22 Jamin Speer (Memphis),
May 29 Johan Rewilak (Aston),
June 5 Brad Humphreys (West Virginia),
June 12 David Ong (Jinan/Birmingham),
June 19 Daniel Torchia (Turin).

The organisers are now inviting submissions for those wishing to present between July 3 and September 4. The submission form can be found at https://forms.gle/SGEsLVyFw3CXVnqy9. A title and abstract are required before the 31st of May 2020.
Reading the Tea Leaves

27/4/2020

 
By John Considine
Words are important.  Economists have always listened to the statements of policy makers.  In particular, the statements of monetary and fiscal policy makers.  Economists working in finance listen to the press conferences of the Federal Reserve or European Central Bank in the hope of picking up information they can use.  In recent decades, academic economists, aided by advances in technology, have examined the same words as data for their quantitative models.  Last year, an overview of the area was published in the Journal of Economic Literature under the title "Test as Data".

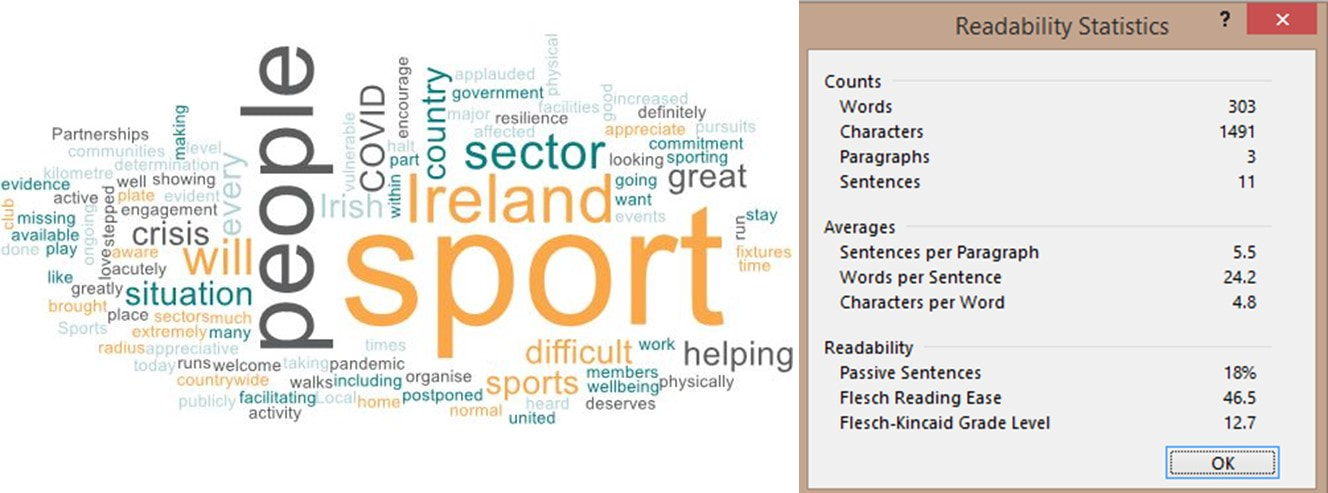
Software based analysis of sports features very occasionally in sports economics, e.g. a Journal of Sports Economics article from 2003 or a blog post from 2014 (here).  It will probably become more widespread given the ease with which it can be used.  Some of the basics available in most word processing packages are produced below.  It is three paragraphs from a recent statement by the Junior Minister for Sport.
Picture
A decade ago, economists started to examine the "Readability" statistics associated with speeches of Central Bankers.  Not surprisingly, they noticed that the Central Bankers were not as clear (readable) when delivering bad news.  The above speech has a Flesch-Kincaid Grade Level of 12.7.  This means that somebody with 12.7 years of US schooling should be able to understand it.  When sport resumes, the statement announcing it will probably have a Flesch-Kincaid Grade Level of less than 10.

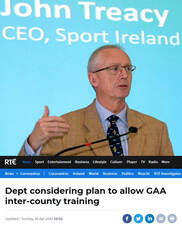
Under normal circumstances, policy statements are not an area of huge interest to sports economists.  But these are not normal times.  Economists and sports people are paying attention to the latest press conferences to hear news about when sport might return and in what form.  Readability statistics are not as useful in these circumstances.  There is a certain amount of "reading the tea leaves".  In this context, I was surprised by the lack of coverage given to the words uttered by John Treacy last Friday.
Picture
Speaking at the launch of the #InThisTogether campaign, the Head of Sport Ireland said contact sports would be slower to resume.  It seems obvious.  His words attracted some immediate attention but then seemed to be forgotten rather easily.  It did not make it to RTE's teletext!  [To anybody under the age of 30, teletext is a sort of early website that remains on the RTE News Now channel.  That channel is a sort of dark web for older people.]  Yet, at the rime of posting, there are stories on that platform about the return of sport that are 8-10 days old.

Nor do the words appear as a Press Release on the Sport Ireland website.

My initial thoughts were that John Treacy had left the cat out of the bag.  Then yesterday, on a variety of RTE's platforms a story appeared saying the Department of Sport was considering a plan to allow GAA inter-county training return later in the summer.  It was as if some hope needed to be returned to the GAA community.  Hope was the last item left in Pandora's box (and some think it is better translated as "deceptive expectations").

My guess is that Treacy has a better idea than most as to what should happen in Irish sport.  I remember our school coach holding him up as an example of never giving up.  Treacy collapsed before the finish line in a 10,000 race in the 1980 Olympics.  It seemed like his Olympics were over.  Days later he finished 7th in the 5,000m final.  A silver medal in the marathon followed four years later.  He seemed to excel where he was pushed to his limit.  The image of him retaining the World Cross-Country Championship in the Limerick mud is burnt into the memory of Irish people over the age of 50.  A touch of that resilience will serve all sports people well during the coming months.

Transfer Fees And Market "Corrections"

26/4/2020

 
By Robbie Butler

Under any criteria, the rise in the economic value of football in my lifetime has been remarkable. Two of the most obvious examples of this can be the found in transfer fees and broadcasting revenue.

In 1982, one of the greatest players of all time, Diego Maradona, left his native Argentina and signed for Barcelona. The cost of the transfer fee - just £3 million. That was almost 40 years ago. What about inflation? This must be a £100 million today, no?

Using UK data, and pound sterling fees (the euro was only created in 1999), Diego Maradona's real fee today is just £10.65 million. Just £10.65 million! In the most recent transfer window, Championship side Fulham signed Portuguese winger Ivan Cavaleiro for about the same real price as Maradona.

The rise in the real cost of footballers has been truly astonishing over the past 40 years. Data on this, considering each time the nominal record fee was broken, is presented below. As I pointed out in a post a number of years ago, on three occasions the nominal record was broken, but the real fee remained below the record price. 
Picture
The real increase in transfer fees is remarkable when compared to the 1982 Maradona fee which Barcelona paid to Boca Juniors. For example, by 1992 one Gianluigi Lentini of AC Milan was worth roughly 2.5 Maradona's. I doubt there is a football fan anywhere, ever, that could make a case for this. The Italian was good but a shadow of the player the great Argentine was. 

Zinedine Zidane and Kaka are the equivalent of 7 Diego's. Gareth Bale and Paul Pogba are today worth 9 Mardona's, Cristiano Ronaldo is worth 10. Neymar almost 20. That's an entire squad of players.

What funded this extravagant increases can be found in the far right columns - broadcasting fees. My data is only for English top flight football but is a reasonably good comparison. In 1982 Maradona's fee was worth more than the entire 1st Division broadcasting agreement between the FA, BBC and ITV. 

The ratio between this and subsequent agreements makes the increase in the real cost of transfers seem small. It is astonishing growth. Today, the Premier League broadcasting rights are worth more than 200 times what they were when Maradona left Buenos Aires in 1982. And this is in real terms! It is what largely continues to fuel transfer fees and salary increases.

Will Covid-19 lead to a transfer fee correction? There are many factors at play, but it is possible.

To what extent, will depend on changes in the broadcasting fees paid by providers and the impact of the crisis on the wealth level of rich owners. Any correction may also be a short run effect. If broadcasting fees are unaffected, 'normal' service will likely resume sooner rather than later.

Ireland's ELO in Recent Times

24/4/2020

 
By David Butler
​
Since the appointment of Stephen Kenny as the Republic's senior international manager, there has been plenty of takes in the media on what the future will hold for the national soccer team. Most have a positive outlook. Some would say naively optimistic – I hope the consensus offered by the journalists is right.

Many articles in the media offer a chronology. Dominant narratives emerge, particularly relating to managers. We are told that ‘Jack's era was great but failed to exploit the talent available’, ‘Kerr was hard done by’, Trap/O’Neill brought relative success but at a cost’. I think the latest is ‘Mick flopped the second time around’. Salient memories are drawn on including famous goals, handballs and bust-ups.

While these takes are not inaccurate, I'm cautious of them. They leave out a lot. The highly selective nature of the popular accounts can also be reinforced in the consciousness of the general fan. For one manager in particular certain poor results are forgotten. For other managers, good performances are not given fair dues.

I’ll try and offer a different take here. The aim is to consider our performance over time using our ELO rating. I'm going to indulge and offer a different narrative that keeps the (unscientific) element of picking out salient moments. A type of historical revisionism so to speak where most of the popular highs/lows don't feature.

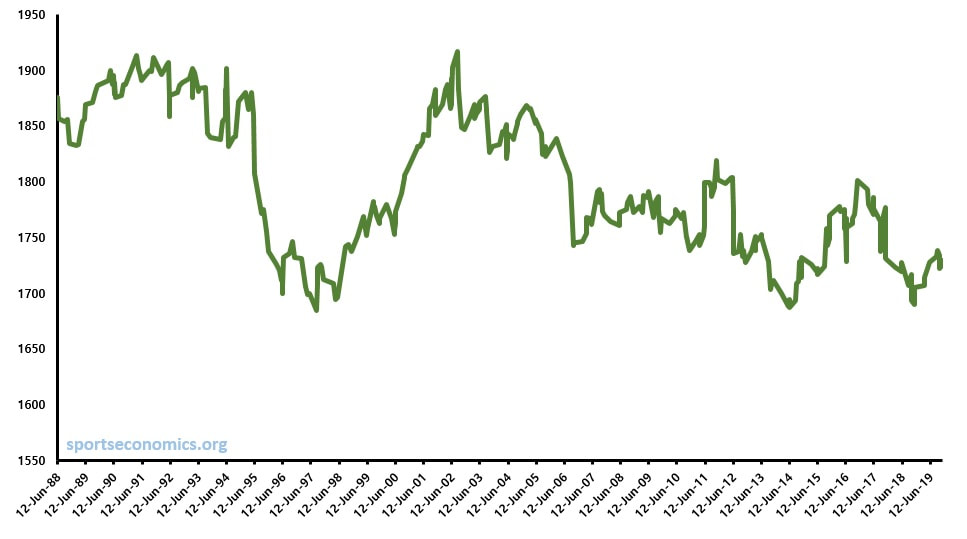
Before the narrative, the graph below shows our ELO from 1988 to date. For international readers, 1988’ is generally considered the BC/AD moment for Irish international soccer as this was when the Republic qualified for the finals stage of a major tournament for the first time (Euro 88’).

On the ELO rating system, this was adapted from chess and scores soccer teams based on performance. Among a range of factors, points are awarded based on the type of match played (qualifier/friendly etc.), home advantage, opponent quality, goal difference and expected results.

Our highest rating was in August 2002 (1917 points). This was recorded during Mick McCarthy’s first spell. Our lowest rating was recorded in August 1997 (1685 points), also during McCarthy’s first stint as manager. There is a downward trend since 2002. Our average rating from 1988 to present is 1791.1.
Picture
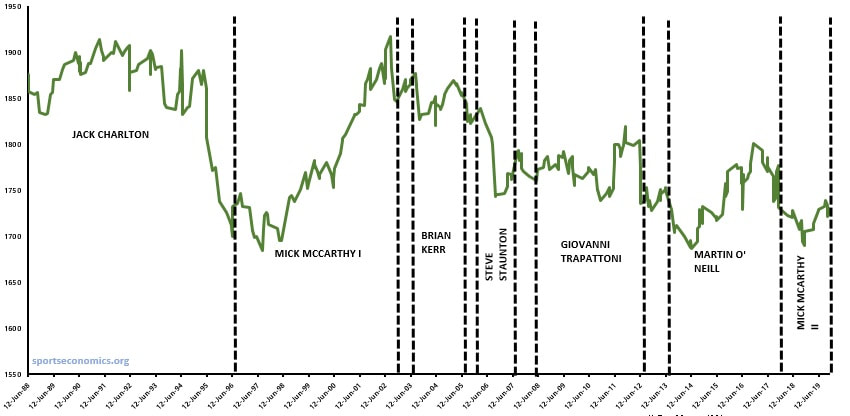
Next I've plotted the ELO trend with a general (but not precise) definition of managerial periods. While it's always important to caveat that the managers are not on the pitch and that the talent pool changes over time, they are the ones that ultimately take responsibility for performances.

While the rating starts to decline again at the start of the Euro 2004 qualifiers, the Staunton era brought about a sharper decay - we haven't recovered from this.

Picture
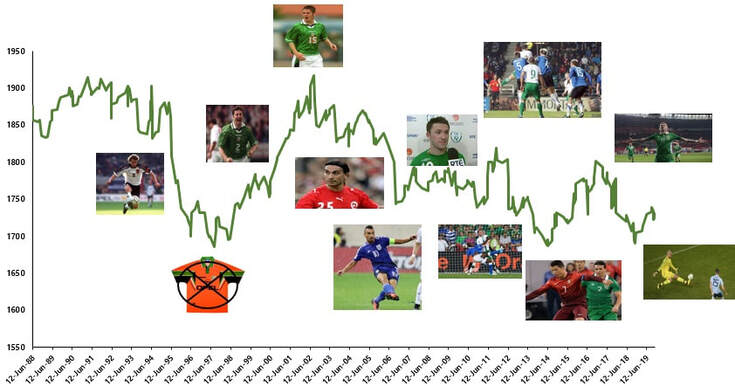
Now for an alternative story. I begin this toward the end of Jack Charlton's reign. Below plots the same graph with pictures that, for me, can be used to chart the key phases in our recent history. Some are expected ones, other definitely not. The pictures are symbols of the rises, declines, peaks and troughs. 
Picture
  • June 11, 1995 - Toni Polster - The Austrian represents our ratings slide and the beginning of the end for the Charlton era. He scored twice in Landsdowne Road as Ireland finished the group in second place and lost a playoff to the Netherlands.
  • August 20, 1997 - Not 'A Macedonia' - Our lowest ebb. No, not the 3-2 defeat in Macedonia where we wore the infamous orange jerseys but rather that lesser remembered 0-0 draw at home to Lithuania. You can join the other 129 YouTube viewers that have revisited our darkest day here (commentary not in English).
  • September 5, 1998 - Irwin's Penalty - we start to repair our ranking under Mick McCarthy and Denis Irwin scores a penalty in a home win against Croatia
  • August 21, 2002 - Graham Barrett - Our highest ELO rating since 1988. Graham Barrett, scored the third in a 3-0 friendly win against Finland in Helsinki.
  • September 8, 2004 - Hakin Yakin - Ireland's slide back down the rankings is captured by the swiss attacker. He scored in both home and away legs against the Republic during the Euro 2004 qualification and later again in the World Cup 2006 qualification campaign.
  • October 7, 2006 - Constantinos Charalambides - Another low point. A memorable one too. A 5-2 loss to Cyprus where Charalambides who, along with Michalis Konstantinou, scored a brace in Nicosia.
  • August 22, 2007 - Robbie Keane - The rating enters a period of relative stability, Robbie Keane is the face of a 4-0 friendly win in Denmark.
  • November 11, 2011 - Keith Andrews Header - the trend improves and a local high point is recorded after a 4-0 playoff win in Estonia.
  • June 18, 2012 - Mario Balotelli - The rating slides again after a woeful performance at Euro 2012, albeit among hot competition. Balotelli’s late goal is the final nail in the coffin.
  • June 12, 2014 - Cristiano Ronaldo & Stephen Kelly - Portugal 5, Ireland 1. A friendly in the USA marks our second lowest rank in recent history, having lost to Sweden at home earlier in campaign to qualify for the 2014 World Cup.
  • November 12, 2016 - James McLean - A recent high point on the declining trend. Martin O’Neill recovers the fortunes of the side and the McLean winner in Austria gave an extremely rare away win for Ireland against a team seeded above us in a competitive match.
  • November 15, 2018 – Darren Randolph Save - two years on from McClean's goal in Austria, we hit our most recently low. An apt 0-0 draw at home to Northern Ireland, Darren Randolph rescued a draw.

Currently, our rating is 1730 points. If Stephen Kenny brings us back up to our average it will be a job well done. He would have to recover 60 points, give-or-take. If he can reverse the trend, qualification for major competitions would likely be a by-product.

Sherlock Holmes and Academic Presentations

24/4/2020

 
By John Considine
Picture
It is rare to get a Sherlock Holmes moment in academic presentations where the presenter explains the logical simplicity of a surprising result.  There are plenty of surprising results where the presenter fails to convince a sceptical audience. I remember one such Holmes type presentation.  It involved the audience being mislead by their perception of sport.  It centred on a key question.

In what sport do the most sudden deaths occur?  After a slight pause, to give the audience enough time to come up with an answer but not enough time to deliberate or confer, the presenter said "Golf".  This was immediately followed by a burst of low level murmuring amongst the audience.  Fionnuala Quigley went on to outline the findings from her British Journal of Sports Medicine article.  Forty-five of the 49 coroners she surveyed replied.  Fifty-one sudden deaths were reported (of which 50 were male).  The median age was 48 (range 15-78).  And, golf was the most regular sport.  Elementary - as the screen version of Sherlock Holmes might say.

Quigley leveraged our perception of sport as young person's activity.  We probably imagined that sudden deaths occurred when athletes pushed themselves too far.  Her presentation took place only months after a prominent gaelic footballer died.  We probably pictured his outstanding displays in Croke Park rather than the fact that he died in his sleep from an underlying heart condition.  It is easy to see how our minds can play tricks on us.  Careful thought, debate, the help of an expert, and an examination of the data can set us straight.  Holmes always warned against speculation without data.

On the economic front, we should also keep in mind that there more to sport than the high profile elements we see broadcast on our screens.  Let us return to golf.  A recent report by RTE highlighted the impact of the current virus related restrictions.  A representative of Ballybunion Golf Club, one of Tom Watson's favourites, pointed out that they would have taken €3m in green fees in 2020 and another €0.5m in the shop.  A sizeable proportion of that will now not materialise.  The economics of sport includes situations where individuals pay-to-play as well as those who are paid-for-play.

Advantage Wimbledon

23/4/2020

 
By Ed Valentine

In the large-scale absence of professional sport, fans have been reduced to watching governing bodies fight it out for the title of the most high-profile tournament cancellation. The Euros, Monaco Grand Prix, The Tour de France and the Augusta Masters are among a list of events being postponed or cancelled.
 
While fans are deprived of sporting action organisers are deprived of several revenue streams. Ticket sales, broadcast fees and sponsorship are taking a hit across the sporting balance sheets.
 
Formula One’s owners, Liberty Media, are investigating the logistics of running 8 double race weekends back to back in the final quarter of 2020. Other event organisers have postponed until next year and will take a hit on the loss of income.
 
Wimbledon, the annual summer grass court tennis tournament was a relatively late cancellation. Fans will miss the strawberries and cream, but the annulment would allow the AELTC to trigger an insurance clause which the club purchased in 2003 where following on from the SARS outbreak pandemic insurance was included in the annual premium. Over the last 17 years the club paid out a total of €40 million for the additional cover, it’s not a small fee however Wimbledon can now expect to receive a pay out rumoured to be around €140 million for the tournament not going ahead in 2020.
 
How far that claim would go to cover lost revenue is unlikely to be reported but estimates indicate that the loss of income across the main streams of sponsorship, tv broadcasts and ticket sales would be around €330 million. €35 million in prize money would be saved together with expenses and sundries. Crunching these numbers indicates that around 50% -55% of the lost revenue would be provided for via the lump sum.
 
With the benefit of hindsight that now looks to be a wise purchase. Other governing bodies and tournament organisers who did not have the foresight to include pandemic coverage will not benefit from insurance pay outs and may be in some financial trouble. At least with no sport to govern they will have the time to go compare.

New COVID Rules and League of Ireland Attendance

21/4/2020

 
By David Butler

The Government has confirmed that events with crowds of more than 5,000 will not be licensed up to the end of August.

In the last few hours the FAI have announced that they are seeking talks with Government and Department of Sport officials on the new proposals.

As Gary Owens (FAI) mentions in this statement, the devil is in the detail re government proposals, but there may be an opportunity here for the domestic league to get going again sooner than June 19th.
​
On the attendance numbers for the league of Ireland Premier Division:
  • The average attendance at a home league of Ireland match for the 2019 season was 2,162. For 2018 it was 2,124.
  • For the last two seasons stadia reached circa ~45% capacity.
  • The maximum attendances for the last two seasons were 7, 021 (Shamrock Rovers vs Bohemian - 2019) and 6,672 (Cork vs Dundalk - 2018). The good news is that matches with over 5,000 spectators are very rare. For instance, in 2018 only 2 matches out of 180 had an attendance over 5,000 (Cork City v.s Dundalk and Cork City vs Waterford).
  • Average attendances for each Premier Division club last season were: Bohemian (2,989) Cork City (2,505), Derry City (2,633), Dundalk (2,780), Finn Harps (1,158), Shamrock Rovers (3,444), Sligo Rovers (1,996), St Patrick’s Athletic (1,896), UCD (739), Waterford FC (1,599)

Given that excess capacity is usually available at stadia, clubs should be in a place to introduce appropriate social distancing measure for attendees. Obviously, this will not apply to any playing staff.

To avoid any potential problems some key fixtures would need to be avoided in the short-run such as Dublin Derbies, Munster Derbies or what appears to be a title decider in Shamrock Rovers vs. Dundalk.

Maybe this is one silver lining of our relatively low attendances. Perhaps, even a broadcaster may be interested in televising the league of Ireland to fans starved of the sport the world over?

Darts At Home

21/4/2020

 
By Ronan Fahy

Last Friday saw the start of the Professional Darts Corporations (PDC) new venture amidst the Covid-19 pandemic. “The PDC Home Tour” will see the 120 tour card holders from the PDC compete across an initial 32 nights, with group winners advancing to a second phase of the competition. The tournament is being streamed free of charge on PDCTV.
 
ModusDarts.tv, who manage several professional players, are currently running an “Icons of Darts League”. Last Thursday night saw Raymond Van Barneveld take on Martin Adams. A friend of mine and many others on Twitter spotted Van Barneveld’s odds moving significantly from an opening of 8/13 to a closing price of 11/8 with rumours circulating that somewhere in the region of £65’000 was put on Adams an hour before the game.
 
Adams ran out a 5-0 winner over Van Barneveld whose play was extremely out of sorts averaging 65.86, lower than his lowest recorded average of his professional career. It’s worth noting that there were no big market swings on any other of Van Barneveld’s games, with only £500 t £1000 traded on them.
 
Of course, there are many reasons why this could have happen. However, given the environment in which games are played, the opportunity for manipulation is surely much higher than it would be under normal conditions. Like almost all sports, darts is no stranger to this. In 2006 Gary Anderson and Gary Robson were cleared of match fixing after irregular betting patterns were spotted ahead of their first round match at the BDO World Championships.
 
The PDC’s version is likely to gain significantly more attention with more bookmakers offering markets on the tournament and it’s will become less likely we will see occurrences like this incurring more frequently. 

Ronan Fahy is a Final Year Student at University College Cork. He is set to commence an MSc by Research (in Sports Economics) during the 2020/21 academic year.

Promotion/Relegation Scottish Attendance Numbers

20/4/2020

 
By David Butler,

Recent posts on this blog have considered the revenue implications of promotion/relegation if leagues are to end early. This is the case for the Scottish lower leagues. The table below shows estimates for average turnout for relegated and promoted Scottish clubs for the top two divisions.

The top half of the table considers the year a team was relegated, their average Premiership attendance and then their average Championship attendance the following season. The second half of the table looks at the promoted clubs average attendance in their year of promotion and subsequent season among the elite. 

It's worth noting that Scottish clubs  have a relative reliance on gate receipts as a revenue stream in comparison to other sources (broadcasting, commercial etc.) - according to UEFA's recent benchmarking report Scotland tops the lists for percentage of revenue coming from the gate (43%)
Click to set custom HTML

Year

Relegated Club

Premiership

Championship

Change

2018/2019

Dundee

6,024

5,505

-519

2017/2018

Partick Thistle

4,721

3,043

-1,678

2017/2018

Ross County

4,612

3,850

-762

2016/2017

Inverness CT

3,949

2,395

-1,554

2015/2016

Dundee United

6,071

6,584

513

2014/2015

St Mirren

3,906

3,549

-357

2013/2014

Hibernian

10,585

10,170

-415

2013/2014

Heart OM

14,183

15,985

1,802

Year

Promoted Club

Championship

Premiership

Change

2018/2019

Ross County

3,850

4,664

814

2017/2018

Livingston

1,350

3,876

2,526

2017/2018

St Mirren

4,448

5,333

885

2016/2017

Hibernian

15,394

17,964

2,570

2015/2016

Rangers

45,325

48,941

3,616

2014/2015

Heart OM

15,985

16,502

517


There is an expected relationship here. A falloff for relegated clubs and a boost for promoted ones. That said, it is sensitive to specific clubs.  It would be interesting to go into greater detail on the strength of these changes, my hunch would be that promotion would have a stronger effect positive effect (than relegation would have negative).

The rises and falls above translate to revenue gains/losses. No doubt it is these types of numbers that will be sought after by sports lawyers arguing either way when it comes to ending seasons as is. 

Perhaps the one interesting note is that while Hearts could be the unlucky due to COVID, the last time they were relegated the estimates say their attendance actually increased the following season...

Cork 2022 - ESEA

19/4/2020

 
By Robbie Butler

The 12th Annual European Sport Economics Association was due to be held in Helsinki, Finland this August. The event will now be held at Haaga-Helia University of Applied Sciences, Helsinki Finland from 24 to 25 August 2021.

The 13th ESEA at University College Cork, which was scheduled for August 2021, has therefore moved to 2022 - a World Cup Year! 

We hope that many of our regular readers and followers will be able to join us in Cork in just over two years time.
<<Previous

    Archives

    March 2023
    February 2023
    January 2023
    December 2022
    November 2022
    October 2022
    September 2022
    August 2022
    July 2022
    June 2022
    May 2022
    April 2022
    March 2022
    February 2022
    January 2022
    December 2021
    November 2021
    October 2021
    September 2021
    August 2021
    July 2021
    June 2021
    May 2021
    April 2021
    March 2021
    February 2021
    January 2021
    December 2020
    November 2020
    October 2020
    September 2020
    August 2020
    July 2020
    June 2020
    May 2020
    April 2020
    March 2020
    February 2020
    January 2020
    December 2019
    November 2019
    October 2019
    September 2019
    August 2019
    June 2019
    May 2019
    April 2019
    March 2019
    February 2019
    January 2019
    December 2018
    November 2018
    October 2018
    September 2018
    August 2018
    July 2018
    June 2018
    May 2018
    April 2018
    March 2018
    February 2018
    January 2018
    December 2017
    November 2017
    October 2017
    September 2017
    August 2017
    July 2017
    June 2017
    May 2017
    April 2017
    March 2017
    February 2017
    January 2017
    December 2016
    November 2016
    October 2016
    September 2016
    August 2016
    July 2016
    June 2016
    May 2016
    April 2016
    March 2016
    February 2016
    January 2016
    December 2015
    November 2015
    October 2015
    September 2015
    August 2015
    July 2015
    June 2015
    May 2015
    April 2015
    March 2015
    February 2015
    January 2015
    December 2014
    November 2014
    October 2014
    September 2014
    August 2014
    July 2014
    June 2014
    May 2014
    April 2014
    March 2014
    February 2014
    January 2014
    December 2013
    November 2013
    October 2013
    September 2013
    August 2013
    July 2013

    About

    This website was founded in July 2013.

    RSS Feed

    Categories

    All
    American Football
    Athletics
    Baseball
    Basketball
    Behavioural Economics
    Boxing
    Broadcasting
    Competitive Balance
    Cricket
    Cycling
    Darts
    David Butler
    Declan Jordan
    Drugs
    Ed Valentine
    Epl
    Esports
    Expenditure
    F1
    Fifa World Cup
    Finances
    Funding
    Gaa
    Gaelic Games
    Gambling
    Game Theory
    Gary Burns
    Geography
    Golf
    Greyhound Racing
    Guest Posts
    Horse Racing
    Impact Studies
    John Considine
    John Eakins
    League Of Ireland
    Location
    Media
    Mls
    Mma
    Olympics
    Participation
    Paul O'Sullivan
    Premier League
    Regulation
    Research
    Robbie Butler
    Rugby
    Simpsonomics
    Snooker
    Soccer
    Spatial Analysis
    Sporting Bodies
    Stephen Brosnan
    Swimming
    Taxation
    Teaching
    Technology
    Tennis
    Transfers
    Uefa
    Ufc
    World Cup
    Wwe

Related

The website is not formally affiliated to any institution and all of the entries represent the personal views and opinions of an individual contributor. The website operates on a not-for-profit basis. For this reason we decline all advertisement opportunities. 

Contact

To contact us email sportseconomics2013@gmail.com or find us on Twitter @SportEcon.