The Economics of Sport
  • Sports Economics
  • About
  • Workshop
  • Media
  • Selected Publications
  • Book Reviews
  • A Primer on Gaelic Games
  • Upcoming Events
  • Education
  • Resources & Links
  • Data

Irish Imports of Footwear for Sport

27/10/2016

 
By John Considine
In 2015 the Irish imported over €400m in footwear and 22% of this is footwear for sporting activity.  There were just under five million pairs of sporting footwear products imported and over two-thirds of these were rubber soled items classified for tennis/gym use.  The official statistics are skimpy on the details about the country of origin of Irish footwear imports.  However, the statistics do tell us where we import a massive 75% of "Shoes for Tennis/Gym".  Any ideas?

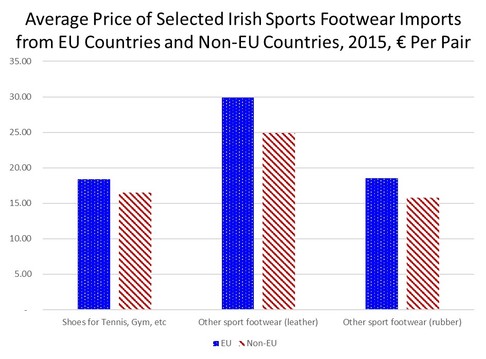
It is possible to work out the average price for the sport footwear.  These are presented in the bar chart below.  Shoes for Tennis/Gym are imported for approximate €18 a pair.  Those being imported from EU are more expensive than those originating from outside the EU.  The import prices for EU products are also more expensive in the other two categories.  Again, data limitation prevent further disaggregation.
Picture
One might be inclined to believe that the vast majority of sport footwear being imported into countries like Ireland comes from eastern Asia.  A recently launched introductory textbook in economics begins a chapter with a section titled "Are companies like Nike harming workers in Vietnam?".  The authors point out that "globalisation in general has been an enormous force for good in Vietnam".  The Irish data shows that very few of the Irish sports footwear imports arrive direct from Vietnam (although where the footwear is actually manufactured might tell a different story).  The little data we have on Irish imports of Shoes for Tennis/Gym shows that the vast majority come from the neighbouring island of Great Britain - 75% to be exact.

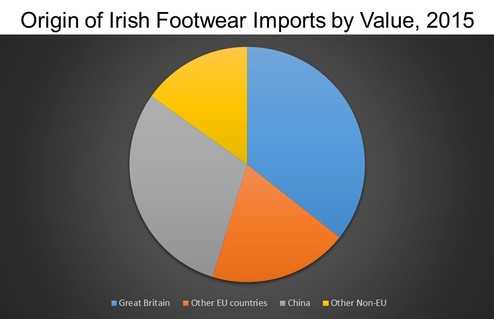
There is more detailed data on all footwear imports.  The pie chart below shows that the vast majority footwear Irish imports come from Great Britain or China (note: this data is for all footwear).  Vietnam is included in Other Non-EU and accounts for 7% of the total.  One wonders if Brexit will make a difference.
Picture

The Rise and Rise of Dundalk?

25/10/2016

0 Comments

 
By Robbie Butler

On Sunday night Dundalk were crowned League of Ireland champions for the third successive year. This is the first time the Co. Louth club have won three titles in a row and the club joins a a very short list that have achieved this feat. Shamrock Rovers managed to win three-in-a row twice (during a four season stint as champions between the 1983-84 and 1986-87 seasons). Waterford won three titles in 1968, 1969 and 1970, while the defunct Cork United were the first triple-champions between the seasons 1940-41 and 1942-43. 

Dundalk' success is quite unusual for the League of Ireland, especially in recent years. The opening chapter of Stefan Szymanski's Money and Football: A Soccernomics Guide addresses the area of dominance and distress amongst clubs. The author notes that between the years 1963 and 2012 (50 seasons) the League of Ireland had a higher number of championship winners (15 clubs) than any other European league. The most successful club over this period (Shamrock Rovers) also had the lowest number of league wins (just 7) when compared to the most successful clubs in every other European League.

From this information we can conclude the League of Ireland is very well balanced and ultra-competitive, relative to other European league. But what might this mean?

Sports economics literature tells us that competition is essential for sport to survive. Linked to this is the uncertainty-of-outcome hypothesis. In order to sell sport to customers, the result cannot be know beforehand, otherwise why watch. The League in Ireland certainly displayed this characteristic over the past five decades, but did it really matter? The evidence would suggest no. Attendances are still very low, relative to other sports on this island and when compared to other football leagues across Europe. That said, Dundalk's dominance is dramatically reducing the level of competitive balance and undermining uncertainty of outcome. This might not be a bad thing.

I previously wrote about "The Rise and Decline of Champions" (in true Mancur Olson fashion). Dundalk need to avoid the cycle of Irish clubs over the past two decades, where league success has been followed by a period of decline, financial distress and in some cases relegation. Their continued dominance, if sustained, can only be a good thing for the League of Ireland generally. Repeated league wins will result in continued participation in the qualifying stages of the Champions League. Anecdotal evidence suggests experience and repeated opportunity result in a greater chance of success, and possibly an Irish club in the Group Stages of the UEFA Champions League. Dundalk have two years experience of Champions League football and are still in the Europa League. This can only help next season.

Success at this level raises the League of Ireland's UEFA league co-efficient. Dundalk are also Europe's 226th highest ranked club. That's ahead of Scotland's Hearts and Hibs, Utrecht, and Rapid Bucharest.

The Europa League continues again next week as Dundalk travel to Saint Petersburg to take on the mighty Zenit. They will be hoping to add to the €6.5 million they have already scooped in prize money. Ignoring the parachute payment and base fee they received to date, and assuming a normal points allocation for the qualifying round, this equated to €118,000 per point won in Europe. The league win this week was worth €110,000. €8,000 less or just under €1,500 per point. 
0 Comments

Call for Papers - Special Conference Session on Spatial Aspects of Sports

22/10/2016

0 Comments

 
by Declan Jordan
The Regional Science Association International - British and Irish Section hosts its annual conference in late August. Next year I am hoping to organise a special session on the spatial aspects of sports performance and the spatial impact of sports investment. The 46th annual RSAIBIS Conference will take place in 2017 in Harrogate in Yorkshire on August 23rd and 24th. This is a week before the European Sports Economists Association Conference in Paderborn.

That economic activity tends to concentrate across locations is a now a well-observed stylised fact. Regional economics has a long-standing literature on the effects of location on business performance (using an array of measures), economic growth, well-being, and This literature considers the impact of place on economic, and the impact of the activities of economic agents on the place in which they are located.

To date, there is a lack of spatial analysis of sports performance, management, and development. This is despite the clear differences in participation, popularity, and performance of different sports across space. Also, within individual sports there are differences in performance of clubs in different locations, and the extent to which this is facilitated by the characteristics of the location is under-researched. Most spatial analyses involving sport have focused on the impact on local or regional effects of large sports-related infrastructural or mega-event investments. 

If you would like further information about the special session and/or would like to submit an abstract please contact me as session organiser at d.jordan@ucc.ie.
0 Comments

Premier League Predictions and The Poisson Distribution

21/10/2016

 
By Sean O'Connor
 
The Poisson distribution, named after the French mathematician Siméon Denis Poisson, is a calculation method utilised in probability theory and statistics to express the likelihood of a given number of events occurring in a fixed interval of time or space

On the page Premier League Predictions and The Poisson Distribution  I use a simple Poisson distribution to predict Premier League results. The predictions for game week 9 is available on this section of the website.  For the early kick off the model predicts Tottenham have a 53% chance of beating Bournemouth at the weekend.  Moreover, the predicted result is the scoreline with the greatest probability of occurring (0-1).

Prior to each gameweek I will post probability scores generated by the model for all Premier League games and provide a brief commentary on the success rate of the previous week’s predictions.

Relegation & Attendance

19/10/2016

 
By David Butler
​
As the years go on, a growing number of English clubs are experiencing the Premier League. For many, this experience is short lived. Watching highlights from the Championship on Sky Sports this morning, I saw goals go in at Barnsley, Birmingham, Fulham, Blackburn and Leeds. As a Tottenham fan my mind naturally cast back to matches at the recognisable grounds. David Ginola’s goal in 1999 at Oakwell in the FA Cup is a pretty salient memory. Robbie Keane’s second of the game in 2006 at St. Andrews is another.  Equally, I remember losing at Craven Cottage, Ewood Park and Elland Road. What struck me most was the attendance last night, or more precisely, lack of it, at these grounds. Albeit a Tuesday night, the array of empty seat at the venues (in particular Portman Road) were blatantly obvious.  I don’t have many memories of this for these clubs in the Premier League.

To consider this idea quickly and crudely (as all other factors are being held equal), the graph below shows the average home attendance figures for a series of clubs that spent at least two consecutive seasons in the Premier League (blue bars) and were subsequently relegated to Division 1/The Championship for up to three seasons* (grey bars). Most of the data is taken from European-Football-Statistics website. I focused on current Championship clubs and left out some notable yo-yo teams such as Norwich, Newcastle and QPR.

As you would expect the graph illustrates the considerable attendance drop for many clubs when they leave the top flight. Ipswich were the only ones to maintain and increase their attendance after relegation from the Premier League. This may be due to the fact that, despite their relegation, they still qualified for the UEFA Cup through the Fair Play mechanism for the following season.

​For some clubs there seems to be a natural decay too. When a return to the Premier League is not secured immediately, attendance will suffer further; as was the case with Birmingham, Reading, Leeds, Wolves and Wigan.  
Picture
​It’s also interesting to think about attendance in terms of the capacity of the ground. This is obviously important and absolute figures can only give us so much of an insight. The table below shows the attendance ratio for the clubs listed in the graph above. Reading and Fulham had almost a full house while in the Premier League. This ended after relegation. Leeds were also quite close to capacity before their collapse. Blackburn observed the biggest fall, a 24.08% drop after relegation.  Birmingham also witnessed a high fall following relegation (21.11% drop).

*Wigan and Wolves were relegated to League One in year two for Wolves and year three for Wigan
Picture

Transfer Fees and The Brexit Story

14/10/2016

 
By Robbie Butler

In May, I wrote about the possible implications for the Premier League of the UK's June 2016 referendum on membership of the European Union. The Premier League is one of the labour markets we know most about in the UK, and is dominated by non-English workers.

Previous work on this blog has shown that the Premier League imported more than one-third of it's players from the EU, and another quarter from countries outside of the EU during the 2015-16 season. Roughly six out of ten players playing in the league last year were non-English nationals.

The on-going collapse in the price of the pound sterling should be of concern to Premier League clubs, given their reliance on imports. Notwithstanding the obvious complexities with transfer fee's, the list below shows players imported from the European Union by English clubs during the 2015 summer transfer window, where a fee of in excess of £20 million was paid by an English club. ​The fee is club played is compared to the fee the clubs would be have to pay today, assuming the players value hasn't changed, given the recently fall in sterling. 
Picture
It's very likely all seven selling clubs (based in France, Germany, Netherlands and Spain) would require far more £GBP today if they were dealing in the same transaction. For example, Man City would have to pay almost £70 millions for Kevin De Bruyne, and saved more than £13 million based on today's exchange rate.

Two players (Álvaro Negredo and Ángel Di María) were exported to the EU from England. Again, it's likely the two selling clubs (Manchester City and Manchester United) would look for much more than the £22 million and £44.3 million pounds they received. While both are probably better off from their respective Depay, Otamendi and De Bruyne purchases, the opposite is true of the sale of Negrado and Di María.

Should the pound take a further hammering over the coming months and years, it will become more expensive for English clubs to bring EU imports to the Premier League. This of course is good news for Breixters, with inward migration among their main concerns and reasons for voting to leave. 

I wonder how many that voted to leave, citing migration concerns, would have a problem with the return of Cristanio Ronaldo to Manchester or Luis Saurez to Liverpool? Or the possible arrival of Lionel Messi? I wonder...

Rule Changes and Incentives in the League of Ireland 1970-2014

12/10/2016

 
By David Butler

Soccer & Society, in conjunction with Routledge/Taylor & Francis Online, have published a variety of articles on soccer in Ireland. The special edition addresses economic, historic and social aspects of the soccer. A full list of the articles can be found here.

Robbie and I have made a contribution. Our article entitled Rule changes and incentives in the League of Ireland from 1970 to 2014 offers a broad analysis of the developments in the League of Ireland from the 1970’s onward. In particular it offers a descriptive account of the (many) changes to rules in the League, some of which were quite forward thinking at the time, such as the introduction as a 4-3-2-1 points system trialled in the early eighties. We also describe the evolution of the promotion/relegation system and the switch to Summer Soccer. In light of the changes, we analyse the number of goals scored from 1970-2014.

Changing the rules in the League, in an effort to have a more exciting sport, has made Irish football competitions particularly complex relative to their European counterparts. Despite the many attempts to improve our league through rule changes, the period has seen a general decline in the number of goals scored.

Comparing Olympic and Paralympic Performance – Underachieving Nations

10/10/2016

 
By Stephen Brosnan

Previously, I have discussed (here) the best performing nations at the Paralympic games relative to their Olympic counterparts. In this post, I look at the worst performing nations at the Paralympic games relative to the nation’s Olympic athletes to provide possible explanations for the drop in performance levels individuals with disabilities relative to others. As previously discussed, comparing Olympic and Paralympic performances is not so straight forward given that there are many more medals distributed in the Paralympics compared to the Olympics. In Rio 2016, 974 Olympic medals were awarded while 1597 medals were distributed in the Paralympics. Thus, when comparing the performances of countries it makes sense to consider the share of total medals the country won rather than absolute values.
​
The Table below reports the worst performing countries measured by the percentage of medals obtained by countries in the Paralympics relative to the Olympics. 
Picture
The United States is the worst performing nation in terms of differences between shares of total medals in the Olympic and Paralympics. While the US Olympians claimed 12.42% of overall medals in Rio, the US Paralympians claimed only 7.20% of total medals. The United States finished fourth overall which considering their income per capita and population, two indicators which increase the likelihood of success, could be considered a major underachievement.  A recent article in the Independent (here) insists that this underperformance is no coincidence and can be linked to a lack of investment in Paralympic athletes with no central government funding in existence while arguing that it reflects the lack of support in the US for those who are disabled.

Japan were the second worst performing nation relative to their Olympic athletes, finishing 59th overall, their worst ever performance. The performance has prompted Japanese Paralympic Committee (JPC) President Mitsunori Torihara to insist the country must analyse their performance to decide which sports to concentrate on when the country hosts the Paralympic Games in 2020. Furthermore, the JPC plans to roll out educational programmes for the public to raise awareness of the sport. These measures in addition to extra funding available as a result of hosting the event in 2020 should give the country a good opportunity to improved their Paralympic performance.

The Ryder Cup and Brexit

7/10/2016

0 Comments

 
By Robbie Butler

Those of us from Europe that stayed up to watch the wonderful display of golf (primarily displayed by Team USA) woke up disappointed in Monday morning. During the course of the week, golf headlines collapsed as people moved on from last weekend's event at Hazentline National. Much of this week has been domianted by talk of BREXIT, the potential trigger of Article 50 in the Treaty of the European Union, and the collapse of the pound sterling on world markets this week.

It got me thinking. I wonder did Brexit have any impact on the team spirit or togetherness of Team Europe? The last number of decades, Team Europe has become  known for the bond between players, team spirit and sense of believe. Team USA has often been criticised in the past for lacking this same team spirit.

The single matches on Sunday saw twelve Europeans compete against Team USA. Five players were from mainland European countries all in the EU. These were Belgium, Germany, Spain and Sweden. Six players were from England (five were born there while Justin Rose was born in South Africa but moved to England as a child). One (Rory McElroy) was born in Northern Ireland.

The table below presents the points won, matches played, and points per match of the players from Brexit (Red) and non-Brexit (Blue) countries. McElroy (Green) is a special case. While the Brexit referendum passed, a majority in Northern Ireland rejected the proposal in June. 
Picture
The European score in the Singles Matches on Sunday reads EU 4.5 - 0 Britain and Northern Ireland.

Of course, this is not the reasons for this. Pieters, Cabera-Bello, Garcia, Stenson, and Kaymer played exceptional well on Sunday and were deserving of their points.

The most efficient Team Europe  players over the course of the three days were rookies Cabera-Bello and Pieters. This is probably a first for Team Europe and even the Ryder Cup. 

Let's hope this is just a blip, in what has been a remarkable two decades for Team Europe, and that the trophy will return once more to these shores following the event in Paris in two years time. 

0 Comments

When Fergies Boys Go Home

4/10/2016

 
By David Butler

I'm sure Mark Hughes gave a sigh of relief when Joe Allen slammed in a late equaliser against Manchester United last weekend. I was surprised Hughes achieved a point against his former club. I can’t remember him doing too well at Old Trafford in the past.

Fergie’s managerial dynasty spawned a plethora of managers who would later compete against him and Manchester United. Many of these had significant success at United. I often wondered whether there was a psychological barrier when returning ‘home’ with a different club for these managers?  Was it the case that it was easier for Fergie to take on his prodigy at a managerial level. After all he thought them a lot of what they knew.

A manager-by-manger analysis is below. The total points for each manager is noted at the start. The review is only for Premier League games and doesn’t include managers that had a brief spell under Fergie at Aberdeen or Scotland. Nor does it include managers in the post-Fergie period only (Ole Gunnar Solskjaer lost once against Manchester United in the post-Fergie era). In many ways Steve Bruce and Mark Hughes are the two observations worthy of analysis as they have racked up a significant number of matches in the pre and post Fergie Era. 

The Fergie Era Only
Bryan Robson – 5/39 From thirteen matches against Fergie, primarily with Middlesbrough but also with West Brom, Robson’s only took five points from his former manager. He had one famous 2-3 win in December 1998 where Boro held on for dear life at the end. Other than that Robson achieved a 3-3 draw in May 1997 and captured an important late point for West Brom in May 2005 against United which set them up for a heroic last day escape.

Gordon Strachan – 6/48 From sixteen matches, the Scot chalked up only two wins against Manchester United and his old manager. One memorable win happened when he managed Coventry and they beat United 3-2 thanks to a late Darren Huckerby goal in December 1997. The other win came when he managed Southampton. In August of 2003 James Beattie scored an 88-minute winner.  

Paul Ince – 0/3 Ince took on Fergie in one game as Blackburn manager back in October 2008. Blackburn lost 0-2 and Ince was not given the chance to manage the return fixture. He was sacked soon after the defeat.

Roy Keane – 0/6 Roy met Fergie on two occasions as Sunderland boss. He lost both. Sunderland failed to score in either. Keane was sacked just days before the United fixture the following season.

Pre and Post Fergie
Steve Bruce – Against Fergie 4/51, Post Fergie 1/12.  Overall: 5/63
Bruce has taken on United with a range of teams including Birmingham, Sunderland and Hull. Initially his teams found it difficult to even score against United and Fergie. In April 2004 (on Bruce’s fourth attempt) Martin Grainger scored in a 2-1 loss. His first point came in a home 0-0 draw in October 2005. He’s chalked up three other draws against Fergie over the years but never defeated him in the Premier League. Things haven’t gotten much better since Fergie has retired. He’s been defeated three times out of four in the post-Fergie period.

Mark Hughes Against Fergie 6/36, Post Fergie 8/21 Overall: Since Fergie has left, Hughes has come on. Last week’s point made it eight out of twenty-one in the post-Fergie era. He had two notable wins at the Britannia. A 2-1 victory in February 2014 and a 2-0 win last season. During Fergie’s reign things were grim. Apart from this memorable 4-3 win which saw David Bentley score a hatrick in November 2006, Hughes stuttered, picking up the odd draw at home for Blackburn and Fulham. He lost both Manchester Derbies (one in 'Fergie Time') while Manchester City manager.
 
While it's critical to admit Fergie had the beatings of most managers, his disciples above did not do well against him - 21 points out of a possible 183.

    Archives

    December 2022
    November 2022
    October 2022
    September 2022
    August 2022
    July 2022
    June 2022
    May 2022
    April 2022
    March 2022
    February 2022
    January 2022
    December 2021
    November 2021
    October 2021
    September 2021
    August 2021
    July 2021
    June 2021
    May 2021
    April 2021
    March 2021
    February 2021
    January 2021
    December 2020
    November 2020
    October 2020
    September 2020
    August 2020
    July 2020
    June 2020
    May 2020
    April 2020
    March 2020
    February 2020
    January 2020
    December 2019
    November 2019
    October 2019
    September 2019
    August 2019
    June 2019
    May 2019
    April 2019
    March 2019
    February 2019
    January 2019
    December 2018
    November 2018
    October 2018
    September 2018
    August 2018
    July 2018
    June 2018
    May 2018
    April 2018
    March 2018
    February 2018
    January 2018
    December 2017
    November 2017
    October 2017
    September 2017
    August 2017
    July 2017
    June 2017
    May 2017
    April 2017
    March 2017
    February 2017
    January 2017
    December 2016
    November 2016
    October 2016
    September 2016
    August 2016
    July 2016
    June 2016
    May 2016
    April 2016
    March 2016
    February 2016
    January 2016
    December 2015
    November 2015
    October 2015
    September 2015
    August 2015
    July 2015
    June 2015
    May 2015
    April 2015
    March 2015
    February 2015
    January 2015
    December 2014
    November 2014
    October 2014
    September 2014
    August 2014
    July 2014
    June 2014
    May 2014
    April 2014
    March 2014
    February 2014
    January 2014
    December 2013
    November 2013
    October 2013
    September 2013
    August 2013
    July 2013

    About

    This website was founded in July 2013.

    RSS Feed

    Categories

    All
    American Football
    Athletics
    Baseball
    Basketball
    Behavioural Economics
    Boxing
    Broadcasting
    Competitive Balance
    Cricket
    Cycling
    Darts
    David Butler
    Declan Jordan
    Drugs
    Ed Valentine
    Epl
    Esports
    Expenditure
    F1
    Fifa World Cup
    Finances
    Funding
    Gaa
    Gaelic Games
    Gambling
    Game Theory
    Gary Burns
    Geography
    Golf
    Greyhound Racing
    Guest Posts
    Horse Racing
    Impact Studies
    John Considine
    John Eakins
    League Of Ireland
    Location
    Media
    Mls
    Mma
    Olympics
    Participation
    Paul O'Sullivan
    Premier League
    Regulation
    Research
    Robbie Butler
    Rugby
    Simpsonomics
    Snooker
    Soccer
    Spatial Analysis
    Sporting Bodies
    Stephen Brosnan
    Swimming
    Taxation
    Teaching
    Technology
    Tennis
    Transfers
    Uefa
    Ufc
    World Cup
    Wwe

Related

The website is not formally affiliated to any institution and all of the entries represent the personal views and opinions of an individual contributor. The website operates on a not-for-profit basis. For this reason we decline all advertisement opportunities. 

Contact

To contact us email sportseconomics2013@gmail.com or find us on Twitter @SportEcon.