The Economics of Sport
  • Sports Economics
  • About
  • Workshop
  • Selected Publications
  • Book Reviews
  • A Primer on Gaelic Games
  • Upcoming Events
  • Media
  • Education
  • Resources & Links
  • Data

Thoughts on the Economics of Deadline Day

28/8/2017

 
By David Butler

The transfer window closes in three days’ time. Sometimes the hours before the close of the window are frantic. Regardless of the actual extent of transfer activity, ‘Deadline Day’ is treated with hysteria by the media. About seven permanent transfers (inward) occurred on this day in the Premier League over the last few years. Economists studying this type of last minute bargaining behaviour have labelled the tendency to cut last minute agreements as the ‘Deadline Effect’ . On the other hand, fans are often left wondering why deals are dragged out to the eleventh hour?

While there is lots of strategic behaviour going on, one key reason is that bargaining power, something which dictates the terms of trade, may shift the closer we get to a deadline. The true preferences of clubs may be expressed as time ticks on – in particular, one negotiators patience relative to another negotiator may be exposed.

This is particularly interesting for players with dwindling contracts. For instance, take the mooted transfer of Ross Barkley from Everton to Tottenham. Everton may have a reserve on Barkley; the later we get to the deadline however the more likely we are to see a true revelation of this valuation. Tottenham’s chairman Daniel Levy has built a reputation as a strong negotiator, willing to wait very late in the transfer window in order to cut a deal. This has occasionally been to the detriment of Tottenham’s performance earlier in the season but usually constitutes a shrewd business move. If Mr. Levy is patient relative to the other negotiating party, he may well be able to secure a better deal than at an earlier stage. That said, if more than one club becomes interested this strategy may fail.

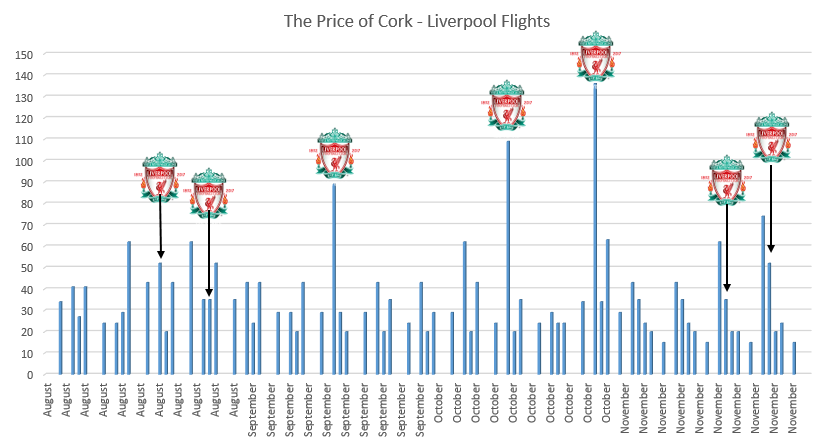
There are lots of strategic moves going on in the market – in the case of Coutinho, given the magnitude of the sums offered by Barcelona, it seems Liverpool have sought out commit to one bargaining position. Equally, it may be the case that they are seeking out a replacement prior to sanctioning a transfer.  A fine balance must be struck between maintaining the strength of a squad and securing a good sale – at times, one transfer can be hinged upon others. Hence, why many dominoes can fall on deadline day.

Recent calls have been made to close the window earlier, prior to the start of the season. Sporting motivations often underlie this sentiment. Namely, when squads are not fixed at the start of the season, managers find it difficult to prepare – there star striker could be sold two weeks in to the new season after all. Equally, there is an argument that some teams can gain an unfair advantage – the challenger may be a very different animal depending on whether you play them on week one or week four.

Moving the transfer window will likely have legal repercussions and there could be issues related to international rules. Even if the window is moved, while it may ensure parity regarding the second fairness concern, it may not change the likelihood of transfers – my hunch is that it would just shift the transfers back three weeks. At present the cost of the deadline three weeks in to the seasons starts are arguably carried by the managers, players and fans. Pushing the deadline back to the start of the season would ease this burden for those interested with action on the field but would increase the costs for those concerned with off-field business. Bargaining is time consuming after all, and summer transfer deals would have to be squeezed into a tighter window, putting an onus on those that must do the negotiating.

Explaining International Selection Using Poisson Modelling

25/8/2017

0 Comments

 
By Robbie Butler,

We recently learned a submission to the Journal of Economic Studies had been accepted and should appear in 2018. This research will be of interest to sports economics fans as it considers the impact that player-specific and regional differences have on the number of senior international appearances football players accumulate over their careers, for six UEFA member countries, from 1993 to 2014.
​
We employ a Poisson regression model to analyse this and find that both individual and regional variables can explain the number of caps a player receives over the course of their career. 

Not surprisingly, an individual's career length positively influences the number of international caps accrued. Players born in wealthier and more populous regions accumulate a greater number of international appearances. Thus it seems, investment rather than the jumpers for goalposts hypothesis, drives success in the modern game.

The distance a player is born from the capital has no effect, hence players are not a disadvantage if the are from more isolated regions in a country. That said, the number of youth academies in the player’s region of birth has a significant, positive effect.

Our analysis is limited to regional variations within economically developed states. It would be interesting to test whether the correlation between relative regional development and international success exists in less developed countries. 

The results can provide insights for local football authorities and policy makers concerned with regional characteristics and those interested in the development of elite talent.
0 Comments

Fergie Time and the Allocation of Additional Time

23/8/2017

0 Comments

 
By Robbie Butler

We recently had a paper published by the International Journal of Sport Finance which considers the question of Fergie Time. Our paper analysed referee decision making relating to the allocation of additional time for 1,515 English Premier League matches from 2009 to 2013. Using this large number of games, over four consecutive seasons, we were able to test if Fergie Time actually exists.

Despite what may fans might think, we found only limited evidence of a bias towards “big” clubs; what might be called Fergie Time. However, an examination of close matches finds no evidence of Fergie Time, suggesting its ability to alter tight matches is negligible.

We also report no evidence of home favoritism by referees in the English Premier League. On balance, when it comes to allocating additional time, the men in the middle are doing a very good job. A link to the full paper can be found here.
0 Comments

Cork-Liverpool & Strategic Pricing

18/8/2017

0 Comments

 
By Robbie Butler

For a country with a population that ranks just 29th in Europe and an economy that is approximately 1% of EU GDP it is quite an achievement that Ireland is home to the largest airline in Europe.

Founded in 1984 Ryanair has both the largest independent fleet in Europe with just under 350 aircraft and is set to knock Lufthansa Group of top spot for the first time this year in terms of the number of passengers carried. The low-cost carrier will probably top 120 million passengers by the end of December, an achievement made all the more remarkable given that it is just over 30 years old, and has followed its current strategy for the past twenty years.

What makes the airline so successful it is targeted pricing strategy. The dynamics of demand and supply and subsequent changes in price can all be witnessed by closer inspection from the data the airline provides on its websites. To demonstrate this I use a nice example from Cork Airport and the English Premier League.

As a Liverpool supported I decided I wanted to visit Anfield again. I was surprised to find that he Reds have just six league fixtures between the the start of the season on the 12th of August and the 30th of November 2017. Fortunately for me, Ryanair provide a service between Cork Airport and Liverpool Airport and I matched up possible fixtures with flight dates. The data for all flights from Cork to Liverpool (one-way) and the six Premier League match day is presented below.
Picture
Obviously, there is more than one reason why a passenger might leave Cork Airport and travel to Liverpool but given the club's large fan base in Cork and the surrounding region, Liverpool FC matches are among the primary reasons for travelling.

Between the dates considered, the most expensive ticket is €135.99. This is the day of Liverpool play Huddersfield at Anfield. The second most expensive day to travel is the 14th of October, the day Liverpool are home Manchester United, with a one-way flight from Cork to Liverpool costing €108.99. These are the only two times the price of a single fare exceeds €100. The third most expensive day to travel is the day Liverpool play Burnley at home with the flight costing €88.99.

To provide some context, Liverpool are away from home in the Premier League on the 12th of August, 9th of September and 23rd of September. Flights to Liverpool on these three days are priced at €23.99, €28.99 and €42.99 respectively. It is even possible to fly one-way for as little as €14.99 in November.

It will be interesting to see how the Champions League draw effects midweek prices, should Liverpool maintain their lead from the first leg. At the moment one could take a chance and hope Liverpool are at home on a given week and book flights. No doubt when the draw is made, and fixtures known, market forces will take over and we can again see the interaction of the demand and supply curves.

Flight data collected on the 26th of July 2017
0 Comments

500 Million Tinkermen?

14/8/2017

0 Comments

 
By Ed Valentine

It’s hard to tire of transfer rumours at the start of a new football season. But equally it’s hard to vary it much from year to year save for guessing the number of zeros in Neymar’s new weekly wage. With deals yet to be done club managers and agents will be ensuring the office fax machines have plenty of paper while their Gmail accounts are spam free and mobile phones are fully charged to ensure that ‘crucial’ signing is completed. The transfer window as presented on Sky Sports News’ Transfer Centre can often be replete with “In & Out” graphics on the presenter’s touch screen. This binary system encasing transfer talk gets great mileage in the media but across a 38 game domestic season fans do not observe the same approach to player appearances.

The graph demonstrates the percentage breakdowns of players who made an appearance in the 38 Premier League games in the 2016/17 season. The results are not too surprising though we do observe as many as 11 who have played in every game – 3 were goal keepers.
Picture
PicturePremier League Nationalities - Top 20


La Liga is not that different from the EPL. There is a similar trend of non-binary selection however this leans slightly more so towards an in – out philosophy than the EPL. Over the course a lengthy season with numerous cup games and internationals it’s no surprise that soccer sees blanket utilisation of squad players across the course of the season. Just six players appeared in every La Liga game last season, while 63 were seen in less than 10% of games.
 
What would be interesting to investigate is at what stage of the season do the players who are at the lower end of these bar charts rack up their appearances? Earlier would suggest they didn’t make the grade as time elapsed while late on in the campaign may represent the chance of a run out in place of an injured mainstay.
​
In some sports such as basketball, where 5 players per team are on the court at a time we’d expect to see numbers clustered at each end of the graph and practically nobody in the middle. This would demonstrate the binary mind-set where a player is either good enough to be in or he’s not. In the Premier League however, it appears that teams are largely made up of the homme moyen sensuel with Englishmen being the middlemost. This would also support the argument that managers should invest in the higher end of the average range instead of splashing out on one or two ‘big name’ signings. 

​Of the 540 players to make an appearance last season a third were English with Spanish and French talent being the 2nd and 3rd most represented. At the top 5 clubs only 14% were English. This suggests English players are largely average and are playing for largely average teams. While the Kyle Walkers of this world can command premium price tags, outfits outside the top 4 or 5 have to make do with the run of the mill players, essentially the Greggs Bakers of the Premier League player.

0 Comments

The Premier League 25 Years On

11/8/2017

 
By David Butler

With the Premier League beginning its 25th season tonight, its interesting to think about the evolution of the competition since 1992. Off the pitch, the economic growth of the industry, embodied by wage increases, transfer fee inflation, broadcast rights sales and the successful commercialisation of the ‘product’ stands out as the major development.

On the pitch, the internationalisation of the league is the most notable structural change for me. The influx of foreign talent has largely been a product of the Bosman ruling and the increasing wages on offer in the League. Notably, the increasing numbers of overseas players in the Premier League has been a controversial issue.

The charts below give an indication of the internationalisation of the Premier League over the last 25 years. The data for these charts has been gathered from multiple online sources and constitutes 15,162 individual observations.

The first chart displays the nationality of Premier League players in percentage terms by season based on whether they are English (white bars), from another EU country (light grey bars) or are non-EU (dark grey bars). In 1992, the majority of the talent in the league was from England.  Only 35% of the players for the 17/18 season are English. This is the joint lowest percentage in the history of the competition and the share of English born player in the league has fallen over the past 25 years.
Picture
As the Republic of Ireland, Northern Ireland, Scotland and Wales have had a strong connection to the Premier League over the years, the second chart shows the declining number of players  from the British Isles and Republic of Ireland playing in the league over the years. In 92/93 there was 541 players from the British Isles and the Republic of Ireland. This season there are 244 players from the region. Along with some seasons in the mid 2000’s, the last two seasons stand-out as more players from outside of the British Isles and Republic of Ireland region were contracted to Premier League Clubs.
Picture
The third chart is a count of the number of nationalities in the league over the years.  In 1992 there was 30 countries represented in the Premier League. There will be 65 represented this year. Armenia (Henrikh Mkhitaryan) were the newest arrival last season.
Picture

Biggest Fight Ever Or Sporting Mismatch?

9/8/2017

0 Comments

 
By Robbie Butler

In the early hours of Sunday the 27th of August an Irishman will be involved in one of the biggest sporting events of the year. Dubliner Conor McGregor is set to take on unbeaten boxer Floyd Mayweather Jr. at the T-Mobile Arena, Las Vegas. 

This fight is unique for many reasons, one being that the stadium it will be hosted in was built with private funds. The build-up to the fight has also been a step into the unknown for boxing, with a "world tour" and stops in North America and the UK used to promote the fight.

While many are excited about the prospect of MMA champion McGregor facing Mayweather, others have spoken about the mismatch in pitting the two against each other. Mayweather has boxed 49 times as a professional, with his first bout in 1996. The Grand Rapids native also had a successful amateur career, culminating with a bronze model at the 1996 Summer Olympics in Atlanta. McGregor has never fought a professional boxing fight.

Mayweather's lifetime earning also dwarf that of the Dubliner. The American reportedly earned $250 million for his fight with Manny Pacquiao in May 2015. McGregor received an estimated $8 million for his most recent UFC fight. 

This hasn't diminished interest, and despite the mismatch in some statistics, one that is much closer than people might expect is the pay-per-view buy-rate. The graphs below illustrates this for the fighters five most recent bouts.
Picture
Picture
The illustration on the left presents the cumulative earnings from the sale of each fighters bouts. Mayweather has grossed in excess of $9 million, with McGregor just under $6.5 million.

It should be noted, Mayweather's earnings include the record 4.6 million pay-per-view buys from his Pacquiao fight, followed by the collapse in interested associated with his 49th fight against Andre Berto, which generated just $400,000. McGregor's support has been more stable and constantly on the rise.

The graph on the right removes the Pacquiao and Berto outliers (one high, one low) and calculates the average earnings from the other three fights considered. This shows just how close the interest in both fighters is.

​I doubt the contest itself will be as close. 
0 Comments

Cork's New Stadium

2/8/2017

1 Comment

 
By Robbie Butler

The new Pairc Ui Chaoimh opened recently to much fanfare and hype. As is normal with such developments a variety of figures, running in millions, have been thrown about estimating just how much this will be worth to the local economy. 

The stadium's first major fixture was held recently and saw the meeting of Tipperary and Clare in an All-Ireland Senior Hurling semi-final. A local fixture was held three days before and attracted more than 10,000 spectators! In attendance on at the first inter-county game, were the President of the International Sport Economics Association Joel Maxcy and 2017 European Sports Economics Association Conference host Bernd Frick. 
Picture
Our 2017 Workshop speakers Bernd Frick and Joel Maxcy at the All-Ireland Senior Hurling QF.
Our two visitors were amongst many that had travelled to watch the game no doubt. Supporters had travelled in numbers from both Tipperary and Clare, all adding to the local economy. There was also significant local interest. Many from Cork have been waiting months to get a glimpse of the new stadium. 

Those that could not get a ticket for Saturday had another chance the following day as Waterford met Wexford in the second quarter-final. I was amongst these spectators and natural supported the Deise. The new stadium is a sight to behold and rivals many locations I have been to both nationally and internationally. The value of Pairc Ui Chaoimh to the local economy is another question entirely and is complex.

There are certainly winners. All the pubs within walking distance of the stadium must be delighted to see the return of regular fixtures. The hospitality sector in and around the stadium was a big winner. The extend to which "Cork" wins depends on how many people travelled from outside the county. You need to be very careful here. I travelled to watch Waterford but added nothing to the local economy as I am here anyway. Corkonians that when to take a look at the new stadium also fall into this bracket. The local economy only grows by the extend to which people travelled from Clare, Tipperary, Waterford and Wexford and spent their money in Cork.

Such economic impact assessments require a level of analysis rarely afforded to them. Take any figure estimating the economic impact of such events with a pinch of salt.   
1 Comment

    Archives

    March 2023
    February 2023
    January 2023
    December 2022
    November 2022
    October 2022
    September 2022
    August 2022
    July 2022
    June 2022
    May 2022
    April 2022
    March 2022
    February 2022
    January 2022
    December 2021
    November 2021
    October 2021
    September 2021
    August 2021
    July 2021
    June 2021
    May 2021
    April 2021
    March 2021
    February 2021
    January 2021
    December 2020
    November 2020
    October 2020
    September 2020
    August 2020
    July 2020
    June 2020
    May 2020
    April 2020
    March 2020
    February 2020
    January 2020
    December 2019
    November 2019
    October 2019
    September 2019
    August 2019
    June 2019
    May 2019
    April 2019
    March 2019
    February 2019
    January 2019
    December 2018
    November 2018
    October 2018
    September 2018
    August 2018
    July 2018
    June 2018
    May 2018
    April 2018
    March 2018
    February 2018
    January 2018
    December 2017
    November 2017
    October 2017
    September 2017
    August 2017
    July 2017
    June 2017
    May 2017
    April 2017
    March 2017
    February 2017
    January 2017
    December 2016
    November 2016
    October 2016
    September 2016
    August 2016
    July 2016
    June 2016
    May 2016
    April 2016
    March 2016
    February 2016
    January 2016
    December 2015
    November 2015
    October 2015
    September 2015
    August 2015
    July 2015
    June 2015
    May 2015
    April 2015
    March 2015
    February 2015
    January 2015
    December 2014
    November 2014
    October 2014
    September 2014
    August 2014
    July 2014
    June 2014
    May 2014
    April 2014
    March 2014
    February 2014
    January 2014
    December 2013
    November 2013
    October 2013
    September 2013
    August 2013
    July 2013

    About

    This website was founded in July 2013.

    RSS Feed

    Categories

    All
    American Football
    Athletics
    Baseball
    Basketball
    Behavioural Economics
    Boxing
    Broadcasting
    Competitive Balance
    Cricket
    Cycling
    Darts
    David Butler
    Declan Jordan
    Drugs
    Ed Valentine
    Epl
    Esports
    Expenditure
    F1
    Fifa World Cup
    Finances
    Funding
    Gaa
    Gaelic Games
    Gambling
    Game Theory
    Gary Burns
    Geography
    Golf
    Greyhound Racing
    Guest Posts
    Horse Racing
    Impact Studies
    John Considine
    John Eakins
    League Of Ireland
    Location
    Media
    Mls
    Mma
    Olympics
    Participation
    Paul O'Sullivan
    Premier League
    Regulation
    Research
    Robbie Butler
    Rugby
    Simpsonomics
    Snooker
    Soccer
    Spatial Analysis
    Sporting Bodies
    Stephen Brosnan
    Swimming
    Taxation
    Teaching
    Technology
    Tennis
    Transfers
    Uefa
    Ufc
    World Cup
    Wwe

Related

The website is not formally affiliated to any institution and all of the entries represent the personal views and opinions of an individual contributor. The website operates on a not-for-profit basis. For this reason we decline all advertisement opportunities. 

Contact

To contact us email sportseconomics2013@gmail.com or find us on Twitter @SportEcon.