The Economics of Sport
  • Sports Economics
  • About
  • Workshop
  • Selected Publications
  • Book Reviews
  • A Primer on Gaelic Games
  • Upcoming Events
  • Media
  • Education
  • Resources & Links
  • Data

Too good for his own good? A breakdown of Floyd’s next potential opponents

31/10/2013

 
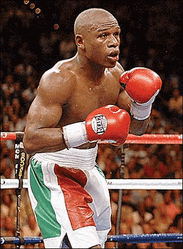
PictureWho is next for 'Money'?
By Gary Burns

While risk assessment and strategic decision making have positioned Floyd Mayweather far and above his peers, it may not be in this remit that his next opponent will be decided. He is contracted for another four fights with Showtime in the US, however finding four suitable, worthy opponents is another matter. Names being booted about include the three times beaten Brit, Amir Khan. 

Khans most recent victor Danny Garcia, Timothy Bradley, Adrien Broner and far reaching speculation of a bout with 48 year old light heavyweight Bernard Hopkins are names that have also been mentioned. Unfortunately for Mayweather his skill, talent and position as the most talented boxer of his generation means  that decisions concerning opponents are not as simple as sanctioning bodies official rankings.

The Contenders?
In the US a fight with Khan would not generate half as much attention as the record breaking Canelo fight however it
would have a positive effect on revenues in the United Kingdom. However, Khan is not even the best welterweight from the U.K., Kell Brook has overtaken him.

Bradley, coming off a decision victory over Juan Manuel Marquez, whom Mayweather dispatched with relative ease, does not have the style or fan backing to put up big PPV numbers. Problems in negotiations may also materialise with Bob Arum's Top Rank who promote Bradley, unwilling to negotiate with Golden Boy promotions that partially promote Floyd.

Garcia is an interesting opponent, particularly due to his position on the Mayweather/Canelo undercard, a ploy often used by promoters to generate interest in future bouts. But again there would be doubts as to his chances and whether the public would see him as a live opponent. Although a mix of Garcia’s father and Mayweather in the build up
to the fight would be worth the PPV fee alone.

Broner, I suggest,  would not be risked against Mayweather. He is being groomed as the ‘Next Floyd’ and therefore promoters want an extension strategy for boxing when Floyd finally decides to hang up his gloves. Broner is that strategy. Floyd does not need gimmicks. A catch weight fight with a 48, nearly 49 year old Hopkins would do nothing to enhance his legacy.

Perhaps then what the public has called for the last five years, a bout with Pacquiao may be one of the only viable option for Floyd. Manny, in his next fight, takes on Brandon Rios in a fight that could regniitie his career or perhaps the end of it. He has suffered two recent defeats including a devastating knockout loss to Marquez. Heavy knockout losses
of that nature have proved time and time again most difficult to rebound from. What Pacquiao has though is an international appeal, exciting style, huge support and an impressive career record. If Rios wins he could throw his hat in the ring, although less likely. Pacquiao seems the most likely opponent although the Top Rank stumbling block is evident here also.

Dark Horses?
Ruslan Provodnikov is an interesting fighter. His most recent destruction of Mile Alvarado has backed up his controversial loss to Bradley. If he can get one or two big wins under his belt in the next year, Floyd could consider him. What he also has is a loss on his record which unlike Bradley means he has less to lose. Kell Brook could also
fall into this category, but again not just yet.

Unfortunately for Floyd his career trajectory has simply not been matched by anyone of his ilk at present and has meant that in a sport with a unique competition structure, where opponents are chosen and not devised in a league/championship format, Floyd may have very few options if he is to end his career on a high which it so richly deserves. Floyd, however, will finish his career on his terms. You will not see Floyd fighting into his forties due to financial woes such as the once great Sugar Shane Mosley. Therefore the next year and most importantly next opponent will tell us a lot about how Floyd wants to end things. Five fights equates to about 2 and half years in boxing terms. Perhaps someone new will emerge, like Saul Canelo Alvarez.

But one thing is for certain, whoever Floyd decides to fight, it will be on his terms once again. More likely than not,
 Las Vegas, MGM Grand, 147lbs – 150lbs.

4000 Winners & Counting

30/10/2013

 
Picture
By Robbie Butler

Tony McCoy’s relentless pursuit of his 4000th winner continued yesterday at Ffos Las when the champion jockey rode his 3,991 national hunt winner. AP is now just nine winners short of the 4,000 winner milestone and has in the process put in place a record that will probably take generations to break. 

For those unfamiliar with national hunt racing, AP McCoy is somewhat of a living legend. He is the only jockey to be named BBC Sports Personality of the Year and has been British Champion National Hunt Jockey every year since 1996! That’s 18 championships in a row. McCoy currently stands on 109 winners for the 2013-2014 campaign and with 2nd placed Noel Fehily on 58 winners to date it hard not to see McCoy making it 19 titles in a row. 

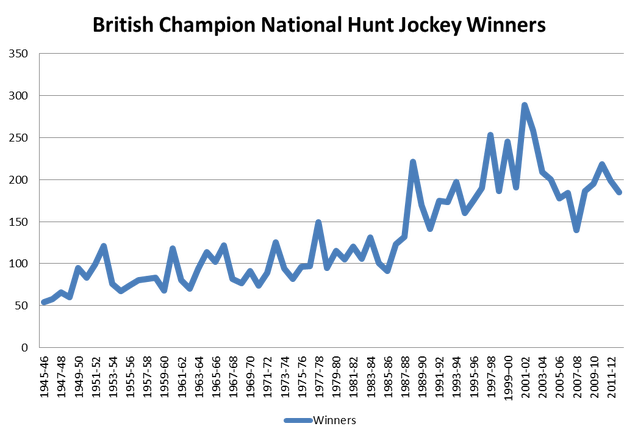
Remarkably, since 1980 only four men has held that title of British Champion National Hunt Jockey. John Francome (1980-1985), Peter Scudamore (1986-1992), Richard Dunwoody (1993-1995) and McCoy have had the honour. Other jockeys in the weigh-room must curse their luck at having come along in the same generation as AP. Jason Maguire (144) and Richard Johnson (133) both comfortably broke the 100 winner barrier last year but were still streets behind McCoy (185). During the 2011-2012 season, Johnson rode 153 winners and was still nearly 50 behind AP (199). In fact, a glance at the post-war history of the British Champion National Hunt Jockey’s list shows it’s getting harder to win .

Picture
During the 1945-1946 season, Fred Rimell was crowned British Champion National Hunt Jockey with just 54 wins. The average number of winners necessary to be crowned champion jockey from the end of the Second World War until the
end of the 1970s was less than 89. The dominance of Francome, Scudamore and Dunwoody raised the mean to 141. AP McCoy’s average number of winners since becoming Champion Jockey in 1996 is an incredible 205 per season! 

Outside of McCoy’s insatiable drive to win, other factors that have allowed this to happen include, more frequent race meetings, improvements in modern technology, relatively cheap air travel and enhanced horse and jockey nutrition. The use of helicopters and private aircraft now allows jockeys to ride at different courses on the same day, an unthinkable course of action during the days of Fred Rimell, Fred Winter and Stan Mellor. That said the passion of AP to win at even the smaller venues is unmatched. His 20th title is surely a matter of time and given his attitude who knows how many more he will win. 

Changes to retirement tax relief for sports people

25/10/2013

0 Comments

 
An interesting article in today's Irish Times by Ciaran Hancock shows that Irish sports stars are set to benefit from tax rule changes in the Finance Bill published yesterday. Previously, Irish sports stars were entitled to tax relief on their sports earnings (this would exclude income from sponsorship etc) on retirement but were required to finish their careers in Ireland to avail of the relief. The Finance Bill changes now mean that sports people no longer need to spend their final year before retiring in Ireland and it is suggested in the article that this was prompted by EU Commission concerns.

Sports people are only able to claim to relief on income earned while resident in Ireland.

John Considine wrote about this tax relief previously on this blog. He noted that the cost of this relief to the exchequer from 2003 to 2011 was pretty small but could increase dramatically in coming years. Yesterday's change is likely to contribute to that rise.
0 Comments

 Exchequer Funding & Irish Winners At The Cheltenham Festival

23/10/2013

 
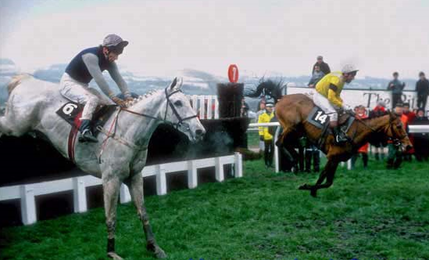
PictureDesert Orchard and Yahoo at the last fence in the 1989 Cheltenham Gold Cup
By Robbie Butler

In 1989 the much loved Desert Orchard trudged up the Cheltenham hill, narrowly defeating the John Edwards’ trained 25 to 1 shot Yahoo to win the Cheltenham Gold Cup.

Despite having won two King George VI Chases at Kempton in 1986 and 1988, doubts surrounded the great grey prior to the premier British jumps race. Questions marks were raised over ‘Dessie's’ ability to stay the gruelling three plus miles at Prestbury Park and, quite strangely, his ability to handle left-handed tracks! However, he was not to be denied and nearly 60,000 spectators watched Desert Orchard out-battle Yahoo up the Cheltenham hill. Jockey Simon Sherwood said after the race "I've never known a horse so brave. He hated every step of the way in the ground and dug as deep as he could possibly go".

The story of Desert Orchard is among the most popular of any racing story, with the year 1989 emblazoned in Cheltenham folklore.

But 1989 is also important for another reason. It was the last year there was no Irish trained winner at the March Cheltenham Festival. Since then the Irish have gone from strength to strength, breaking into double figures on three occasions; 2006 (10 winners), 2011 (13 winners) and 2013 (14 winners). In fact, last year's Festival saw a record number of Irish winners, with fourteen victories from twenty-seven races meaning Ireland won more than 50% of all races, beating the number of British trained winners for the first time. 

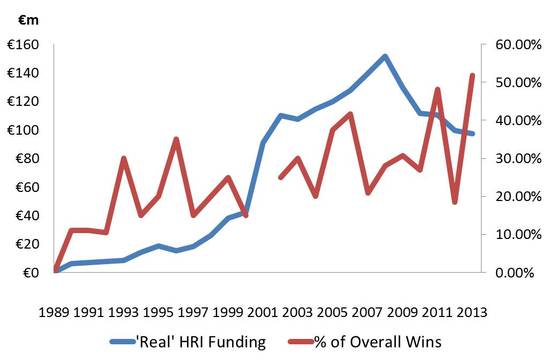
The rise since 1989 has been nothing short of remarkable and can be attributed to the increased amount of exchequer funding directed to the Irish horse racing industry. The graph below plots the annual level of investment given to Horse Racing Ireland (inflation adjusted) and the percentage of Irish trained winners at the March Cheltenham Festival. 

Picture
This bivariate relationship reports an adjusted R² of almost 0.6. That is, roughly 60% of the variation in the number of Irish winners can be explained by the level of exchequer funding.  

Since 2008 the level of direct funding to the horse racing industry has declined year on year in both nominal and real terms. While the number of Irish winners at the Festival peaked last year despite the recent cuts in government support, it’s likely there will be a lagged negative effected.

2014 exchequer estimates have not yet been fully published but it’s predicted the industry will see a further reduction in direct state support. The implication of this could mean breaking the record of fourteen winners, set last year, may be many years away. Only time will tell. 

African nations, the World Cup and fair representation

22/10/2013

0 Comments

 
by Declan Jordan
Picture
The nature of making predictions is that when they turn out to be wide of the mark they can be dragged up again and again. I am sure Pele is very tired of being reminded how, in 1977, he predicted an African world cup winner by 2000. The best that African teams have managed is reaching the quarter finals (Cameroon in 1990, Senegal in 2002 and Ghana in 2010).

There is of course a danger in discussing how a continent performs since there is just as much variation in the more successful continents than there are in the less successful ones. Also, it has to be remembered just how difficult (and rare) to win a World Cup. 8 different nations have won the World Cup (3 from South America and 5 from Europe). To put this in context, 166 countries entered qualification for Brazil 2014.

African football continues to be looked down on, despite some of the top players in world football hailing from Africa. Giovanni Trappatoni suggested recently that his next role after the Ireland job may be in Africa. He said he is "intrigued by Africa, who still have tactical naivete". (Perhaps I am still upset that he believes after four years in charge of Ireland he thinks we don't have our own league). By definition stereotypes are hard to change and I believe this is even stronger in sport.

So perhaps it's worth considering the performance of African countries from a different perspective. That there are fewer African teams reaching the later stages of the World Cup may be due to them having fewer teams entering the World Cup finals. In the four tournaments since 1998 there have been 5 African qualifiers (in 2010 there were 6 because South Africa were hosts). Prior to that there were 3 in 1994, 2 in the three tournaments to 1990 and 1 in the three tournaments in the 1970s. Apart from an appearance by Egypt in 1934 there were no African participants prior to 1970.

In next year's finals in Brazil there will be 5 African nations from 52 qualifiers, while Europe will have 13 from 53 qualifiers. Asia will have 4 from 43 qualifiers (presuming Uruguay beat Jordan), North, Central America and the Caribbean will have 4 from 35 (assuming Mexico beat New Zealand) and finally South America will have 5 from 9 (plus the hosts Brazil making it 6 from 10).

Africa, despite having more than 5 times as many nations, have the same number of qualifiers as South America.


Africa's record at World Cup finals is not as poor as popular myth may suggest. With a similar representation as South America their teams do relatively well. Brazil and Argentina fly the flag for South America and without them the record for South American since the 1980s is not strong. Since 1986 at least one African nation has qualified from the pool stages and as noted earlier 3 have qualified for the quarter finals. In the same period 4 different South American nations have qualified for quarter finals. Excluding Brazil and Argentina, only Paraguay and Uruguay have reached the last 8 since 1986, and both of those in the most recent World Cup in South Africa 2010. 

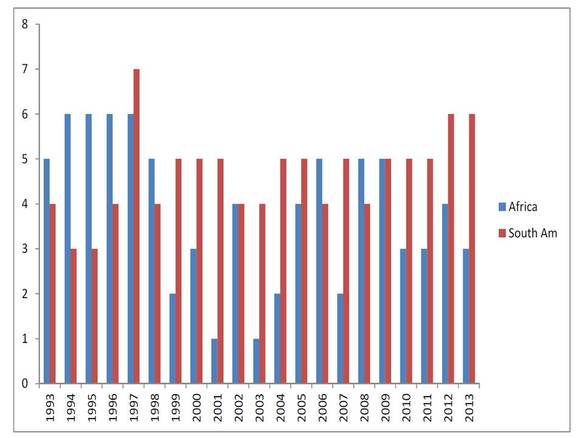
If South America's high proportion of finals places if based on FIFA ranking then there is something of a circular logic, as rankings are boosted by performances against other higher ranked teams. Appearing at the World Cup final provides further boost to rankings. The table below however shows the number of nations from Africa and South America in the top 30 FIFA ranking spots each December since 1993 (the 2013 figure is for October).

Picture
The graph shows that there is a high proportion of the South American teams in the top 30 (sometimes over half). But in absolute terms the African performance compares very well. When considering that these teams rarely play high ranked nations competitively (at World Cup finals mostly) the performance is even more significant,

The division of FIFA into separate federations creates a situation where each federation looks to protect their own and this can mean persistent under or over representation by nations in those federations. In the current qualification Australia moved from Oceania to Asia because the Oceania representatives must go into a play-off with the fifth South American nation and in a two-legged tie this is a big ask for a nation from Oceania.

A rebalancing of the representation of each federation may be warranted to encourage nations in football's developing regions. Perhaps adding South America to Central, North American and Caribbean. However, politics will dominate and there is likely to be conflicting national, federation and FIFA objectives. 
0 Comments

How Good Might 'Yugoslavia' Be?

19/10/2013

 
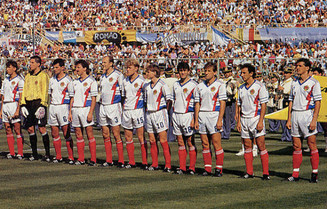
PictureYugoslavia Vs Argentina at Italia '90
By Chris Herlihy & Robbie Butler

On the 30th of June 1990 Ireland’s World Cup fairy tale came to an end in the Italian capital Rome following a single goal by Italy's Toto Schillaci. The very same evening, 280 kilometres north of the Eternal city in Florence, Yugoslavia exited the competition following a penalty shoot-out defeat at the hands of Diego Maradona’s Argentina. While Ireland would be seen again four years later at USA ’94, the nation of Yugoslavia would never again appear in that guise! 

In June 1991 Croatia and Slovenia, both then part of Yugoslavia declared independence. In September of the same year, the Republic of Macedonia followed suit, plunging the country into one of the bloodiest civil wars of the 20th century.  As the nation, which in 1991 was made up Slovenia, Bosnia, Croatia, Serbia, Macedonia, Montenegro and the autonomous provinces of Kosovo and Vojvodina, disintegrated with the onset of civil war, so too did the national football team. By 1992, despite having topped their qualification group for Euro ’92, the national team was unable to compete in Sweden. Yugoslavia were replaced by the runners-up in their group, Denmark of all teams! And they rest, as they say, is history.

The sad demise of a proud footballing nation, which first played at the Summer Olympics held in Antwerp, Belgium in 1920, was complete. Over the years of their existence, the Yugoslav national team had participated in eight World Cups, four European Championships and had won the Gold Medal at the 1960 Olympic Games in Rome, coincidently defeating Denmark in the final. In 1987, Yugoslavia won the U-20 World Youth Championship held in Chile. 

With qualification for Brazil 2014 almost complete, only Bosnia will certainly be at the World Cup next year, while Croatia are one of the four seeded teams entering the play-offs. Serbia, Slovenia, Macedonia and Montenegro have all failed to qualify.

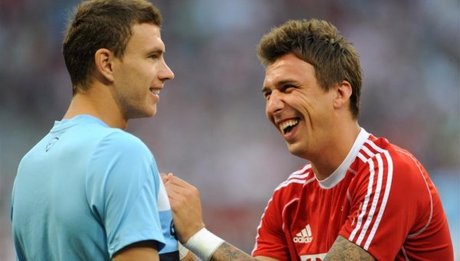
PictureDzeko (Bosnia) & Mandzukic (Croatia) would be eligible to player for 'Yugoslavia'
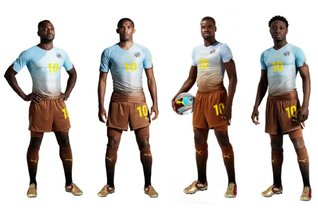
With this in mind we decided to put together a possible ‘Yugoslavia’team to see what the national team might look like had a break-up never occurred. This is purely fictitious and based on our own opinions of the 'best’players. 

Goalkeepers: Asmir Begovic (Stoke & Bosnia), Samir Handanovic (Inter Milan & Slovenia), Mladen Bozovic (Tom Tomsk & Montenegro). Defenders: Nemanja Vidic (Man United & Serbia), Branislav Ivanovic (Chelsea & Serbia), Aleksander Kolarov (Man City & Serbia), Darijo Srna (Shaktar Donetsk & Croatia), Neven Subotic (Dortmund & Serbia), Matija Nastasic (Man City & Serbia), Stefan Savic (Fiorentina & Montenegro). Midfielders: Luka Modric (Real Madrid & Croatia), AleksanderIgnjovski (Werder Bremen & Serbia), Miralem Pjanic (Roma & Bosnia), Simon Vukcevic (FK Vojvodina & Montenegro), Nikia Jelavic (Everton & Croatia), Niko Kranjcar (QPR & Croatia), Milos Krasic (Bastia & Serbia), Andrej Modic (AC Milan & Bosnia). Forwards: Edin Dzeko (Man City & Bosnia), Stevan Jovetic (Man City & Montenegro), Mario Mandzukic (Bayern Munich & Croatia), Mirko Vucinic (Juventus & Montenegro), Goran Pandev (Napoli & Macedonia).

Players who could have played for Yugoslavia include Xherdan Shaqiri (Switzerland), Granit Xhaka (Switzerland) & Zlatan Ibrahimović (Sweden). It's difficult to argue the above squad would not challenge for a World Cup or European Championship based on the current form of the squad for their respective clubs and countries.

Chris Herlihy is a former student of UCC graduating with an MA (Economics) in 2010. He is a avid sports fan and has played junior soccer in Cork for UCC among other clubs. He currently works in the Irish financial services sector.

When does seeding become restrictive practice? Why FIFA should use in-tournament seeding

18/10/2013

2 Comments

 
by Declan Jordan
Picture
France have lodged a complaint this week with FIFA about  the 'unfair' seeding system on which the draw for the play-offs for the European World Cup qualifiers is based, Irish football supporters with sympathy for the French in a row over a World Cup playoff will be as rare as hen's teeth. In any event, France are not complaining about the use of seeding per se but that countries in smaller groups have fewer opportunities to earn ranking points. However, why seeding is used at all for play-off games has to be questioned.

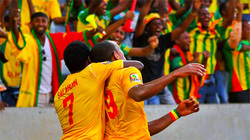
While most of the attention of those around me were on the final games in the European groups for next year's World Cup, my focus has been the David and Goliath struggle between Ethiopia and Nigeria. This is in the play-off for the five African qualifiers for Brazil 2014. The African qualifiers are quite drawn out affairs. (It makes a county GAA championship look straightforward). 

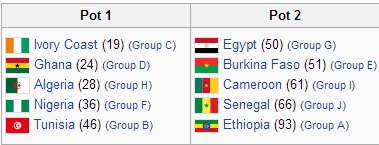
52 nations started out on the road to qualification in November 2011. The lowest ranked 24 countries were drawn to play on a home and away basis with the winning 12 joining the higher ranked 28 in 10 groups of 4 teams. The winners of those 10 groups were drawn on a home and away basis with the five winners taking the planes to Brazil. The draw for the initial two-legged play-off was seeded based on FIFA rankings. The draw for the groups was also seeded and the draw for the final play-offs were also seeded based on FIFA rankings. FIFA rankings are very important and tend to favour the more successful nations heavily.
Picture
The experience of the Ethiopian team in this qualification campaign poses an interesting case for the use of seeding in tournaments, and in particular for play-off places. The FIFA rankings in July 2011 were used to identify the lowest ranked 24 teams for the initial playoffs. Ethiopia were in that group and had to play Somalia for a place in the group stages. (Somalia's campaign for the 2014 World Cup involved two games on the 12th and 16th of November 2011). Ethiopia were then drawn as fourth seeds in a group with South Africa, Botswana and Central African Republic. They topped that group despite having 3 points deducted for fielding an ineligible player against Botswana. Their reward for topping that group was to be drawn against current African champions Nigeria in a two-legged play-off. And here is the rub, should nations that finish on top (or second) in a group that was based on seeding be subsequently seeded in a play-off between all the other top placed teams? Does there come a point when seeding becomes more of a restrictive practice and a barrier to competitive balance than an attempt to ensure the best teams remain in a tournament?

There are several reasons why sports bodies use seeding. It rewards past performance (though in some sports, including the "sport" of horse-racing, organisers penalise past performance by handicapping, as they do in golf). Also, it ensures the best teams or players are more likely to be kept apart until later in a tournament which may increase interest from spectators (and associated revenue).

If a sports body is to use seeding then how it implements it has (by definition) a critical impact on the likely outcome of the games and tournament. So what system balances the needs of the sports body for big games and the need to ensure tournaments are decided on merit. I'd argue that the seedings should be based on the most up-to-date information about teams or participants and this would mean, where possible, seeding based on performance within the tournament.

However, it has to be remembered that FIFA rankings are based on performances over 4 years. So a team like Ethiopia that emerges to challenge the big guns of African football will find it harder to break through due to the use of seeding based on performances several years ago (which are heavily weighted in favour of those teams that qualified for the last World Cup finals). Based on the results from last weekend's play-offs, it is likely that Africa will have the same five representatives in Brazil 2014 as they had in Germany in 2010 (Cameron, Nigeria, Cote D'Ivoire, Algeria and Ghana).

At the start of a tournament, for example a World Cup qualifying campaign, it is reasonable for the organisers to use performance in previous tournaments to seed players or teams. This is used in tennis, football, rugby and many other sports. However, once a tournament is under way the organisers have more up-to-date information on which to base seeding in later rounds. Perhaps football could learn from other sports. For example in the Heineken Cup the quarter final draw is not based on historical rankings (which are used to allocate teams in the group stages) but rather the teams' performances in the group stages determine the seeding of the quarter final draw. The team with the best points total in the groups is drawn against the qualifying team with the worst performance. And 2nd, 3rd and 4th are drawn against 7th, 6th and 5th respectively. This creates an incentive for every game because even teams that have won their group will want to continue winning to ensure they get as good a draw (and a home quarter final) in the next round.

Other examples include athletics and swimming where lane allocation (an important influence on the race outcome) is based on finishing times in the heats, rather than whether a particular sprinter or swimmer is the gold medallist from the last Olympics. These have the added benefit of ensuring every heat is a meaningful race in itself.

If the African Football Federation (CAF) had used the same system as the Heineken Cup for example the play-off draw would have pitted Ethiopia (7th best finishers - though they would have been 2nd best without the points deduction) against Cote D'Ivoire. Interestingly, Nigeria would have been ranked 9th and would have faced Ghana (who demolished Egypt 6-1 this week) while African Nations Cup runners up Burkina Faso would have been the worst placed team and played Egypt. It would also have meant that top ranked teams in the group would not just be targeting a top place within their group but also fighting for every point and extra goal difference right down to the final match to ensure a better draw in the final round.

Ethiopia were unlucky to lose to a last minute penalty in Addis Ababa last weekend and so next month will have a tough task in the return leg in Calabar. But it seems for the developing football nations in Africa this is par for the course,
Picture
2 Comments

A Crash With No Debts

16/10/2013

 
By Ed Valentine

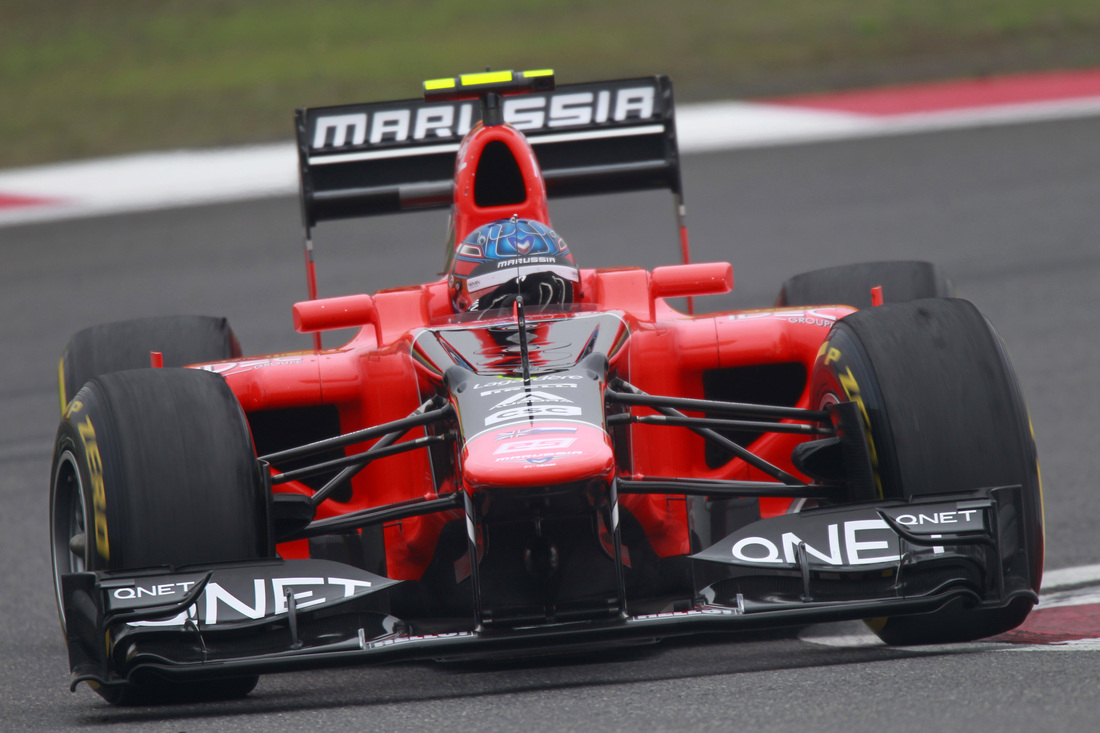
Formula 1 teams are heading for a major crash. Within the next 18 months the “smaller” independent teams who make up the midfield and back of the grid will face serious challenges to continue to compete as costs will rise significantly. With the introduction to a new set of technical regulations from 2014 onwards more expensive machinery (in the form of different power-trains and engines) will need to be developed. F1 team owners and investors will be tightening their seat belts at the prospects of having to fork out up to an extra $25 million next season to cover the increases. "We have made some mistakes with introducing the new power-trains, we didn't control the costs enough, and the sport may well pay the price of that very soon," says Martin Whitmarsh boss of McLaren.
 
Last month Marussia, the team who finished last in the 2012 championship, announced record losses of $56 million. Though Marussia F1 is not in debt, it’s not a widely held belief in the paddock that such a trend can continue for much longer, especially with the new prize money structure that was put in place in 2004. Prize money is differed for three years, in order to encourage commitment to go racing; Marussia received nothing last season and so had to raise money from sponsors and road car sales from the parent company thus treating Formula 1 as a very expensive form of advertising. 

The prize money is divided up based on championship position (previously it was divided up based on the amount of points scored in the championship where the amount won was a ratio of the top championship winning team’s total) which means that 1st place in the table will have a pre assigned amount and so once the championship positions have been decided, usually with a number of races remaining, there is little incentive to ramp up a greater points hall.
Picture
Currently, 10 of the 11 teams get a share of 60% of the profits but 70% of that is divided among the top 5 teams with the next 5 sharing 30%. The 11th place team gets nothing. The teams receive no money for the driver winning the championship nor does the driver receive any financial reward. Don’t feel sorry for them however as they command large sponsorship endorsements and salaries far greater than any footballer.
 
The average team budget has been reduced from $282 million per team in 2009 to $161 million in 2010 and $150 million in 2011 – in-line with a cost-cutting drive – that figure is skewed somewhat by the arrival of newcomers Lotus and Marussia. However this figure is likely to increase dramatically over the coming seasons and it is expected that some constructors will have to put the brakes on going racing. Ferrari spent $240 million in 2012 which left Marussia’s $51 million budget at the side of the road.

Despite massive bills and relatively little prize money no F1 team has ever registered as going into debt. Debt doesn’t exist in F1 like it does in football. This is due to the mechanisms in place for gaining entry and being permitted to continue in the franchise. Access to the Formula 1 roulette wheel requires financial guarantees from the moment an entry enquiry is made. A prospective team must fulfil strict monetary criteria that are designed to ensure that a competitor has enough cash to survive for at least two seasons. 

Part of this requirement is that the prospective team lodges about $60 million dollars into a locked bank account 3 months before the start of the season. This account can not be touched and therefore acts as a threshold or cushion of
capital. If a team ever attempts to access these funds it is deemed that financial credentials are not strong enough to grant further access to the franchise and the team must fold.  It happened to Super Aguri Honda midway through 2008, the last time a team has checked out before the season’s end, when the team had a liquidity problem and so folded rather than borrow money. It’s a mechanism that has seen 124 teams enter and leave the F1 World Championship with Ferrari being the only ever present since the championship began in 1950. It  also highlights how financially strong the business end of the Formula 1 franchise is. In 2007 McLaren were forced to pay a $100 million fine for spying on another team. They remained in contention for the championship that season and won the driver’s title with Lewis Hamilton a year later. It sends out a strong message that a team can let go of $100 million and carry on competing in an industry with stringent financial controls and massive outgoings. It’s a tight policy but it has ensured that there are no “cut price” attempts to go racing resulting in large arrears.

FIFA World Rankings Explained!

15/10/2013

 
By Robbie Butler

The FIFA World Rankings have existed since 1992 and act as a mechanism for seeding teams in qualification and tournament final groups. Significant changes were implemented to the rankings in January 1999 and again in July 2006, as a reaction to criticisms of the system. With the draw for Euro 2016 qualifiers to be held early next year in Nice, I thought it might be a good idea for me to understand exactly how FIFA calculates the ranking co-efficient for each member country. Here's how.
 
A team’s total number of FIFA World Ranking Points over a four-year period is determined by adding together:

1. The average number of points gained from matches during the past 12 months and
2. The average number of points gained from matches older than 12 months (depreciates yearly).

In order to understand how the average number of points gained from matches during the past 12 months is calculated let’s consider the calculation of points for a single match. The number of points that can be taken from any given game is dependent upon four variables:

1. The result in the match (M)
2. How important the match is e.g. finals game, qualifier, friendly, etc. (I)
3. The world ranking of the opposition and (T)
4. The confederation to which the countries belong (C).  
Picture
The Result: Teams get three points for a win, two points for a penalty shoot-out victory, one point for a draw, one point for a penalty shoot-out defeat and zero points for a loss.

Importance: Friendly matches are awarded a rating of 1.0, FIFA or Confederation-level qualifiers (Euros, African Cup
of Nations qualifiers) are awarded a rating of 2.5, Confederation-level finals and the Confederations Cup are rated as 3.0, while the FIFA World Cup finals matched have a weighing of 4.0 and are hence deemed the most important of all international matches.  

Opposition: The strength of the opponents is based on the formula: 200 minus the ranking position of the opponents. As an exception to this formula, the team at the top of the ranking is always assigned the value 200 and the teams ranked 150th and below are assigned a minimum value of 50. The ranking position is taken from the opponents’ ranking in the most recently published FIFA World Ranking.

Confederation: Each confederation is assigned a ‘strength’. UEFA and CONMEBOL (South America) are both assigned a value of 1.00. CONCACAF (generally Central and North America) is assigned a weight of 0.88. ACF (Asia) and CAF (Africa) are given a value of 0.86. OFC (Oceania) is deemed the weakest of the six confederations and assigned a ‘strength’ value of 0.85.  
Picture
Let’s consider last Friday night when Ireland went up against Germany.

1. (M) The result in the match: 3 – 0 Germany
2. (I) Important of the match: World Cup Qualifier
3. (T) The world ranking of the teams. Germany 3; Ireland 59
4. (C) The confederation to which the countries belong. UEFA

 
To find out the points Germany receive from winning this game we simply calcuate the following equation:                                  
                                                                                     M x I x T x C 

Germany get a value of 3 for (M). World Cup Qualifiers are assigned an importance value (I) of 2.5. Ireland were ranked 59thon the night so (T) equals 200 – 59 = 141. UEFA games are assigned a ‘strength’value of 1.0.

Therefore are formula reads:                             3 x 2.5 x 141 x 1 = 1,057.5

This is the number of FIFA world ranking points Germany won on Friday night and is added to the total number of points won over the past twelve months and divided by the number of games to find out the average number of points gained from matches since September 2012.

Had Ireland won the game the number of points awarded would have been:

                                                                              3 x 2.5 x 198 x 1 = 1,485

A draw would have seen Ireland get 495 points and the Germans 352.5.

The final step of the  calculations is to include matches older than twelve months within the last four-year. These games are depreciated on a yearly basis as follows:       
  • Match average from previous year: 50% ·  
  • Match average from year 3: 30%     
  • Match average from year 4: 20%
  • Matches older than 4 years: 0% (deleted) 

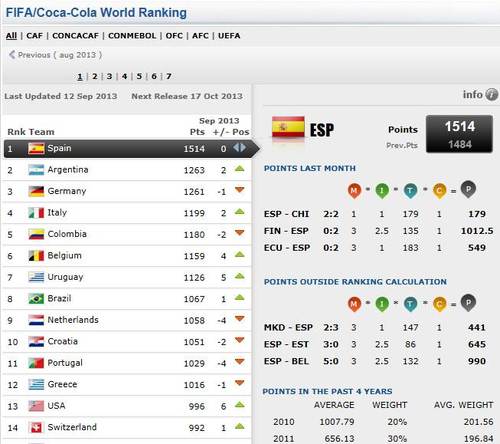
Spain currently top the list on 1,514 while Ireland languish in 59th place, our lowest ranking ever, on just 570 points.

The Future of the America's Cup

14/10/2013

0 Comments

 
By John Considine
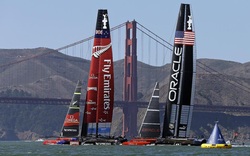
For those who were interested, last month America’s Cup produced one of the most remarkable comebacks in sporting history.  Oracle Team USA recovered from an 8-1 deficit to win the competition 9-8.  It seemed few knew about it and few cared.  The event sparked an editorial in the Financial Times and a couple of letters to the editor.  The editorial raised questions about the future popularity of the competition.  It questioned the approach of Larry Ellison to increase the costs of the yacht race to a point were only a handful of competitors are possible.  Some of the letters to the editor opposed this view and pointed out the improved TV spectacle.  There was also support for the editor's view in the letters.
Picture
As winner of the previous America’s Cup, Larry Ellison decided the terms of the current competition.  For example, he decided where the competition would be held and on what terms.  The Financial Times claim his decision to opt for a high-cost model damaged competition, reduced the number of countries with a competing yacht, and diminished the overall popularity of the competition.  The FT pointed out that the America's Cup was known as the 100 Guinea Cup in 1851 but is now a £100m race.

The 2013 event was not the spectacular success it was forecast to be. Bloomberg Sportfolio carried an informative piece on the San Francisco event (here).  A 2010 report claimed that the event would generate a windfall of $1.4bn for the city, generate 900 jobs and rejuvenate the bay area.  The optimism of the report proved misplaced.  The number of competing team dropped to 4 from the estimated 15.  The $100m promised by organisers to redevelop piers and boathouses was not forthcoming. The city’s taxpayers will have to pick up at least $22m of those costs.

The rules of the America’s Cup vests the winner of the competition with huge power over the next event.  As winner of the 2013 event Larry Ellison has that power.  With that power comes responsibility to the future of the competition.  It will be interesting to see how he decides.

0 Comments
<<Previous

    Archives

    February 2023
    January 2023
    December 2022
    November 2022
    October 2022
    September 2022
    August 2022
    July 2022
    June 2022
    May 2022
    April 2022
    March 2022
    February 2022
    January 2022
    December 2021
    November 2021
    October 2021
    September 2021
    August 2021
    July 2021
    June 2021
    May 2021
    April 2021
    March 2021
    February 2021
    January 2021
    December 2020
    November 2020
    October 2020
    September 2020
    August 2020
    July 2020
    June 2020
    May 2020
    April 2020
    March 2020
    February 2020
    January 2020
    December 2019
    November 2019
    October 2019
    September 2019
    August 2019
    June 2019
    May 2019
    April 2019
    March 2019
    February 2019
    January 2019
    December 2018
    November 2018
    October 2018
    September 2018
    August 2018
    July 2018
    June 2018
    May 2018
    April 2018
    March 2018
    February 2018
    January 2018
    December 2017
    November 2017
    October 2017
    September 2017
    August 2017
    July 2017
    June 2017
    May 2017
    April 2017
    March 2017
    February 2017
    January 2017
    December 2016
    November 2016
    October 2016
    September 2016
    August 2016
    July 2016
    June 2016
    May 2016
    April 2016
    March 2016
    February 2016
    January 2016
    December 2015
    November 2015
    October 2015
    September 2015
    August 2015
    July 2015
    June 2015
    May 2015
    April 2015
    March 2015
    February 2015
    January 2015
    December 2014
    November 2014
    October 2014
    September 2014
    August 2014
    July 2014
    June 2014
    May 2014
    April 2014
    March 2014
    February 2014
    January 2014
    December 2013
    November 2013
    October 2013
    September 2013
    August 2013
    July 2013

    About

    This website was founded in July 2013.

    RSS Feed

    Categories

    All
    American Football
    Athletics
    Baseball
    Basketball
    Behavioural Economics
    Boxing
    Broadcasting
    Competitive Balance
    Cricket
    Cycling
    Darts
    David Butler
    Declan Jordan
    Drugs
    Ed Valentine
    Epl
    Esports
    Expenditure
    F1
    Fifa World Cup
    Finances
    Funding
    Gaa
    Gaelic Games
    Gambling
    Game Theory
    Gary Burns
    Geography
    Golf
    Greyhound Racing
    Guest Posts
    Horse Racing
    Impact Studies
    John Considine
    John Eakins
    League Of Ireland
    Location
    Media
    Mls
    Mma
    Olympics
    Participation
    Paul O'Sullivan
    Premier League
    Regulation
    Research
    Robbie Butler
    Rugby
    Simpsonomics
    Snooker
    Soccer
    Spatial Analysis
    Sporting Bodies
    Stephen Brosnan
    Swimming
    Taxation
    Teaching
    Technology
    Tennis
    Transfers
    Uefa
    Ufc
    World Cup
    Wwe

Related

The website is not formally affiliated to any institution and all of the entries represent the personal views and opinions of an individual contributor. The website operates on a not-for-profit basis. For this reason we decline all advertisement opportunities. 

Contact

To contact us email sportseconomics2013@gmail.com or find us on Twitter @SportEcon.