By Robbie Butler
The FIFA World Rankings have existed since 1992 and act as a mechanism for seeding teams in qualification and tournament final groups. Significant changes were implemented to the rankings in January 1999 and again in July 2006, as a reaction to criticisms of the system. With the draw for Euro 2016 qualifiers to be held early next year in Nice, I thought it might be a good idea for me to understand exactly how FIFA calculates the ranking co-efficient for each member country. Here's how.
A team’s total number of FIFA World Ranking Points over a four-year period is determined by adding together:
1. The average number of points gained from matches during the past 12 months and
2. The average number of points gained from matches older than 12 months (depreciates yearly).
In order to understand how the average number of points gained from matches during the past 12 months is calculated let’s consider the calculation of points for a single match. The number of points that can be taken from any given game is dependent upon four variables:
1. The result in the match (M)
2. How important the match is e.g. finals game, qualifier, friendly, etc. (I)
3. The world ranking of the opposition and (T)
4. The confederation to which the countries belong (C).
The Result: Teams get three points for a win, two points for a penalty shoot-out victory, one point for a draw, one point for a penalty shoot-out defeat and zero points for a loss.
Importance: Friendly matches are awarded a rating of 1.0, FIFA or Confederation-level qualifiers (Euros, African Cup
of Nations qualifiers) are awarded a rating of 2.5, Confederation-level finals and the Confederations Cup are rated as 3.0, while the FIFA World Cup finals matched have a weighing of 4.0 and are hence deemed the most important of all international matches.
Opposition: The strength of the opponents is based on the formula: 200 minus the ranking position of the opponents. As an exception to this formula, the team at the top of the ranking is always assigned the value 200 and the teams ranked 150th and below are assigned a minimum value of 50. The ranking position is taken from the opponents’ ranking in the most recently published FIFA World Ranking.
Confederation: Each confederation is assigned a ‘strength’. UEFA and CONMEBOL (South America) are both assigned a value of 1.00. CONCACAF (generally Central and North America) is assigned a weight of 0.88. ACF (Asia) and CAF (Africa) are given a value of 0.86. OFC (Oceania) is deemed the weakest of the six confederations and assigned a ‘strength’ value of 0.85.

Let’s consider last Friday night when Ireland went up against Germany.
1. (M) The result in the match: 3 – 0 Germany
2. (I) Important of the match: World Cup Qualifier
3. (T) The world ranking of the teams. Germany 3; Ireland 59
4. (C) The confederation to which the countries belong. UEFA
To find out the points Germany receive from winning this game we simply calcuate the following equation:
M x I x T x C
Germany get a value of 3 for (M). World Cup Qualifiers are assigned an importance value (I) of 2.5. Ireland were ranked 59thon the night so (T) equals 200 – 59 = 141. UEFA games are assigned a ‘strength’value of 1.0.
Therefore are formula reads: 3 x 2.5 x 141 x 1 = 1,057.5
This is the number of FIFA world ranking points Germany won on Friday night and is added to the total number of points won over the past twelve months and divided by the number of games to find out the average number of points gained from matches since September 2012.
Had Ireland won the game the number of points awarded would have been:
3 x 2.5 x 198 x 1 = 1,485
A draw would have seen Ireland get 495 points and the Germans 352.5.
The final step of the calculations is to include matches older than twelve months within the last four-year. These games are depreciated on a yearly basis as follows:
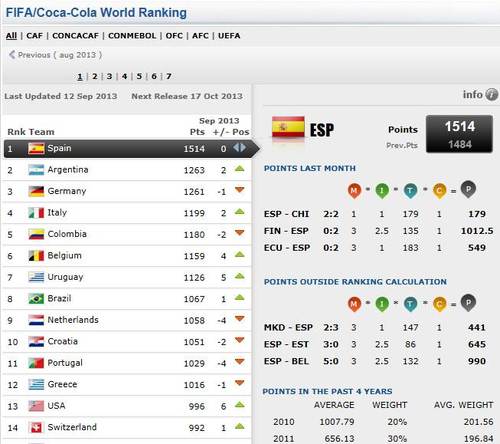
Spain currently top the list on 1,514 while Ireland languish in 59th place, our lowest ranking ever, on just 570 points.
1. (M) The result in the match: 3 – 0 Germany
2. (I) Important of the match: World Cup Qualifier
3. (T) The world ranking of the teams. Germany 3; Ireland 59
4. (C) The confederation to which the countries belong. UEFA
To find out the points Germany receive from winning this game we simply calcuate the following equation:
M x I x T x C
Germany get a value of 3 for (M). World Cup Qualifiers are assigned an importance value (I) of 2.5. Ireland were ranked 59thon the night so (T) equals 200 – 59 = 141. UEFA games are assigned a ‘strength’value of 1.0.
Therefore are formula reads: 3 x 2.5 x 141 x 1 = 1,057.5
This is the number of FIFA world ranking points Germany won on Friday night and is added to the total number of points won over the past twelve months and divided by the number of games to find out the average number of points gained from matches since September 2012.
Had Ireland won the game the number of points awarded would have been:
3 x 2.5 x 198 x 1 = 1,485
A draw would have seen Ireland get 495 points and the Germans 352.5.
The final step of the calculations is to include matches older than twelve months within the last four-year. These games are depreciated on a yearly basis as follows:
- Match average from previous year: 50% ·
- Match average from year 3: 30%
- Match average from year 4: 20%
- Matches older than 4 years: 0% (deleted)
Spain currently top the list on 1,514 while Ireland languish in 59th place, our lowest ranking ever, on just 570 points.
 RSS Feed