The Economics of Sport
  • Sports Economics
  • About
  • Workshop
  • Media
  • Selected Publications
  • Book Reviews
  • A Primer on Gaelic Games
  • Upcoming Events
  • Education
  • Resources & Links
  • Data

Bankruptcy And The English Football League

27/5/2020

 
Picture
By Robbie Butler

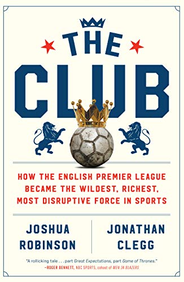
The Club by Joshua Robinson and Jonathan Clegg is an excellent overview of the rise of the English Premier League told through fascinating stories of those of involved. There is a book review on this site if anyone wants to know more. Gary Neville's recent comments about how English Football League clubs are in grave financial peril got me thinking about one of the stories in the book.

According to Neville the top tier clubs in the Premier League, and not the British Government, should bail out clubs in the lower leagues that face bankruptcy. MP Damian Collins claims this could be 10 clubs in the coming days. Huddersfield Town owner Phil Hodgkinson is far more pessimistic and told the BBC “50 or 60” ELP clubs could be forced out of the game if stadiums are empty when football returns.

The story in The Club that this reminded me of was a meeting of US-based Premier League owners in the early 2010s. I think the book recalls a meeting in a classy New York restaurant which included representatives of the Glazers, FSG and Stan Kroenke. (The book remains locked in my office so I cannot check as I still don't have access).

As the story goes, the owners of bitter rivals Man Utd, Liverpool and Arsenal met to discuss their investments. In years gone by it would have been unheard of for such a meeting to take place with local owners. But the Premier League had changed.

The US ownership model is very different. While owners compete on the pitch, they are committed to cooperating off it. In this sense sports economics is almost unique as it requires competition and cooperation. One of the topics up for discussion at the meeting? Relegation.

For many in the US this is a strange concept. It does not exist in the major leagues. Franchises that finish bottom or near the bottom are not punished by demotion to a lower league. In the Premier League, and other major football leagues, this is the ultimate punishment. For American owners, this is far from ideal. If they could, they would probably undo the 150+ year tradition of promotion and relegation, to ensure their team could never leave the paradise and riches that is the Premier League. The value of their investment would soar.

Unfortunately for them, 72 other clubs in the Football League and hundreds of others in the non-leagues would never allow this to happen. Relegation will remain. The negative consequences of this for team owners each year are there for all to see. Just ask American Ellis Short, the one-time owner of Sunderland, who endured a double relegation before selling the club. The Nextflix series Sunderland Till I Die captures the story.

So when Gary Neville calls for the Premier League clubs to rescue those in the lower leagues, I wonder about the motivations of either side. Neville is a co-owner himself of 4th tier Salford City. Naturally, he would like to see investment flowing from the top tier to the lower leagues.

But if Huddersfield Town owner Phil Hodgkinson is right, and 92 clubs were to become 42 or even fewer, this would dramatically alter the competition structure. Imagine if just 30 clubs survived. Could relegation be scrapped? Could two equal conferences emerge with a play-off system. Sounds familiar. It's the MLS and other major sports leagues in the US.

If only the Premier League survived, the owners of each club would see the value of their assets soar. Relegation would be no more. Just guaranteed top flight income and revenues indefinitely.

Athletes and Retirement

25/5/2020

 
By John Considine
Picture
A couple of years ago, the Economic and Social Research Institute (ESRI) conducted research into the time commitments of inter-county, amateur, gaelic games players to their sport.  One of the findings was that approximately one-third of the players involved in a given year will not be involved the following year.  Many cited the competing demands of their professional career as a reason for stepping away.

Around the same time, I heard a radio interview with a recently retired player.  During his inter-county playing career, the player had captained his county to All-Ireland success.  His brother would have been on the same team had he not decided to become a professional Australian rules player.  In the radio interview, the player noted how he came to realise that having a professional career outside of sport helped alleviated stress arising from sport.  He contrasted this situation with the stress involved for his brother every time he was due for contract renewal.

Recent research in the Journal of Applied Social Psychology might help explain some of the benefits to having a professional career outside of sport.  “How stressful is retirement! Antecedents of stress linked to athletes’ career termination” examines the stress associated with retirement of professional athletes and links it to their personality traits.  It is not a comparison between professional and amateur athletes.  However, the findings are informative.  One of the findings is that “if athletes’ passion leads their identities to be not exclusively based on their sportive activities, but it leads to harmoniously integrate these activities with other important life domains, stress linked to ending one's professional career should be significantly reduced and the passage toward the beginning of something else much easier.”

At first, it struck me as odd that of the 420 professional Italian athletes in the study there was no soccer player.  Over 30% of the athletes were rugby players and another 22% were involved in Winter Sports.  On reflection, the lack of soccer players makes sense.  Few of the non-soccer athletes are likely to make enough money during their sporting career to negate the need to find another career.  The transition is unlikely to be easy.
 
The data from the ESRI study shows that it is not easy to combine a time-hungry amateur sporting career and a professional non-sporting career.  However, it may make the retirement decision less stressful.

Running Times And Covid 19

22/5/2020

 
By Robbie Butler

The negative externalities associated with Covid-19 are endless. It is hard to possibly imagine something that has had a more profound impact on people with little or no connection to the original outbreak. On the plus side, one positive externality I continue to witness first hand are my running times.

Normally, at this time of the year members of the Department of Economics at UCC are preparing for our annual Cork City Marathon relay effort. My annual running usually spans April and May, in preparation for the race, and comes to an abrupt halt after the race on the June Bank holiday weekend. This is despite repeated promises to myself each year that I will "keep it up".

Covid-19 changed everything this year. From mid-March I found myself running around the locality on loop runs in order to exercise, like everyone else, during the movement restrictions. The uptake in exercise (running, jogging and walking) is obvious to see. In fact, the pavements are very busy with all sorts of active people.

Last weekend, on a 1.5km stretch, I passed 54 people moving in both directions. That is not running past 54 people as the vast majority were travelling in the opposite direction. However, I was able to run past some primarily because my times have improved.

With thanks to a running app, I have data on all of my runs since March. There have been 23 in total over 70 days. About 1 run ever 3 days. The runs have ranged from just under 4km (2.4m) to 6.3km (4m). 17 of the runs have been betwen 4.9km and 5.2km. 

My 5km times have improves quite a bit. In mid-March my average pace per km was about 5:16. For example, on my first run over 5km, my average pace per km were 5:13, 4:59, 5:17, 5:22 and 5:28. My second kilometre is always my fastest. Overall time 26:28.

Fast forward to my latest run this week. Average pace per km 4:42. Over each kilometre I ran 4:47, 4:34, 4:51, 4:39 and 4:45. Overall time 23:38. The difference is nearly 3 minutes. ​Far from lightening fast, but not bad for a causal runner who's best days on the sports circuit are well behind him.

I will continue this year beyond the June Bank Holiday because the Cork City Marathon has been cancelled. The crucial break this year will be the end of Covid-19 restrictions. I am promising myself I will "keep it up". 

‘Group J’ -  A Slice of Luck for Stephen Kenny

19/5/2020

 
By David Butler

A few weeks back I suggested that if Stephen Kenny restores Ireland's ELO ranking it will be a job well done.

The COVID-19 crisis presents the new manager with an unusual challenge to begin with but maybe he has received a gift from the World Cup 2022 organisers. This gift comes in the form of the yet to be drawn ‘Group J’ for the forthcoming qualifying campaign.  

To explain, for the last three FIFA World Cup qualification (UEFA) phases there was nine groups. For the 2022 qualification phase there is now an extra group. The major implication of the tenth group -  ‘Group J’ - is that there must be ten rather than nine teams per seeding pot (one to five).

Assuming previous polices are maintained by the organisers - determining seeding on the FIFA World Ranking from July three years prior to the Finals - Kenny's Republic of Ireland will scrape in at the bottom of Pot 2 (ranked 20th).

Notwithstanding that there are still strong teams in Pot 3 (see the hypothetical ranking below), the main advantage is that Ireland will avoid a ‘Group of Death’. This will feature a top seed and most likely the Netherlands.

What if the July 2019 rankings are not used to define the seeding? The good news for the Republic of Ireland is that if the ratings either side of July 2019 determine pots, the country will maintain a second placed position. If the June 2019 rankings are applied the Dutch will still be in Pot 2 but, interestingly, if September 2019 rankings are used Germany will be a Pot 2 team. The Danes and Swiss have upset the apple cart recently so the 'Group of Death' most likely will have the Dutch, but could have the Germans or maybe the Italians - UEFA/FIFA do have form for changing tack on competition design. 
​
For the last World Cup, the Republic of  Ireland were drawn from Pot 4 and we were seeded in Pot 3 for World Cup 2010 and 2014. Lower seeding obviously makes qualification more difficult, particularly when there are only 13 UEFA places on offer to the now 55 entrants. Getting to the World Cup is becoming harder as the relative number of places for UEFA has fallen.  

A Pot 2 seed won’t guarantee qualification but it is a slice of luck for Kenny.  'Group J' may have just made our likely battle for a play-off spot slightly easier. Lets hope the designers maintain the status quo in relation to their seeding policy. All will be revealed on 29th November 2020 when the draw takes place. 
Picture

Social Gatherings and Social Isolation

15/5/2020

 
By John Considine
Picture
Today, being Friday, it reminds me that under normal circumstances, most of the sports economists in the department would meet at 2.05pm for caffeine.  The timing is designed to facilitate an audience with one of UCC’s better known economist (a potential Groucho Marx explanation as to why he does not engage in sports economics despite his liking for sport and economics).

The location of afternoon refreshments has changed over the years.  It is now located on WhatsApp.  Three months ago it was in Daybreak.  Some of the earliest incarnations were in Cupan Tae and Renoir’s.  The walls of the former were decorated with UCC sporting photographs.  One picture of a second arts group (many studying economics) included three future Irish rugby internationals.  The name of the latter venue was used to label those economists taking afternoon refreshments as “The Renoir Club”.  When the location changed to the Coffee Station, the label became “The Clump”.

Friday coffee in the sunshine outside the Station was a frequent occurrence.  Lively debates could ensue.  The publication of estimates of fiscal multipliers for different countries prompted one of the more memorable debates.  It stretched over a number of weeks.  It resurfaces occasionally.  Sport also provides plenty of material for debate.  The exact topic up for discussion can depend on what is topical and who is present.  Sport can turn out to be a more common topic than economics.  (Meeting one senior academic economics as we were returning one day, we asked his views on the relative importance of economic forecasting, only to be told “I’d hate to go for coffee with ye if that is what ye talk about.”)
 
Our gatherings won’t go down in history.  Others have.  Anybody who has read A Beautiful Mind by Sylvia Nasar cannot help but be struck by the amount of times John Nash and his colleagues would meet for coffee.  Company seemed to help Nash’s troubled mind.  As Adam Smith said “Society and conversation, therefore, are the most powerful remedies for restoring the mind to its tranquillity”.  Smith himself was one of those individuals who contributed to the tranquillity of the mind of Samuel Johnson as explained in The Club by Leo Damrosch.
 
The coronavirus has disrupted our gatherings and academic life in general.  We are under a version of house arrest.  Of course, there can be a silver lining to this cloud.  In his discussion of the tactics for self-command, Thomas Schelling suggests we should incarcerate ourselves.  To illustrate the point, he recounts an interaction between George Steiner and Georg Lukacs.  The latter said “You want to know how one gets work done? House arrest, Steiner, house arrest!”  It applies equally to students.  There is little evidence that Issac Newton’s studies were adversely impacted by the Plague of 1665-6.  William Blake’s criticism of him was that he was too focused on his studies to appreciate the beauty of nature.  Maybe that’s what our colleague meant when he said he would not enjoy a coffee conversation about economics.

Bonus Incentives and Team Effort Levels: Evidence from the ‘Field’

13/5/2020

 
By Robbie Butler

Last week our paper Bonus Incentives and Team Effort Levels: Evidence from the ‘Field’ was accepted for publication in the Scottish Journal of Political Economy (SJPE). The SJPE has a long association with sports economics and published the first paper in Europe on sports economics in 1971 - Peter Sloane's examination of the labour market in football.

Our paper, co-authored with Liam Lenten (La Trobe) and Pat Massey (Compecon), explores the effect of bonus incentive mechanisms with a focus on how such a scheme influences aggregate production levels of teams of workers. What better place to do this than in the highly competitive setting of professional sport. 

Using data from European rugby's Heinken Cup from 1996 to 2014 we explore that the introduction of bonus points for the 2003/4 competition, and all years that followed, influenced the number of tries scored.

The modelling results demonstrate qualified evidence that introducing bonuses encouraged teams to score more tries, incentivised teams to increase effort to earn the bonus, and without reducing production after the bonus is achieved.

The paper should be available in the coming months in SJPE.

The Influence of Crowds

11/5/2020

 
By John Considine
Picture
If soccer games get to go ahead without crowds then we will get more data on how crowds contribute to home field advantage.  If the games also go ahead in neutral venues then we get a different data set.  However, it is unlikely to be as neat as the data provided by the nature of same-stadium derbies.  Data from these games are presented in a 2018 Journal of Sports Economics paper by Michela Ponzo and Vincenzo Scoppa.  Seven years earlier, results from the same derbies, but with less data, was published by Neils van den Ven in the Journal of Applied Social Psychology.
 
The advantage of such data, as Ponza and Scoppa explain, is that it removes issues such as familiarity with the venue and travel fatigue.  These games are a sort of naturally occurring field-experiment.  The designated home team in any given game has the advantage of a larger support because their fans are allocated a greater number of seats.  Ponza and Scoppa take advantage of 22 seasons of Serie A data for same-stadium derbies in Milan and Rome, 10 seasons of data for Turin, 9 for Genoa, and 1 for Verona.  This gives a total of 128 games.  There were 64 games in Van den Ven’s data set.
 
The results from the larger data set show that the home team enjoy a goal difference advantage and take more points per game (although the summary statistics on the latter might raise some questions).  The authors estimated that 60% of the points advantage that comes from home field advantage can be attributed to the impact of the larger crowd.
 
We need to be careful in how we imagine the channels through which the larger crowd might have the influence.  We should consider the evidence from other sources.  Two teams from the same city might compete in a final at a neutral venue.  The travel fatigue and the familiarity with the venue should be the same.  Does the team with the larger support win?

Now consider the second part of the Ponza and Scoppa paper where the authors examine foul play.  They start by describing the items they are counting as “discretionary decisions of officials”.  Discretionary?  That is one way of looking at the situation.  Could the influence not be working through the players rather than the referee?  In fairness to the authors they attempt to adjust for this by keeping the refereeing decision constant in statistical terms.  Maybe we should also consider other "experiments".  For example, data on games where the referee has a hearing difficulty.

Previously, I presented some data on the home advantage in team golf.  In these competitions, there is almost no influence from the referee.  The advantages conferred by travel fatigue and familiarity with the venue remain to some extent.  Yet, the home team wins well above 50% of the contests.  We need to be careful when identifying the channel through which a crowd can influence a contest.

Munster's "Miracle Match"

8/5/2020

 
By Robbie Butler

The 18th of January 2003. That was the date. Munster versus Gloucester in the final pool game of the 2002-03 Heineken Cup - rugby unions' European Cup. 

For many reasons today, this seems like a lifetime ago. For one thing, the old Thomond Park was packed to the rafters with 12,500 people. No social distancing.

​The tale of the game is one that has never been forgot and demonstrates the power of incentives and the importance of bonuses for increased production (winning and losing bonus points) in today's game. What happened that day is testament to economic theory and has gone down in Munster folklore as the "Miracle Match". 

​Going into the final game Pool 2 looked like this. 
Picture
With Perpignan set to face Italian side Arix Viadana, it was accepted that Munster would have to beat the brilliant English side Gloucester to have any chance of progressing. If both of these things happen, all three teams would then end up on 8 points. 

Munster remarkably won the game 33-6, scoring four tries in the process. A winning margin of 27 thanks to Ronan O’Gara’s last second conversion. So too did Perpignan, meaning a three-way tie at the top. Munster's winning margin and method are crucial in the miracle. Here is why.

Before kick-off Munster knew that they would need at least a 27 point winning margin AND four tries to progress. This was a time before bonus points so no extra point was given for scoring four. There are a number of interesting article online that overview the match, and the winning combination needed for this miracle to happen, but none that I could find explained why this was needed. 

I was lucky enough to have a contact to a player that played a starring role for Munster on the day. He admitted to knowing what was needed (27 points winning margin and 4 tries) but not knowing why. With his help and those in Munster Rugby I was guided towards the tie-breaking rules. I could figure out the rest.

So here is why the Munster Miracle was a minimum margin of 27 points and at least 4 tries.
The rules dictated that in the event of a three-way tie like this, the next criteria used to separate the teams would not be points difference but tries scored. And not just tries scored, but tries scored excluding the games against the Italian team. 

Before the final pool game, head to head tries scored read:
 
Tries Scored (Before Last Game)
Perpignan = 10
​Munster = 5
Gloucester = 9
 
With Gloucester on 9, this is why Munster needed at least 4 tries. If Gloucester were to score a try in the game against Munster, the Irish team would have needed 5 tries in that game (total of 10). This of course would have had them level with Perpignan, with the French club stuck on 10.

Munster managed to get 4 tries which got them level with Gloucester, as the English club were held try-less. So, at the end of the final pool game, with all three teams on 8 points, the criteria for tie-breaker (Head-to-Head tries scored) read:
 
Tries Scored (After Last Game)
Perpignan = 10
Munster = 9
Gloucester = 9

As a result, Perpignan topped the Pool and qualified for the knock-out stages. This was not the end for Munster, as they could be one of the two best second placed teams to qualify from the pool stages. This was decided by points difference across all six pools.
 
To separate Munster and Gloucester, tie-breaker criteria two was Head-to-Head on points difference, but across all three teams. Before the last Pool game this read:
Picture
With Munster on -25 and Gloucester on +28, the Irish side were 53 worse off going into the last game or -26.5 when you consider a score for Munster is subtracted from Gloucester. This is why there was a need for a 27 winning margin. This then looked afterwards:
Picture
Munster were +2, and Gloucester +1. In the seconds before Ronan O'Gara's last minute conversion, Munster were 0 and Gloucester +3. That famous kick saw a 4-point swing and was enough for Munster to progress.

Interestingly, Perpignan were -3 and lucky Head-to-Head Tries Scored was the first criteria! In fact, any Munster win with 5 tries would have been enough to secure at least 2nd (even a one point win) so long as Gloucester didn’t score a try.  

Thankfully, the introduction of bonus points in the 2003/4 competition means the complications associated with Munster's "Miracle Match" is unlikely to be repeated. 

Back-of-the-Envelope Calculations and Sky Losses

6/5/2020

 
By David Butler

I wonder how much this crisis is costing Sky and other broadcasters of sports content? Sky sports offered subscribers an opportunity to pause their sports package subscription - surely the take up on this must be high.

Information on the number of sky subscriptions is private. Regardless, can we do some rough guess work?

Note, this guess work is for Ireland only. In 2018, the Irish Times reported one in four Irish people have subscribed to a paid TV sports channel package over a twelve month period. Assuming these are adults (and they all subscribe at the same time), that's about one quarter of 3.9m people.

So say Sky Ireland has 975,000 subscriptions. Say then that ~95% take Sky up on their pause offer. They may lose monthly premium subscriptions to the tune of ~925,000 customers.

Going off my own experience, the bill fell by ~€35. That amounts to over ~€32m in lost revenue a month in Ireland alone. Depending on individual customer deals ( say +/- €5 on the package difference), my guess is that it could range from €27m to €37m a month. The €37m could be closer to the worst case scenario and may be for the entire premium subscription sports industry here, although I'm sure Sky dominates this. This is however all before any premium/elite subscriptions (i.e. the pubs) are considered .

Those subscriptions numbers might seem a little on the high side for Ireland. Even if we half the 925,000 figure to account for the fact that not all premium subscriptions of the '1 in 4' may have been for Sky Sports, losses into the millions would still be recorded (~€16m). We could be getting closer to baseline losses with this figure.

These numbers are of course complete guesswork, but worrying times for sports broadcasters all the same.

Covid-19 and the Financial Impact on English Football

1/5/2020

 
By Seán O’Connor

With the closure of stadiums across Britain and throughout the world, much of the discussion to date has focused on the financial viability of clubs. Stories of clubs asking players to take salary cuts along with other clubs taking the option to furlong staff have been some of the options considered. At their core it appears football clubs are cash-flow businesses. Any incoming revenue is quickly pushed out to cover costs, most notably player salaries. However, when incoming revenue dries up, salaries still have to be paid. This post examines the proportion of salaries (including pension costs) to turnover, to attempt to provide an indication of which clubs may be most at risk due to the ongoing stoppage of football.

Latest submitted accounting returns were examined for all clubs in the English football league. While the English league system consists of 4 tiers not all clubs accounts were available. Moreover, some clubs accounts are more up to date than others. Clubs are classed into a division depending on when the period their accounts relate to. For example, Sheffield United have accounts available for the 2018/2019 accounting period, therefore they are classed into the 2018/2019 football season and considered a Championship team. Below provide the numbers by league. To the right of this table is the breakdown of when financial returns are submitted by clubs. 
Picture
Picture
In broad terms the financials of under 8 out of 10 clubs in England’s top four tiers can be examined. The lower share in lower leagues can be explained by the fact that these clubs are only required to submit micro financial returns, so information on turnover and salaries isn’t always available. Moreover, 80% of clubs returns relate to 2018/2019 season, so provides us with a reasonable up to date picture of financial health.

At a very high league level we can observe the percentage share of salaries to turnover. This is demonstrated by the table below.
Picture
​To briefly summarise on average a Premier League club spends 63% of their turnover on salaries. However, the remarkable thing here is for Championship clubs were on average their turnover doesn’t cover their salary costs. This figure is slightly distorted by one club, but if we examine how many clubs have a share of 100% or greater, we get the following picture.
Picture
So nearly 6 out of 10 Championship teams are spending more on salaries then they are taking in on turnover.

However, this isn’t to say that these clubs might be most at risk, given the current climate. From examining various club accounts during this analysis, revenue streams are diverse across divisions and clubs. At the higher end, TV money, commercial deals and other areas look to provide some clubs with a solid grounding. In the lowers leagues gate receipts are a particularly high proportion of turnover. With this type of income suspended indefinitely they may need to relay even more so on their benefactors to see them through this period intact.

The final graph below provides an illustration of each clubs relative share of salaries to turnover. It’s quiet interesting to see Tottenham (bottom of list) having one of the lowest shares but appeared to be one of the first clubs to consider the furlong option.  
Picture

    Archives

    December 2022
    November 2022
    October 2022
    September 2022
    August 2022
    July 2022
    June 2022
    May 2022
    April 2022
    March 2022
    February 2022
    January 2022
    December 2021
    November 2021
    October 2021
    September 2021
    August 2021
    July 2021
    June 2021
    May 2021
    April 2021
    March 2021
    February 2021
    January 2021
    December 2020
    November 2020
    October 2020
    September 2020
    August 2020
    July 2020
    June 2020
    May 2020
    April 2020
    March 2020
    February 2020
    January 2020
    December 2019
    November 2019
    October 2019
    September 2019
    August 2019
    June 2019
    May 2019
    April 2019
    March 2019
    February 2019
    January 2019
    December 2018
    November 2018
    October 2018
    September 2018
    August 2018
    July 2018
    June 2018
    May 2018
    April 2018
    March 2018
    February 2018
    January 2018
    December 2017
    November 2017
    October 2017
    September 2017
    August 2017
    July 2017
    June 2017
    May 2017
    April 2017
    March 2017
    February 2017
    January 2017
    December 2016
    November 2016
    October 2016
    September 2016
    August 2016
    July 2016
    June 2016
    May 2016
    April 2016
    March 2016
    February 2016
    January 2016
    December 2015
    November 2015
    October 2015
    September 2015
    August 2015
    July 2015
    June 2015
    May 2015
    April 2015
    March 2015
    February 2015
    January 2015
    December 2014
    November 2014
    October 2014
    September 2014
    August 2014
    July 2014
    June 2014
    May 2014
    April 2014
    March 2014
    February 2014
    January 2014
    December 2013
    November 2013
    October 2013
    September 2013
    August 2013
    July 2013

    About

    This website was founded in July 2013.

    RSS Feed

    Categories

    All
    American Football
    Athletics
    Baseball
    Basketball
    Behavioural Economics
    Boxing
    Broadcasting
    Competitive Balance
    Cricket
    Cycling
    Darts
    David Butler
    Declan Jordan
    Drugs
    Ed Valentine
    Epl
    Esports
    Expenditure
    F1
    Fifa World Cup
    Finances
    Funding
    Gaa
    Gaelic Games
    Gambling
    Game Theory
    Gary Burns
    Geography
    Golf
    Greyhound Racing
    Guest Posts
    Horse Racing
    Impact Studies
    John Considine
    John Eakins
    League Of Ireland
    Location
    Media
    Mls
    Mma
    Olympics
    Participation
    Paul O'Sullivan
    Premier League
    Regulation
    Research
    Robbie Butler
    Rugby
    Simpsonomics
    Snooker
    Soccer
    Spatial Analysis
    Sporting Bodies
    Stephen Brosnan
    Swimming
    Taxation
    Teaching
    Technology
    Tennis
    Transfers
    Uefa
    Ufc
    World Cup
    Wwe

Related

The website is not formally affiliated to any institution and all of the entries represent the personal views and opinions of an individual contributor. The website operates on a not-for-profit basis. For this reason we decline all advertisement opportunities. 

Contact

To contact us email sportseconomics2013@gmail.com or find us on Twitter @SportEcon.