The Economics of Sport
  • Sports Economics
  • About
  • Workshop
  • Selected Publications
  • Book Reviews
  • A Primer on Gaelic Games
  • Upcoming Events
  • Media
  • Education
  • Resources & Links
  • Data

Institutional Change & LoI Performance

31/10/2014

 
Picture
By Robbie Butler

I recently presented a working paper at the Dublin Economics Workshop on institutional change in the League of Ireland (LoI). Since the early 1980s league organisers have made various rule changes in order to attract more spectators to matches and improve the quality of the league (as measured by European performance of elite League of Ireland clubs). From a theoretical perspective, it has been hoped that institutional change would set clubs on marked institutional courses leading to improved demand for match tickets and enhanced club performance.

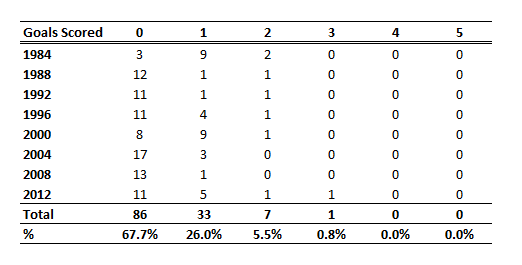
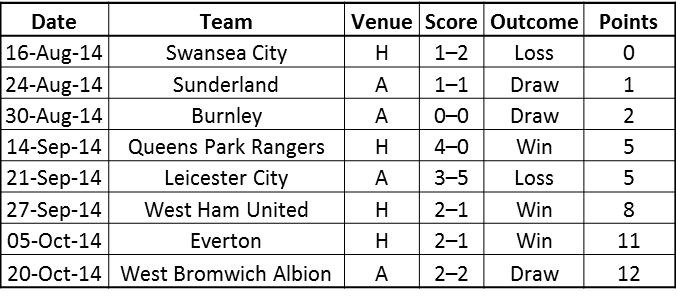
The move to "Summer Soccer" in 2003 provides us with a wonderful natural breaking point to consider if this change has resulted in improved European performances, as is often suggested. I present a number of tables  which make for interesting viewing. The first of these (to the right) shows the performance of LoI clubs in the 11 years before and after 2003. Pre-2003 covers the years 1993 - 2003 (as well as European Cup games from 1990 - 1992 as Irish teams did not compete in the competition from 1994 - 1996). Post-2003 covers the seasons 2004 to 2014. The improvement from this table is obvious. League clubs now play more games, win and draw more and score far more goals. The next two tables break down performance by competition. Results from the Europa League cover performance in that competition since 2009 and previous results in both the UEFA Cup and UEFA Cup Winners Cup. 

Picture
Picture
Picture
Picture

Motorcycle Races in Greece and Irish Household Waste

29/10/2014

 
By John Considine
Picture
In his book Beautiful Game Theory: How Soccer Can Help Economics, Ignacio Palacios-Huerta expresses the hope that his sport can help economists think about their subject.  There is no shortage of examples where sport can help individuals think about other areas of their life.  For example, there is a clear link between motorcycle races in Greece and household waste collection in Dublin.  The link comes in the form of an important legal case.  In Nurendale Ltd t/a Panda Waste Services -v- Dublin City Council & Others, the judge drew parallels between the organisation of a waste collection competition in Dublin and the organisation of motorcycle races in Greece.

The importance of the case involving the Greek motorcycling for EU Sports Law can be inferred from the fact that the case is listed on the main paper of the EU Competition Policy page on sport (here).  The  case is Motosykletistiki Omospondia Ellados NPID (MOTOE).

MOTOE wanted to organise some motorcycle races but needed permission from the relevant Minister.  Nothing surprising there.  What was surprising was that ELPA, the national representative of the International Motorcycling Federation, had the power to veto any Ministerial decision.  ELPA organised their own races via a subsidiary and could effectively eliminate competition by use of their veto or regulatory power.  The Court said of its regulatory right: "Such a right may therefore lead the undertaking which possesses it to deny other operators access to the relevant market. That situation of unequal conditions of competition is also highlighted by the fact, confirmed at the hearing before the Court, that, when ELPA organises or participates in the organisation of motorcycling events, it is not required to obtain any consent in order that the competent administration grant it the required authorisation."

The judge in the Panda case made reference to the MOTOE case when considering the change to the organisation of household waste collection in Dublin.  He noted the similarities in way "the variation" (i) allowed Dublin City Council to organise the competition and (ii) the fact that Dublin City Council also provided waste collection services.  Substitute ELPA for Dublin City Council.  The judge ruled in favour of Panda.

When it comes to organising competitions, sport can clearly offer us ways to think about the issues.

Greyhound Racing Hits Crisis Point?

28/10/2014

 
By Robbie Butler

Irish Greyhound Board (IGB) Board chairman Phil Meaney announced last week that due to it's current financial predicament (€21 million debt and €6.8 pension deficit), IGB would be "sweating" and selling assets. Among the assets to be sold is the famous Harold Cross Greyhound Stadium in Dublin.

The comments were made by Meaney as he addressed an Oireachtas agriculture committee on the back of an Indecon Report published in July 2014 called " Review of Certain Matters Relating to Bord na gCon". The Indecon Report outlined the critical challenges facing the industry and noted that between 2006 and 2013 there was "an overall decline in revenue from €63.5 million to €28.2 million...and represents a fall of 55.6% over the period". A link to the full report, and IGBs reply, can be found here.

The reason IGBs chairman had to sit in front of an Oireachtas agriculture committee is because Bord na gCon is heavily funded by the State. The figure below shows the level of State funding for the sport since 2001. Between 2001 and 2010 the money was allocated through the Horse and Greyhound Fund (of which the greyhound racing receives 20%) and fell under the remit of the Department of Arts, Sports and Tourism. Since 2011 support as been allocated under the Department of Agriculture Vote. 
Picture
In total, nearly €180 million has been allocated to greyhound racing since 2001. As one would expect, following the financial crisis and Irish budgetary difficulties post-2008, there has been a sharp slump in the level of funding granted. As the Indecon report highlights, this has been coupled with a further drop in other revenues sources. It would appear the sport faces serious challenges in the years ahead.

One can only imagine where the industry would be without government support.

Tour de France 2015: Anyone but Sky?

25/10/2014

 
Picture
By Paul O'Sullivan

This week saw the route for the 2015 Tour de France unveiled (see here and here). The general consensus is that the race will be won by one of the top climbers like 2014 Grand Tour winners Vincenzo Nibali (Tour de France), Alberto Contador (Vuelta Espana) and Nairo Quintana (Giro d’Italia), as well as 2013 TdeF winner Chris Froome. This year’s event was won easily by Nibali, undoubtedly helped by the fact that Froome and Contador crashed out early and that Quintana did not participate at all.

Traditionally, the Tour contains 8-9 mountain stages, 8-9 relatively flat stages that usually end in sprint finishes and 2-3 time trials. In 2012 and 2013, a mini-trend had started to develop whereby the winner was the one that did exceptionally well in both the individual time trials. The overall winners in this period were Bradley Wiggins in 2012 and Froome in 2013. Prior to this, from 2009-2011, there was only one individual time trial outside of the opening, very short, individual prologue.

Perhaps not coincidentally, both Wiggins and Froome are members of Team Sky, many of whom, at both rider and management level, have a background in track racing. If there is one element of road racing that can benefit from performance spillovers from the track, it is undoubtedly the time-trial, where the aerodynamic properties of the bike, rider sitting position and even the cycling suit can shave significant amounts off a rider’s time. Such benefits are magnified in time trials as riders are not able to ‘draft’ the rider in front as happens in all other stages, though less so in the mountains given that speeds are lower.

In 2012, Bradley Wiggins was the overall winner by 3.21 from Froome, 6.19 from Nibali, 10.15 from Van den Broeck and 11.04 from Van Garderen, despite not winning any mountain stage. That year, Wiggins won two stages, both of the time trials. In these, Wiggins gained 1.41 over Froome, 5.45 over Nibali, 7.31 over van den Broeck and 3.40 over van Garderen. Wiggins also benefitted from having Froome as one of his ‘domestiques’, ensuring that he had support on the toughest mountain stages without having to fear an attack by Froome.

In 2013, Froome was much more impressive than Wiggins was in the mountains, famously winning on Mont Ventoux.  Overall, Froome won by 4.20 from Quintana, 5.04 from Rodriguez, 6.27 from Contador and 7.27 from Kreuziger.  As with Wiggins in 2012, Froome’s performances in the two time-trials were hugely impressive, gaining 4.27 from Quintana, 3.27 from Rodriguez, 2.11 from Contador and 2.29 from Kreuziger.

The organisers of the Tour seem to have taken this trend into account in setting the route for future Tours. In 2014, there was only one time trial and it occurred on the second last stage. For 2015, there will be only be one individual time trial covering just 14km and it will be the first stage. This is the least distance covered in individual time trials since 1947. The only other time riders are against the clock is in a team time-trial on stage 9 covering 28km. In response to this, Chris Froome has hinted that he may give the Tour a miss and focus on winning both the Giro and Veulta which take place either side of the Tour.

One may wonder why the organisers have gone down this route. Is it felt that climbing ability should be the dominant factor in determining the overall winner? Is there a bias against the newcomers from Sky? Do cycling chiefs fear that cycling is going the way of other sports such as golf and motor racing where technology is having a greater impact on outcomes and that this is the only way to react in order to make the overall outcome more indicative of natural cycling ability? Is there a fear that fan interest may be impacted if the Tour is effectively decided by the time trials?

I don’t know the answer but am really looking forward to next July.

Bottom Seeds & Goals Scored

24/10/2014

 
By David Butler

In light of the entries on inequality in European International Football, I was asked how many goals were scored by the bottom seeds against the top seeds in the European Championship Qualification stages? Previously I presented data on the score differential. Below is the number of goals scored in the 127 matches from the European Championship Qualifiers (1982-2012).  The table shows how many matches per campaign between the top and bottom seeds ended with the bottom seed scoring from 0 to 5 goals.

In 68% of the matches the bottom seed didn’t even score and only once has a bottom seed scored three goals in a single match against a top seed. This happened when Iceland lost 5-3 to Portugal. The bottom seeds are not scoring more goals as time has passed.
Picture

Moyes Or LVG?

23/10/2014

 
By Robbie Butler

The West Brom/Manchester United game on Monday night was intriguing to watch. It struck me during the first half just how many players starting for United never played under Sir Alex Ferguson despite the fact he retired as manager just over a year ago. Shaw, Rojo, di Maria, Herrera, Blind and Mata all started the game having never experienced the Scot’s managerial skills (more than half the team), while Falcao and Fellaini both came on and were signed post-Ferguson.

With the exception of Juan Mata, the other five starters who never played under Ferguson, also never played under David Moyes. The team is really starting to have a Louis van Gaal look about it. 

So if it’s LVG team, is a 2 – 2 draw against West Brom good enough? 

Had the Baggies hung on for the win, LVG would have amassed 11 points from his first 8 league games; David Moyes accumulated the exact same amount 11 from 8. As happened, United rescued a point, pushing them up to 12 in the league. The league results for the first 8 games for both LVG and Moyes are presented below.
Picture
Picture
While LVG is one point better off than Moyes, it should be noted that the Scot had, by the 21st of October 2013 already knocked rivals Liverpool out of the Capital One Cup and avoided defeat in two Champions League games, beating Bayer Leverkusen 4 – 2 at Old Trafford and drawing 1 – 1 in Ukraine with Shakhtar Donetsk. Additionally, it has been argued that this was the ‘easiest’ start the Red Devils had to the Premier League in years. Their opening eight fixtures included only one game against a team (Everton) that finished in the top eleven places last year in the league. This is in stark contrast to Moyes’ start as United manager which included league games against Manchester City, Chelsea and Liverpool before the end of September.

With this in mind, I decided to look at comparable games to see who is doing better. This is far from a perfect analysis. Firstly, teams can change dramatically from season to season. Southampton are evidence of this. Secondly, LVG has played the three promoted teams which weren't in the league last year. To overcome this problem I use last seasons promoted teams for the comparison. 
Picture
The  United defeat at Leicester this season is compared to their draw at Cardiff under Moyes as both were champions of the Championship. Burnley are compared to Hull City (2nd place in Championship) while Crystal Palace are matched up with QPR as both were prompted via the Play-offs.

The table is very interesting. Moyes 19 - 12 LVG. It would make you wonder how well LVG is actually doing when compared to Moyes. And I haven’t even mentioned the net spend of more than £110 million since LVG took over....

Learning in European International Football

22/10/2014

 
By David Butler

This is the third entry in a series that considers inequality in European International football. The earlier parts can be read here and here. The story so far is that inequality in European International football is on the rise since the 1980’s. This rise is primarily caused by the weaker performances of bottom seeds at home over the last twenty years. 

It has been suggested  that these small states need the opportunity to be beaten to allow them to learn and subsequently improve. So does ‘learning’ occur? Have the bottom seeds improved over time in European International Football?

I'm classifying improvement as breaking out of the bottom seed pool of teams for European Championship Qualifiers. There seems to be some evidence from the data that nations can break out of this bottom seed ‘trap’.

Albania broke out of the bottom seed group in 2008, Estonian broke out after Euro 2000, Kazakhstan broke out soon after entry in 2008 and it appears that Azerbaijan will soon climb out as they have steadily increased their points haul since they entered the European Championships in the 1996 qualification stage.

Some of this improvement is caused by entry of new states and hence the opportunity to get points against them, so there was almost a natural rise for certain teams.

Several teams however can’t escape the trap – Andorra, Faroe Islands, Luxembourg, Malta and San Marino can't get out. Andorra and San Marino have never scored a point in any qualification match for the European Championships.  The other three nations have scored points, but have shown little sign of improvement and at times have regressed. My hunch is that this is due to the low population of these states and small pool national sides have to draw from. All hope is not lost however as Liechtenstein has a population of approximately 37,000 but managed to break out of the bottom seeds buthave since slipped back in.

Even if a team breaks out there is no guarantee that they will qualify for the finals in the future - Slovenia made their debut in the qualifiers for Euro 2000 and are the only bottom seed to ever qualify for the finals as a bottom seed. Other than Slovenia no team that was every a bottom seed, regardless of whether or not they have broken out, has qualified. Iceland may become number 2 for Euro 2016!

Adam Smith, Robert Keidel, and Specialisation in Baseball

21/10/2014

 
By John Considine
Picture
The Wealth of Nations opens with the sentence “The greatest improvement in the productive powers of labour, and the greater part of the skill, dexterity, and judgment with which it is any where directed, or applied, seem to have been the effects of the division of labour”.  From this beginning Adam Smith proceeded to lay down an argument that earned him the title ‘father of economics’.

The resulting specialisation facilitates great improvements in output.  One channel is the improved dexterity from allowing individuals to focus on one task.  The downside of specialisation is that the individual’s ability at other tasks will diminish.  This may be what is happening to pitchers in Major League Baseball.  In a New York Times article last May, MLB historian, John Thorn, noted the decline in the battling competence of pitchers (here).

The impact of specialisation may be similar in other team sports.  In a previous post on this blog Declan Jordan examined whether different specialist positions on a rugby union team allowed for different body types (here).  My reading of his piece is that there is more convergence than divergence.

One of the reasons that specialisation might have more of an impact in baseball is the way the individuals contribute to the team.  One of the more thought-provoking descriptions I’ve read of how individuals to team performance is in a book called Game Plans by Robert Keidel.  Keidel's book is primarily aimed at business people.  The book argues that it is important that business people know how their staff contribute to the team.  He uses sport teams as models.  Keidel labels baseball as the more individualistic of the three sports (football, basketball and baseball).  He says that this "is vividly demonstrated by the way offense works: Players come to bat one at a time".  He admits that scoring often involves a sequence of actions - including sacrifices.  However, he claims the supreme act is the home run and it "underlines the discreteness and importance of individual offensive contributions in this sport, just as pitching does with respect to defense".

Another account of the economics of sports specialisation in baseball can be found on Matthew Kahn’s blog (here).  The above piece was prompted by a link to Kahn’s piece I received from a student.

Safety in Numbers – The Stats Behind F1 Driver Protection

20/10/2014

1 Comment

 
By Ed Valentine

If you think that F1 is dangerous then you’re right. Obviously. Safety in Grand Prix racing has much improved since the deaths of Roland Ratzenberger and Ayrton Senna 20 years ago. This is thanks largely to the technology drive powered by the Fédération Internationale de l'Automobile (FIA) along with Formula One Group (FOM) who have worked hard to ensure high levels of driver protection when normal accidents occur.

Much of the technology used to protect drivers has trickled down into road cars and despite numerous deaths scattered throughout the history of F1 many lives have been saved on public roads. Basic standard safety systems used if F1 have not always been mandatory requirements. Helmets and overalls became obligatory in 1963, stipulations on seatbelts came into force as late as 1972, the permanent medical centre at every racing facility was only introduced in 1980 while computer analysis of ‘high risk’ circuits began following F1’s darkest weekend at Imola in 1994.

Jules Bianchi’s collision at Suzuka was one that can be defined as a normal accident. It was unlucky but the events which led to the crash formed part of a system of cascading failures across the Japanese Grand Prix. These were:

1) Drivers not slowing enough during the yellow flag phase on lap 41 – the FIA are going to introduce a controlled slow down system to regulate this.

2) Drivers not driving within the boundary of the conditions – Ericsson spun off under the safety car early in the race.

3) Equipment that doesn’t fall into the crash structure design of a F1 car being present inside the confines of the circuit. Impacts into recovery vehicles are not part of the FIA crash testing process. The cars are very well designed to protect drivers in collisions with tyre walls and barriers.

4) Some drivers have complained that the wet weather tyres do not remove enough standing water. Bianchi had intermediate tyres at the time of the crash.

5) Fixed cranes stationed behind the crash barrier were not present at that corner.

6) The run off area at turn 7 may not be wide enough to neutralise the speed of the cars in the event of an accident – other tracks have had modifications to their run off areas to accommodate cars leaving the circuit at high speed.

7) The safety car was not called early enough following Sutil’s crash on lap 41.
Picture
Measures are being introduced by the FIA to control speeds remotely during car recovery periods and skirting may be added to the recovery vehicles to stop cars from going underneath the vehicle’s chassis. Calling a safety car for every crash isn’t realistic. The speed control option may be the solution. Cranes located behind barriers, such as in the image, must also now be made standard.

New safety measures have generally led to a more competitive championship. However the FIA decided to ban performance enhancing electronic technology for the start of the 1994 season. This resulted in many of the cars that year being twitchy and difficult to control at high speed. With greater horsepower and torque than the previous year but a lower level of car stability many drivers were vociferous in their concerns including Senna who claimed it would be a “season with many accidents”.

Average speeds have accelerated rapidly through the decades as have safety standards. Just how safe is the current era of F1?

Picture
Safety technology can’t stop the drivers having accidents necessarily – there is no current gizmo in F1 other than the brakes and the steering wheel which help to prevent collisions. The safety systems are not preventative and are designed to work during the accident. Crash structures are stronger than ever and high mechanical reliability allows components to have more reliable duty cycles. Many circuits have larger run off areas on the faster corners and have seen gravel traps make way for asphalt which increases the likelihood of car control during off track excursions.


The Peltzman effect appears to be present in F1. Between 1963 and 1985 just over 57% of accidents occurred due to mechanical breakdowns, failures or tyre delamination. This figure began to change as the cars became safer. From 1987 onwards around 69% of accidents have been brought about by driver actions. As the cars and tracks have become safer drivers have started to take more risks. From the mid 90s onwards F1 has seen a reduction in the number of teams on the grid with an average of 22 drivers taking part at each race weekend. As a result competitiveness has increased along with safer machinery but the number of accidents per season has grown to a mean of 70.2 from the period 1985 to 2014 (2014 season currently in progress). Though the mean has increased accidents are much less violent now than in previous decades. Today the cars can tap the barriers and continue with light damage where as prior to the mid 90s in similar collisions they’d fold like a piece of paper.

Picture
Picture
The table to the right details the numbers regarding death and injury in the 421 FIA sanctioned GP weekends between 1963 and 1997. Nearly 3.5 million kilometres (estimated based on laps completed across GP weekends by individual drivers) have been notched up by all of the F1 entrants across practice, qualifying and race distances.

The FIA will continue their great job of reducing the dangers of motorsport but it’s a balancing act as competitive drivers are hard wired to push at all times.

Let’s hope Jules makes a fast and full recovery and sparkles again in F1 soon.

Data sources: FIA & Grand Prix Records.

1 Comment

A Christmas Break in the Premier League?

18/10/2014

 
By Ed Valentine and John Considine
Should there be a Christmas break in the Premier League?  The data on the reported injuries for 5 Premier League clubs suggests that some consideration should be given to the issue.  The clubs used in the chart below are the two Manchester clubs, Arsenal, Chelsea and Liverpool.  The chart shows the number of injuries reported over the previous seven days.  For example, the number for March 7th is the injuries reported for the days between March 1st and March 7th.

The only seven day period with more than 10 reported injuries is the week between Christmas Day (December 25th) and New Years Day (January 1st).  This might suggest there should be a Christmas break.  The volume of games probably contributes to the increase in injuries.

The chart below also seems to suggest that there are slightly less injuries between January and April compared to between September and December.  June is the month with the lowest activity (training or games) and has the lowest reports number of injuries.
Picture
In a previous post Ed Valentine examined the type of injuries over the period 2002 to 2014 (here).  The post documented how ankle, hamstring, thigh, and knee injuries were the most prevalent.  The chart below shows the distribution of injuries reported for the period from December 24th to January 1st.  It groups together the injuries listed as flu, virus, and illness.  This group now is the second most prevalent for the Christmas week period.  The distribution of injuries is not that surprising given the time of the year.
Picture
<<Previous

    Archives

    March 2023
    February 2023
    January 2023
    December 2022
    November 2022
    October 2022
    September 2022
    August 2022
    July 2022
    June 2022
    May 2022
    April 2022
    March 2022
    February 2022
    January 2022
    December 2021
    November 2021
    October 2021
    September 2021
    August 2021
    July 2021
    June 2021
    May 2021
    April 2021
    March 2021
    February 2021
    January 2021
    December 2020
    November 2020
    October 2020
    September 2020
    August 2020
    July 2020
    June 2020
    May 2020
    April 2020
    March 2020
    February 2020
    January 2020
    December 2019
    November 2019
    October 2019
    September 2019
    August 2019
    June 2019
    May 2019
    April 2019
    March 2019
    February 2019
    January 2019
    December 2018
    November 2018
    October 2018
    September 2018
    August 2018
    July 2018
    June 2018
    May 2018
    April 2018
    March 2018
    February 2018
    January 2018
    December 2017
    November 2017
    October 2017
    September 2017
    August 2017
    July 2017
    June 2017
    May 2017
    April 2017
    March 2017
    February 2017
    January 2017
    December 2016
    November 2016
    October 2016
    September 2016
    August 2016
    July 2016
    June 2016
    May 2016
    April 2016
    March 2016
    February 2016
    January 2016
    December 2015
    November 2015
    October 2015
    September 2015
    August 2015
    July 2015
    June 2015
    May 2015
    April 2015
    March 2015
    February 2015
    January 2015
    December 2014
    November 2014
    October 2014
    September 2014
    August 2014
    July 2014
    June 2014
    May 2014
    April 2014
    March 2014
    February 2014
    January 2014
    December 2013
    November 2013
    October 2013
    September 2013
    August 2013
    July 2013

    About

    This website was founded in July 2013.

    RSS Feed

    Categories

    All
    American Football
    Athletics
    Baseball
    Basketball
    Behavioural Economics
    Boxing
    Broadcasting
    Competitive Balance
    Cricket
    Cycling
    Darts
    David Butler
    Declan Jordan
    Drugs
    Ed Valentine
    Epl
    Esports
    Expenditure
    F1
    Fifa World Cup
    Finances
    Funding
    Gaa
    Gaelic Games
    Gambling
    Game Theory
    Gary Burns
    Geography
    Golf
    Greyhound Racing
    Guest Posts
    Horse Racing
    Impact Studies
    John Considine
    John Eakins
    League Of Ireland
    Location
    Media
    Mls
    Mma
    Olympics
    Participation
    Paul O'Sullivan
    Premier League
    Regulation
    Research
    Robbie Butler
    Rugby
    Simpsonomics
    Snooker
    Soccer
    Spatial Analysis
    Sporting Bodies
    Stephen Brosnan
    Swimming
    Taxation
    Teaching
    Technology
    Tennis
    Transfers
    Uefa
    Ufc
    World Cup
    Wwe

Related

The website is not formally affiliated to any institution and all of the entries represent the personal views and opinions of an individual contributor. The website operates on a not-for-profit basis. For this reason we decline all advertisement opportunities. 

Contact

To contact us email sportseconomics2013@gmail.com or find us on Twitter @SportEcon.