By David Butler
This website hosts a book review section where the contributors appraise recently published works that take an academic stance on sport. When it comes to the big screen however scholarly endeavours of a sporting nature are few and far between and are largely limited to American sports.
There seems to be growing in popularity in U.S to bring statistical stories to the big screen dramas. Moneyball was released in 2011 and was based on Michael Lewis's 2003 hit book that see's Oaklands A’s boss Billy Beane (Brad Pitt) apply statistical methods to select baseball players. On the 7th of April this year Draft Day was released in the U.S and stars Kevin Cosner as the general manger of the Cleveland Browns having to face a difficult choice when his franchise gets the number one draft pick. While Moneyball is based on a true story, Draft Day is about a fictional draft. In terms of revenue both did well but Moneyball outperformed Draft Day at the box office, taking in $110,206,216 in comparison to Draft Day’s $29,462,046 gross. The first of these titles did however have a $50m budget, double that of Draft Day.
When it comes to statistical dramas for soccer there doesn’t seem to be any demand (and maybe a skimpy supply of good stories). In fact, I think the opposite is wanted by public audiences. The big screen attracts emotional stories about selecting soccer players. There's plenty of good examples of this. In 1997 David Evan directed an adaption of Nick Hornby’s classic Fever Pitch, following the Paul Ashworth's (Colin Firth) romance with Arsenal football club and his partner Sarah Hughes. This was one of the first ever serious adult books about football I read. An American version of Fever Pitch was made in 2005 and grossed over $50m at the box office.
Maybe the best example that captures the emotions of buying and selecting footballers is the 2009 movie The Damned United. This is one of my favorite films and is adapted from David Peace’s best-selling novel of the same name. The controversial movie is largely fictional but does a brilliant job interpreting Brian Clough’s 44 day tenure as Leeds United manager in 1974 and the events leading up to his appointment. There is no statistics available to Cloughie who is uncannily played by Michael Sheen; left with intuition, the experience of Peter Taylor and emotions by the bucketful he boldly assembles a Derby squad to quickly climb through the divisions.
While there's plenty of emotional sporting movies about U.S sports, it will be interesting to see whether a socceronomics tale will ever make it to a big screen drama this side of the pond. Interestingly, it seems the critics deem both the emotional and statistical stories to be as entertaining. The Damned United and Moneyball both score 7.6 on IMDB.
 By John Eakins
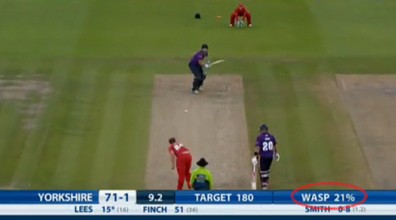
Those of you who are fans of cricket and particularly the ODI (One Day International) and Twenty 20 limited overs versions may have noticed a new feature introduced by Sky Sports in their cricket coverage. Known as WASP or the Winning and Score Predictor, this statistical tool acts as a very simple way of tracking the outcome of the match. In essence it has two features, firstly predicting the total score of the team batting first and secondly predicting the chances of winning for the team batting second. The latter is given in terms of a percentage, so for example if the WASP equals 20%, then the team batting second has a 20% chance of winning at that point in the match. I’m sure many of you are probably saying “so what?”, but Cricket is a game where, because of the way the scoring works, assessing who is winning at a point in the match can be very subjective. What is particularly interesting about the WASP (and what can add to the intrigue of the match) is that its value is recalculated ball by ball. So if a team batting second hits a six, the WASP percentage will increase whereas if the team loses a wicket, the WASP percentage will decrease. And as is often the case with run chases in cricket, a team’s chances of winning can fluctuate throughout the innings and potentially go from the very low to the very high (and vice versa) within a few balls. The other interesting feature about WASP is that it was developed by two economists at the University of Canterbury, Dr. Scott Brooker and Dr. Seamus Hogan. Brooker carried out the research as part of his PhD studies under the supervision of Dr. Hogan. A working paper on the subject can be found here. A less technical description of the underlying methodology and a set of frequently asked questions about WASP can be found here and here on a set of blog posts by Seamus Hogan. In these posts he makes the point that WASP is not a predictor of who is likely to win the game but rather a predictor of who is winning at a particular point during the match. He gives an example of a match involving Australia and Ireland. If Ireland bat second and get off to a great start, posting a lot of runs in the first couple of overs and not losing any wickets, the WASP score is likely to show them to be winning at that time. Most cricket observers (and bookmakers!) would still however have Australia as their favourites given their past performance. And this is essentially how WASP works. It takes data from past cricket matches and predicts who is winning if the two teams are playing on an average basis, that is, playing based on the average performance of a top-eight batting team against a top-eight bowling/fielding team. It doesn’t take into account the relative strengths or current form of the teams and players. So it’s not perfect but it does make for interesting viewing especially in tracking the progress of the WASP as the game progresses and in the final few overs of a close game when WASP values can change dramatically. By David Butler Over the past weeks many sources (The Economist & The Score) have highlighted the economics of swapping stickers, something which I spoke about on BBC Radio Five Live last week. Since nostalgia appears to be the order of the day, here’s some more for those of a particular vintage. It’s probably safe to say that during my childhood in the late 80’s and 90’s computer gaming ‘went mainstream’ as consoles like the Nintendo, the SNES and the Sega Megadrive became commonplace in many households. After these 3rd and 4th generation consoles, that had a variety of football titles with different makers (Goal, ISS Deluxe, Sensible Soccer and of, course, Kevin Keagan Player Manager), the concentration ratio for football titles got an awful lot higher as Pro Evolution Soccer (a Japanese variant of ISS) and FIFA soccer, became the two dominant titles in the later generations of Playstation-N64 and Playstation2-Xbox. Aligning yourself to musical talents, or sporting clubs is something that every teenager has experienced. For my generation you could add gaming franchises to list where one must draw an ideological line. The oft mentioned enquiry to this day is “whether you were/are a Pro-Evo or FIFA player?" The answer to this question sparks many a debate. 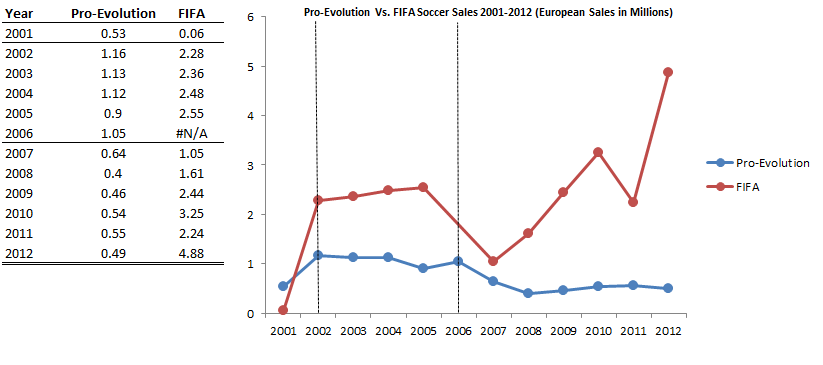 By John Considine This week there has been plenty of column inches in the print media, and large amounts of airtime on broadcast media, devoted to one aspect of the next round of broadcast rights to GAA games - the Sky element. This blog has also posted on the issue (here and here). One aspect of the coverage has focused on the exclusion of viewers who do not have access to the relevant Sky Sports package. This debate is usually framed in terms of a comparison between TV viewing figures on Pay-TV versus free-to-air. UCD historian Paul Rouse, and his work, have featured heavily in the discussion on the issue (see previous post on Paul's work here and a NewsTalk Off-the-Ball interview with Paul at 19mins in Part 2 of the programme of April 3rd here). Therefore, for a small novelty value, I would like to look at the large numbers of people that are excluded when a game is not available on TV. A comparison of the number of TV viewers and those who attended last September's All-Ireland finals is a useful place to start. Table 1 below shows that for the All-Ireland football final between Dublin and Mayo there was 12.65 people who watched the game on RTE TV for each member of the public inside Croke Park on the day. The ratio for the drawn and replayed hurling games are 10.84 and 7.56 respectively. The lower figure for the replay is influenced by it being broadcast on a Saturday evening. 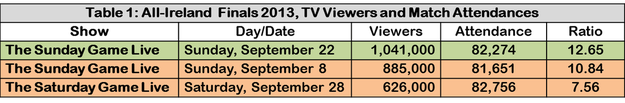
An advantage of looking at the figures for the All-Ireland is that the attendance figures are fairly steady at around 82,000. The variation in the ratio comes from the TV audience. Most of the spectators at an All-Ireland final will be from one of the competing counties (this is particularly so for a replay and may help account for the larger attendance). While the TV audience is more widely spread, it is probable that having Dublin in the final contributed to the viewership figures as its population is 1,273,069. The combined county population for the football finalists is 1,403,707 while that for the hurling finalists of Cork and Clare is 636,228. A feature of All-Ireland finals is that, as designated sporting events, they have to be broadcast on free-to-air TV according to the Irish application of the Television Without Frontiers directive. Therefore, there is not a decision about whether or not to put these events on TV. However, when games that are not designated events are not on TV then there is a loss of viewers. We can approximate the ratio of TV viewers to those attending by repeating the above analysis for other games. It is an approximation because it is difficult to say how many did not attend the games because they could watch it TV. I did this a number of years ago for about 160 games during the 2006-9 seasons. The ratios of viewers to attendees is presented in Figure 1. 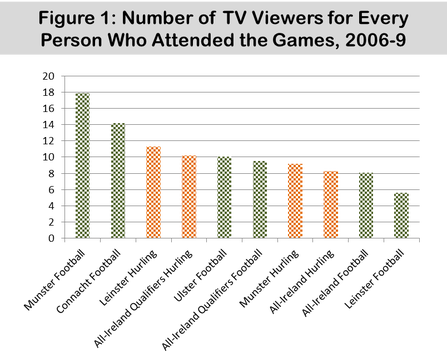
For all games the ratio of TV viewers to spectators was 8.83. The ratio for all hurling was 9.37 whereas that for all football games was 8.51. Figure 1 further decomposes these figures. The large ratio for Munster football ratio is probably exaggerated because it has only three games included.
At present the GAA games tend to be scheduled and broadcast on Saturday evenings and Sunday afternoons. The above numbers are for games on such "slots". Where one of these slots are left without a free-to-air TV game then the GAA is missing out on promoting inter-county games. However, even here the analysis is approximate, as it could be argued that a day free of inter-county games on TV provides a chance for people to go to a club game. 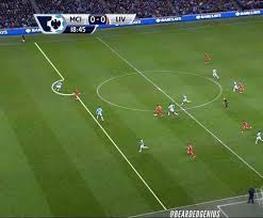 Sterling is wrongly flagged offside against City Sterling is wrongly flagged offside against City By David Butler
Last year I raised a point regarding the costs of goal-line technology and asked whether the difference in the margin of error between a referee’s eyes and the Hawk-Eye system was really worth the reported price the Premier League paid for the equipment. Judgment error is quite rare in the case of critical goal line decisions but given the limitations of the human eye, perhaps fatigue or the viewing angle of the assistant, and sometimes due to the speed of the players in question, wrong calls relating to the offside rule are far more frequent. Research on offside decisions made during the 2002 World Cup suggested that the error percentage for offside calls was 26.2% and that these decisions are more likely to occur earlier in a match. Further analyse suggested that this error rate dropped to 10% in the 2006 World Cup. A paper that reviewed decisions just in the English Premier League reported an error rate of 17.5% (868 out of 4960 observations). A recent paper in the journal of Recent Advances in Computer Science and Information Engineering claims to have devised a technological solution that may potentially lower this error rate. The work suggests that the precise coordinates of all parties involved in an offside decision can be reconstructed through technologies such as computer vision and image processing. The researchers have produced and experimentally tested an algorithm which they believe can be used to assist as an electronic referee (as issues of 'who is interfering with play' will likely arise). An interesting development but I think a long way to go for a technology that could (depending on its cost and accuracy) be of far greater practical value than Hawk-Eye. By David Butler The introduction of the Hawk-Eye goal line technology at the start of the 2013-2014 Premier League season has been broadly welcomed by most and viewed as a sign of football’s gradually progressive stance toward the introduction of technology. The Hawk-Eye system has been rigorously tested over a three-year period and is, by most accounts, accurate to within 4mm. But is this goal-line technology system really worth it? According to the Daily Telegraph last week, It costs £250,000 to install 14 cameras (7 per goal) in any Premier League ground. That works out at a cost of £5m for the introduction of the Hawk-Eye system in all Premier League stadia. There are 380 matches in a Premier League season, so the cost of the technology is £13,157 per game for one season. While the introduction of Hawk-Eye is a fixed cost and can be spread out over numerous years, this figure seems high, especially when one takes account of the frequency of goal line incidents. Although we have a tendency to remember goal-line incidents, often due to the sense of controversy and injustice they can create, there are in fact few occurrences of contentious goal line decisions. There was a reported 31 occasions in the 2012-2013 Premier League where goal line technology would have been useful for the match officials. That works out at a cost of £161,290m per incident. This is especially worrying when in fact most of these decisions (90%) were actually called correctly by the officials. Premier League referee's, of course, want to remove this error. Official Anthony Taylor recently welcomed the system saying that “although we had 31 incidents in the Premier League where such a system may have aided our decision making, three of those decisions were called incorrectly so anything that can help us improve our accuracy on major decisions is always welcome."
Even if we assume that the technology will not depreciate or require further expenditure, the costs remain high. Estimating with last season’s statistics on goal-line incidents, it would still cost £16,129 per incident over a ten year period and £1,315 for each of the 3800 matches (thats not even taking account of the additional expenditure required for installing camera's in the stadiums of newly promoted clubs). Given that the accuracy of the Hawk-Eye system has been previously doubted in a 2008 paper by Harry Collins and Robert Evans, I think the burning question is whether the difference in the margin of error between a referee’s eyes and the Hawk-Eye system is really worth the price? As ever, notions of fairness and justice can often fly in the face of our traditional understanding of rational decision-making. |
Archives
June 2024
About
This website was founded in July 2013. Categories
All
|
 RSS Feed