The Economics of Sport
  • Sports Economics
  • About
  • Workshop
  • Selected Publications
  • Book Reviews
  • A Primer on Gaelic Games
  • Upcoming Events
  • Media
  • Education
  • Resources & Links
  • Data

Tokyo, GDP And Who Are The Champions?

15/8/2021

 
By Robbie Butler

With the delayed 2020 Summer Olympic Games now over, the medal table looked pretty much as expected. The USA were 1st (39 Gold/113 Total), China 2nd (38 Gold/88 Total), Japan 3rd (27 Gold/58 Total) and Great Britain (GB) 4th (22 Gold/65 Total).

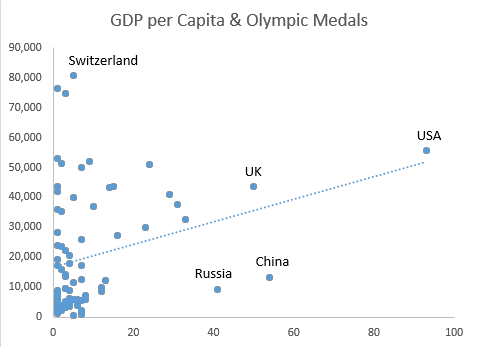
When one thinks about the factors that help countries accumulate medals at the Games, it would appear on the surface that GDP is very important. The USA, China and Japan had the largest GDPs in 2020 and won medals in that order. GB in 4th in the medal table had the 5th biggest GDP in 2020. Had Germany finished 4th instead of 9th, there would have been a perfect match between the medal table and GDP in 2020.

Of course, it is much more complex than that. A recently published paper by Vadim Kufenko and Vincent Geloso in the Journal of Institutional Economics explores this. 

Using data from the Economic Freedom index and the medal table at the 2016 Summer Games in Rio, the authors test the relationship between success and inequality. They find "inequality only matters in determining medal numbers for unfree countries". Free society success at the Games is not effected by the level of inequality within countries. Instead they authors argue that  "institutions [within free societies] generate incentives to invest in the talents of individuals at the bottom of the income distribution". 

From an Irish perspective, we can relate to this. We won two gold medals (rowing and boxing), one of which was won by an competitor from a low income area in Dublin. The paper argues that the incentives in place in a country like Ireland mitigate the negative effect that inequality plays in the selection of athletes and their success.

The Spiraling Cost Of The Summer Olympics at Tokyo 2021?

10/3/2021

 
By Robbie Butler,

This blog/website was launched in July 2013. Not long after Tokyo, Japan was awarded the 2020 Summer Olympic Games. Two of the very first posts I ever wrote focused on this and can be found here and here. In the second post from September 2013 I say:

       "A projected cost of $8 billion by the Japanese seems way too conservative.  An examination of recent past games would suggest, a figure of $15 billion to $18 billion is more likely to represent the true cost of the games. Eight years is a long time to wait but watch this space…"

As we know all too well, the Games were postponed in 2021 until this summer. By last year the cost of the Games had risen from the original $8 billion to $12.6 billion. No surprise there for anyone that has read any past literature on the topic. 

The delay in. the Games to this summer has not helped and has cost both Tokyo and the International Olympic Committee (IOC) money. A recent study by the University of Oxford estimates that the Toyko Games could now cost almost $16 billion.

And it could get worse. Those in favour of hosting such mega-events often point to the economic gains that can be made. Sure, these exist, but they are often in the private domain. The 'public gain' is found in the net increase in tourist arrivals which generates welfare effects from additional consumption and tax revenue. If recent reports emerging from Japan are correct, there may be an outright ban on foreign tourist arriving for the Games due to Coivd-19, thus eliminating one of the single biggest benefits in the public domain.  

if the Games are attended by Japanese fans only, there will be substitution effects but little or no income effects. It is simply the replacement of one purchase (a ticket to watch track events) with another (an endless list of alternatives). Japan might be on-course to record one of the single biggest public losses on any Summer Games if this is the case. Not that the revenue generated from foreign arrivals could go anywhere near the $16 billion costs to date, but it could close this gap by $3bn-$5bn potentially. 

Such evidence is now overwhelming and needs to be kept in mind for future suitors. 

A Vote For 2026

5/11/2018

 
By Robbie Butler

In 1988 Calgary hosted the Winter Olympics. The Canadian city overcame competition from Falun in Sweden and the northern Italian town of Cortina for the right to host the games. Some thirty years later, Calgary once again wants to host the Games. This time it must overcome obstacles at the home, the most obvious being the local taxpayer.

In order for the bid by Calgary to continue, local taxpayers are going to the polls next week in order to decide if some $2.8 billion dollars of public money should be used to fund the Games.

Canadians are better placed that most when it comes to such questions. The 1976 Summer Games in Montreal  is a classic example of a spending overrun. The Olympic Stadium cost more than 5 and a half times the original estimate and ended up with an outlay of around $1.4 billion. The legacy of this meant that Canadian's were still incurring the financing cost of the stadium until 2006. Somebody born in 1977 (the year after the Games), assuming they began paying taxes at 18 years of age, contributed for 11 years for a Games that haven't occurred in their lifetime. 

This time around it is somewhat different, and locals will get the chance to decide whether they should continue with the bid. It is interesting to note that in recent years Olso, Kraków, Lviv, Stockholm, Graz, Sapporo and Sion have all withdrawn Winter Olympic bids. Stockholm, having withdrawn from the 2020 race will also vote on a bid for 2026. Quite aptly for Calgary, Cortina has also expressed an interest in bidding, and like the Swedes and Canadians', will put the bid to a public vote.

It will be very interesting to see the outcome of next week's vote in Calgary. Should the vote pass, and the city be selected by the International Olympic Committee (IOC) as the preferred host, many things will happen. Hosting the Games will bring a sense of pride and civic engagement. Many locals will be excited in the lead up to the event, and the hosting of the Games themselves may cause the general mood to heighten further. One thing that won't happen -the taxpayer in Calgary will not make money from the event. 

Winter Olympics Passes to Beijing 2022

26/2/2018

 
By Robbie Butler

The 2018 Winter Olympics closed in Pyeongchang, South Korea in the early hours of this morning to much fan fare. The ceremonial event involved the passing of the Olympic Torch to Beijing where the 2022 Winter Games will take place. Beijing will host its second Olympics in 14 years, following on from the Summer Games in 2008.

Much has been written on this blog about the hosting of major sporting events and the costs involved. In a previous post, I also addressed the number of bidders prior to the voting for the Summer Games. Not surprisingly, given the costs involved there has been a gradual decline in the number of bidders, from a high point in the 1990s, to more recent times. The graphic below presents the number of bidders for both the Summer and Winter Games from 1984 to the Summer Games in 2028. 
Picture
The Winter Games appear to be following a similar trend to Summer version. For the years 1984 to 1992 all Games were held in the same years. This changed in 1994 when the Winter Games broke for the Summer schedule.

Since the start of this decade there has been a consistent decline in the number of bidders for both sets of Games. The Winter Games has seen a fall from 8 in 2010, to 7 in 2014, to 3 in 2018, to just 2 for the 2022 Games. 

The Summer Games went one step further when Paris and Los Angeles effectively agreed to let each other have a solo run at the 2024 and 2028 Games respectively.

While the destination of the 2026 Winter Olympics will not be known until the 134th International Olympic Committee Session in Milan, Italy during September 2019, it will be interesting to see if all four potential hosts currently suggesting they will be, will actually do so. If Sion, Sapporo, Stockholm and Calgary all do, they will buck the recent trend in host bidding.

Comparing Olympic and Paralympic Performance – Underachieving Nations

10/10/2016

 
By Stephen Brosnan

Previously, I have discussed (here) the best performing nations at the Paralympic games relative to their Olympic counterparts. In this post, I look at the worst performing nations at the Paralympic games relative to the nation’s Olympic athletes to provide possible explanations for the drop in performance levels individuals with disabilities relative to others. As previously discussed, comparing Olympic and Paralympic performances is not so straight forward given that there are many more medals distributed in the Paralympics compared to the Olympics. In Rio 2016, 974 Olympic medals were awarded while 1597 medals were distributed in the Paralympics. Thus, when comparing the performances of countries it makes sense to consider the share of total medals the country won rather than absolute values.
​
The Table below reports the worst performing countries measured by the percentage of medals obtained by countries in the Paralympics relative to the Olympics. 
Picture
The United States is the worst performing nation in terms of differences between shares of total medals in the Olympic and Paralympics. While the US Olympians claimed 12.42% of overall medals in Rio, the US Paralympians claimed only 7.20% of total medals. The United States finished fourth overall which considering their income per capita and population, two indicators which increase the likelihood of success, could be considered a major underachievement.  A recent article in the Independent (here) insists that this underperformance is no coincidence and can be linked to a lack of investment in Paralympic athletes with no central government funding in existence while arguing that it reflects the lack of support in the US for those who are disabled.

Japan were the second worst performing nation relative to their Olympic athletes, finishing 59th overall, their worst ever performance. The performance has prompted Japanese Paralympic Committee (JPC) President Mitsunori Torihara to insist the country must analyse their performance to decide which sports to concentrate on when the country hosts the Paralympic Games in 2020. Furthermore, the JPC plans to roll out educational programmes for the public to raise awareness of the sport. These measures in addition to extra funding available as a result of hosting the event in 2020 should give the country a good opportunity to improved their Paralympic performance.

Olympics and Paralympics Medals – Differences in Country Performance

28/9/2016

 
By Stephen Brosnan

Previously on this site, Robbie Butler discussed some potential socioeconomic determinants of success in winning Olympic medals (here) and how the UK’s investment in athletic programs has contributed to increases in medal counts (here). In this post, I examine the differences between countries performances at Olympic and Paralympic games to identify differences in attention and resources devoted to individuals with disabilities relative to others.
​
Comparing Olympic and Paralympic performances is not so straight forward given that there are many more medals distributed in the Paralympics compared to the Olympics. Since it is more difficult to guarantee a level playing field among individuals with disabilities, a more complex classification of sport events is often required. As such, in Rio 2016, 974 Olympic medals were awarded while 1,597 medals were distributed in the Paralympics. Thus, when comparing the performances of countries it makes sense to consider the share of total medals the country won rather than absolute values.

The Table below reports the top 10 countries measured by the percentage of medals obtained by countries in the Paralympics relative to the Olympics. 
​​Seven countries are represented in both the top 10 for shares of Olympic medals and Paralympic medals. These countries include USA, China, Great Britain, Australia, Brazil, Italy and Germany. Table 1 shows Ukraine is the country with second largest difference between shares of total medals in the Olympic and Paralympics. While Ukraine finished 29th overall in share of total medals in the Olympics, the country finished 3rd overall in shares of Paralympic medals. The performance of the Ukraine is surprising given its modest population and income per capita relative to its competitors and ongoing war and political turmoil in the country. 
Picture
Table 1. Difference between Countries share of Paralympics medals and Olympic
​Much of the country’s success at the Paralympics has been attributed to its investment in a programme called ‘Invasport’, under which each region in Ukraine has at least one school dedicated to sports programs for the disabled. This increase in investment has led to considerable results, similar to Team GB’s investment in their Olympic programmes which brought greater success in Rio.

China is the highest ranked country for Paralympic medal wins representing 14.97% of total medals won. This is a 7.78% difference to their share of Olympic medals (7.19%). This could be considered an indication of the country’s progress in increasing standards in social civilization. However, research carried out by Brittain (2006) suggests that rather than being a measure of national social and economic development, success at the Paralympic games is used for political propaganda which the author calls ‘athletes as a means to a political end’. 
​
Research focused on differences between Olympics and Paralympic games is currently underdeveloped particularly when comparing the different determinants of success across the two platforms. As such, researchers are provided with many potential opportunities to fill these knowledge gaps in the future. 

Romans Abandon Their Bid

22/9/2016

 
By Robbie Butler

Rome yesterday joined Boston and Hamburg becoming the 3rd city to abandon plans to host the 2024 Summer Olympic Games. Mayor Virginia Raggi’s election in June was based on a number of issues including a commitment to end plans to bid for the Games.

The proposed €5.3 billion budget will now be used for 'other' projects.  

Raggi cited the fact that Rome is still supposedly paying for the Olympics it hosted in 1960! Three cities still remain in the race Budapest, Los Angeles and Paris. So long as there is more than one the power rests with the International Olympic Committee (IOC). 

I wonder will other cities and countries follow Rome's move...

Andrew Zimbalist Circus Maximus: The Economic Gamble Behind Hosting the Olympics and the World Cup provides an excellent analysis of the economic costs and benefits of this and similar mega-sporting events. 

The Success of Team GB

24/8/2016

 
By Robbie Butler

With the Rio Olympic Games at an end, I thought it timely to consider the medals table. Unsurprisingly, Team USA retained top spot. However, the performance of Team GB is worth noting.

The graphics below present the number of medals won, and the total number of gold medals won by host countries during their Games and the Games four years later. Team GB bucked a recent trend and managed to win more medals in Rio than they did four years earlier at London 2012. 
Picture
Picture
This is quiet an achievement and can be largely explained by investment by Sport UK in Olympics athletes and the funding model adopted by the governing body.

Currently, more than £350 million is allocated to both Olympic and Paralympic sports. This is an increase of more than 10% on the London Games in 2012. UK Sport provides a breakdown of this allocation by sport here. It appears that the heavy investment in cycling, rowing and athletics all paid off, with eleven, five and seven medals won respectively. Other sports, that could possibly have done better given the level of investment were sailing, swimming and boxing. 

Given the strategy of Sport UK, under performing sports need to be careful. Some have had there funding cut, or eliminated entirely. Basketball, one of the most popular team sports in Great Britain, receives no funding from UK Sport. It does get roughly £10 million from Sport England but this does not go to fund Olympic pursuits. This is due to the perceived under performance of Team GB four years ago. Not surprisingly, Team GB didn't compete in Rio.

It's likely that athletics, cycling, equestrian and rowing will all receive increases in funding. Expect to see Team GB athletes dominating podium in these sports at Tokyo 2020. 

Some Olympic Insights

18/8/2016

0 Comments

 
By Robbie Butler

Based on the Medal Table at lunchtime (GMT) on Thursday (18th) I decided to have a look at the relationship between GDP per capita, population and medals won at the Summer Olympic Games in Rio, Brazil. 

Not unsurprisingly the United States (93), China (54), Great Britain (50), Russia (41), Japan (33), France (31), Germany (29), Australia (24), Italy (23) and South Korea (16) occupy the top ten places in the medals table. The ten are amongst the biggest economies on the planet, measured by GDP. Eight of the ten are in both top ten lists.

Below are two graphics to digest. The first considers the medals haul of the seventy-nine countries that have made the podium so far and GDP per capita. The second plots medals won and population. Those below the trend-line in each graph are outperforming the mean, based on either output per person or population. 
Picture
Picture
0 Comments

Should Irish Boxers Be Worried?

29/2/2016

 
PictureIrish Medal Tally at the Olympic Games
By David Butler

Last week Matt Cooper spoke about the possibility of allowing professional boxers compete in the Rio Olympics on his talk show the Last Word. The guests considered the merits of the AIBA’s proposal and the implications for Ireland. The aim is to abolish rules that stops boxers with 15 or more paid bouts from competing at the Olympics. The Independent newspaper carried the story and details last Wednesday. 

While Ireland’s Katie Taylor said the new rules would not alter her preparation, the re-design could spell trouble for Ireland’s medal chances at Rio. 57% of our Olympic medals have come from boxing – two gold’s, five silvers and nine bronze. The table shows Ireland's medal tally at the Olympic games.  

While nothing would be stopping Irish professional boxers from competing for a gold, something tells me that our share of boxing medals may not be as high if the proposal is ratified.You would have to worry for the amateurs, surely Wladimir Klitschko would like to add more Olympic golds to his CV?

<<Previous

    Archives

    March 2023
    February 2023
    January 2023
    December 2022
    November 2022
    October 2022
    September 2022
    August 2022
    July 2022
    June 2022
    May 2022
    April 2022
    March 2022
    February 2022
    January 2022
    December 2021
    November 2021
    October 2021
    September 2021
    August 2021
    July 2021
    June 2021
    May 2021
    April 2021
    March 2021
    February 2021
    January 2021
    December 2020
    November 2020
    October 2020
    September 2020
    August 2020
    July 2020
    June 2020
    May 2020
    April 2020
    March 2020
    February 2020
    January 2020
    December 2019
    November 2019
    October 2019
    September 2019
    August 2019
    June 2019
    May 2019
    April 2019
    March 2019
    February 2019
    January 2019
    December 2018
    November 2018
    October 2018
    September 2018
    August 2018
    July 2018
    June 2018
    May 2018
    April 2018
    March 2018
    February 2018
    January 2018
    December 2017
    November 2017
    October 2017
    September 2017
    August 2017
    July 2017
    June 2017
    May 2017
    April 2017
    March 2017
    February 2017
    January 2017
    December 2016
    November 2016
    October 2016
    September 2016
    August 2016
    July 2016
    June 2016
    May 2016
    April 2016
    March 2016
    February 2016
    January 2016
    December 2015
    November 2015
    October 2015
    September 2015
    August 2015
    July 2015
    June 2015
    May 2015
    April 2015
    March 2015
    February 2015
    January 2015
    December 2014
    November 2014
    October 2014
    September 2014
    August 2014
    July 2014
    June 2014
    May 2014
    April 2014
    March 2014
    February 2014
    January 2014
    December 2013
    November 2013
    October 2013
    September 2013
    August 2013
    July 2013

    About

    This website was founded in July 2013.

    RSS Feed

    Categories

    All
    American Football
    Athletics
    Baseball
    Basketball
    Behavioural Economics
    Boxing
    Broadcasting
    Competitive Balance
    Cricket
    Cycling
    Darts
    David Butler
    Declan Jordan
    Drugs
    Ed Valentine
    Epl
    Esports
    Expenditure
    F1
    Fifa World Cup
    Finances
    Funding
    Gaa
    Gaelic Games
    Gambling
    Game Theory
    Gary Burns
    Geography
    Golf
    Greyhound Racing
    Guest Posts
    Horse Racing
    Impact Studies
    John Considine
    John Eakins
    League Of Ireland
    Location
    Media
    Mls
    Mma
    Olympics
    Participation
    Paul O'Sullivan
    Premier League
    Regulation
    Research
    Robbie Butler
    Rugby
    Simpsonomics
    Snooker
    Soccer
    Spatial Analysis
    Sporting Bodies
    Stephen Brosnan
    Swimming
    Taxation
    Teaching
    Technology
    Tennis
    Transfers
    Uefa
    Ufc
    World Cup
    Wwe

Related

The website is not formally affiliated to any institution and all of the entries represent the personal views and opinions of an individual contributor. The website operates on a not-for-profit basis. For this reason we decline all advertisement opportunities. 

Contact

To contact us email sportseconomics2013@gmail.com or find us on Twitter @SportEcon.