The Economics of Sport
  • Sports Economics
  • About
  • Workshop
  • Selected Publications
  • Book Reviews
  • A Primer on Gaelic Games
  • Upcoming Events
  • Media
  • Education
  • Resources & Links
  • Data

Football League Position and Voting to Leave

29/3/2019

 
By Robbie Butler

Inspiration for this post comes from my friends at the University of Liverpool who should take credit for what appears below. I hope it does justice to their hunch that there may be a relationship between Football League position and the results from the 2016 United Kingdom European Union membership referendum.

What appears below is data for 23 English cities with clubs playing in the Football League this season according to their current league position as of today and the Brexit vote

Where a city has more than one team, the average league position for all teams is reported. For example, in Greater London covers 11 teams (Arsenal, Chelsea, Crystal Palace, Fulham, Tottenham, West Ham, Brentford, QPR, Millwall, AFC Wimbledon and Charlton). 

The cities on the left of the diagram below voted to leave the EU, while those on the right voted to remain. ​
Picture
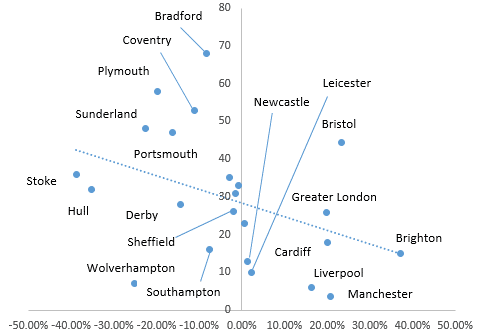
The y-axis measures current league position on a scale of 1 to 92. 92 corresponding to bottom of League Two. The x-axis measures the margin between Leave and Remain votes in the 2016 referendum. For example, Stoke-on-Trent reported the largest difference, where 69.4% of people voted to leave the EU and just 30.6% voted "remain". The margin is therefore -38.8%. 

At the other end of the spectrum, Brighton and Hove voted 68.8% (Remain) and 31.4% (Leave), the margin being 37.2%.

As I have plotted the "Remain" option as positive (my implicit pro-EU bias), this means the greater the number of remain votes, the lower the league position. It is no surprise to see the strong remain urban centres of Liverpool, Manchester and Cardiff appear in the bottom right of the graph. Greater London is, on average, under performing but this is obviously an aggregate observation and should be treated as such. Bristol is the biggest under performing pro-EU city, largely because Bristol Rovers compete in the 3rd tier of English Football.

On the other side, pro-leave cities that are arguably doing better than one might expect include Wolverhampton, Southampton, Sheffield and Derby. Sunderland, Portsmouth, Plymouth, Coventry, Bradford and Stoke certainly support the view that leave voter come from places with football clubs that play in the lower tiers of English football.

Of course, there are many reasons why this might be the case. I will explore these at a later date.

Thoroughbred Horseracing Industries MBA

28/3/2019

 
By Robbie Butler

I had the pleasure of lecturing the Thoroughbred Horseracing Industries MBA class at the University of Liverpool this week. We discussed funding horse racing in Ireland and the possible consequences of Brexit. The group came from a variety of industry stakeholders throughout these islands. 

At a general level, horse racing in Ireland is in relatively good health. According to Horse Racing Ireland (HRI), Irish bloodstock sold at public auction was to the value of €161.5m last year. While racecourse attendances continued to decline in 2018, large racing festivals are starting to attract record attendances again in recovery-Ireland. Prize-money also grew by 3.9% to €63.5m in 2018. it should be noted, more than 60% of this is sourced from budgetary support. 

While this annual report is largely positive, Brexit cases a shadow over the (very near) future. The eight "No" votes last night in the UK Parliament means a hard Brexit in early April remains a possibility.

30 years of progress within Irish racing could be undone over night. Chief concerns are centred on the Irish bloodstock industry, animal welfare and the tripartite agreement between Ireland, Britain and France. It remains to be seen how this will be affected in the weeks ahead and it should come as a concern that Aintree 2019 might be the last as we currently know it. 

While Irish racing successes in Britain have probably never been as obvious, the next two weeks will dictate if this could continue into the future, or come to a crashing halt. 

The League of Ireland Attendance Dip

26/3/2019

 
By David Butler

As I showed in a post some weeks back here, the average attendance on the opening day last season for the league of Ireland was 2,892. This increased to 3,558 this season. This was good news for the LOI but, as I mentioned, the challenge is retaining fans for the second home game.

The chart below shows the attendance  at the first and second home match this season for each club. While I know there is many moving parts here (day the match is on, derbies,  fixture quality, away fans willingness to travel etc.), we see a drop off for most clubs. This occurred last year and my guess is that it is a recurring effect - many casual fans are attracted to the opening day but, for the most part, do not return.

Bohs and Rovers both saw an increase in attendance -  both sides had two wins under their belt before the second home match (and Bohs were playing Rovers). Finn Harps were the only other increase. Perhaps being back in the Premier division brings a certain novelty factor.
Picture

The Road to Euro 2020

22/3/2019

 
By Robbie Butler

Qualifying for Euro 2020 started last night and continues over the coming days. Scotland got off to the worst possible start losing by three goals to nil in Kazakhstan. The positive news for the Scots is that qualifying for the Euro's is not as difficult as it once was. The competition structure has changed quite dramatically since the early years of the competition, and next year 24 of the 55 UEFA members will appear at the finals. That's not far off one in two nations.

If one discounts the seven lowest ranked teams in UEFA (Gibraltar, Faroe Islands, Latvia, Liechenstein, Andorra, Malta and San Marino), every second country entering the competition will qualify.

Compare this to Ireland's first appearance at a Final's - Euro '88. While there were just 32 UEFA members, only 8 appreaded in Germany at the Finals. Just seven qualified as the hosts were guaranteed a place at the party. This means roughly 4 out of 5 countries watched on as Ireland famously toured Stuttgart, Hanover and Gelsenkirchen. This probably remains the countries biggest achievement when it comes to tournament qualification.
Picture
The figure illustrates the fraction of UEFA teams that could qualify for World Cups and European Championships from 1986 to 2020. ​

The trend line is almost flat (slightly rising). The interesting quirk in the data, if one looks closely at the years, is the flip in difficulty between competitions. In 1988 and 1992 the Euros were hard to get to, the World Cup much easier. Today the Euros have expanded meaning the chances of qualifying are much higher. World Cup qualification from Europe is much tougher and is likely to stay at way even after the competition expands.

So disappointed Scotland fans waking up this morning should take comfort. Yesterday's loss might not be as damaging as in the past. The Euro Finals are not what they once were. 

Beating the Bookies

12/3/2019

 
By Robbie Butler

As is tradition this week, we turn to the Cheltenham Festival. Over the past years we have tested whether rules of thumb such as following certain jockeys or trainers offer a successful strategy for beating the market. This year I will try something different and am deferring to the knowledge of those within the industry.

For the next 4 days we will follow a selection of industry professionals listed in the Irish Daily Star and Paddy Power supplement, making predictions across all races each day.  

I will assume a consistent betting stake with updates to follow during the week.

Let's see if the "experts" can beat the bookies!

DAY 1

Day 1 appears to be a day for the bookies. The table below presents the results for our ten experts, that are sourced from many aspects of the racing industry.

We assume a €10 stake in all races. Each way predictions are assumed to be €5 on win and €5 on the place. In a number of instances the expert tips two horses. In these cases we split the stake, and put €5 on both. 
Picture
Only two experts are ahead after Day 1. Both are sports journalists. Brian Flanagan correctly tipped both Klassical Dream (6/1) and Beware The Bear (10/1). David Coughlan selected Espoir D'Allen each way (16/1). 

Matt Chapman, Ruby Walsh and Mick Fitzgerald all mention a winner but cite another horse in the same race. Hence a 0.5 correct score is reported. 3 of the 4 jockeys listed failed to pick a winner in any of the seven races. 

DAY 2 
​
Just two of our experts finished ahead after Day 2. TV Presenter Matt Chapman was certainly the man to follow. He tipped no less than 5 winners (including one each way) yesterday including Band of Outlaws and Envoi Allen, as well as Brewin'upastorm each way at 11/1. In total, the flamboyant television presenter made a profit of just over €57 on an even €10 stake.  

Mick Fitzgerald was the only other pundit to finish ahead and reported an impressive 90% increase in stake having correctly picked 2 from 3.

Overall results for Day 1 and 2 below. Just 3 of our 10 experts are ahead after the combined first two days of the Festival.
Picture

Days 3 and 4

The final standings are now presented. Not surprisingly, the bookies managed to get the better of all but of our experts. 
Picture
It is interesting to note, the two most successful punters during the four days of racing are journalists. The highest strike rate is that of retired jockey and pundit Mick Fitzgerald, who also tipped the fewest horses (17). 

The Gambling Prevalence of Irish Adults

11/3/2019

 
By John Eakins

This post is possibly opportune given the week that is in it. The end of last month saw the release of a survey on gambling prevalence by the Department of Health in Ireland (press release here, report here). It is part of a wider survey on the Prevalence of Drug Use and Gambling in Ireland and Northern Ireland. While the survey has been carried out at regular 4-yearly intervals since 2002, the most recent survey was the first to capture detailed information regarding gambling habits in Ireland. The survey sampled a representative number of people aged 15+ from August 2014 to August 2015, resulting in a sample of 7,005 respondents, a response rate of 61%.

The definition of gambling used in the survey was a broad one and included buying a national lottery ticket or scratch card, playing lottery games online, gambling in a bookmaker’s shop, gambling online or by telephone, placing a bet at a horse or dog race meeting, playing games at a casino, playing a gaming/slot machine, playing card games for money with friends/family and playing bingo. Table 1.1 reports the prevalence of gambling in Ireland where prevalence refers to the proportion of the adult population (15+) who have gambled in a particular time period (i.e. last year or last month). The table is reproduced below.
Picture
As can be seen, 64.5% of respondents report some form of gambling in the last year, while 41.4% report gambling on a monthly basis or more often. The most common form of gambling is on national lottery tickets or scratch cards, with 56.7% reporting this form of gambling in the last year, and 35.4% reporting this form of gambling on a monthly (or more frequent) basis. The next most common forms of gambling in the last year are gambling in a bookmaker’s shop (15.3%), and placing a bet at a horse or dog racing meeting (12.7%). It is interesting that online gambling at 7.3% last year and 3.9% monthly (or more frequently) is not as prevalent as perhaps one might have expected.

Table 2 in the report breaks down the figures on last year gambling by age. Overall gambling prevalence appears to increase with age with higher proportions in the 35-44, 45-54 and 55-64 age categories. The effect is non-linear however as it decreases for those aged 65+. In general, older people are more likely to buy national lottery tickets while younger people gamble in a bookmakers shop, at race meetings and online.

Table 4.1 and 4.2 separates last year prevalence by gender. In terms of all gambling activities, prevalence for males was slightly higher than females across all age groups except interestingly, in the 65+ age category. When broken down by the gambling activities, females gamble on the national lottery or play bingo to a greater extent while males gamble in a bookmakers shop, at race meetings and online. When looking at more frequent (monthly or more frequently) gambling (Tables 5.1. and 5.2), the figures are weighted significantly more towards males, that is, males engage in all forms of gambling on a more frequent basis than females and also across the different forms of gambling. In fact the only frequent forms of gambling than females really engage in is buying national lottery tickets.

Males also spend larger amounts on gambling than females, with high spending defined as spending more than €250 on gambling in the last year (Tables 6.1 and 6.2). The prevalence of high spending on gambling across all adults is greatest for the national lottery (11.2%), gambling in a bookmakers shop (4.9%), gambling at a race meeting (1.8%) and online or telephone (1.4%). The equivalent figures for males are 12.9%, 9.5%, 3.4%, 2.9% respectively.

Table 7 reports gambling prevalence by socio-economic group. Some interesting patterns are present here. Taking all forms of gambling initially, the report finds that higher socio-economic groups gambling more prevalently, a probable income effect. This effect is also present for most of the gambling activities particularly gambling online and placing bets at race meetings (the latter of which, interestingly, displays a very strong positive socio-economic effect). There is a weaker positive effect for playing the national lottery (i.e. effectively similar levels of prevalence across all socio-economic groups) and a strong negative socio-economic effect for gambling in a bookmakers shop.

Finally figures for the prevalence of problem gambling were also reported. Perhaps unsurprisingly, males are found to have a higher prevalence of problem gambling than females (1.4% vs. 0.2%) with problem gambling most common in young males (2.9% in the 25-34 age group).

So what can be taken from the survey? Generally the results are as expected. Males gamble more than females. Older people play the national lottery, younger people gamble in bookmakers, at race meetings and online. Males are more likely to be problem gamblers. One thing that I think is interesting to see, is the fact that the ‘traditional’ ways of gambling are still the ones that are the most popular. I would have expected larger values for online gambling for example but this did not arise.

Couple of points on this however, which are relevant for the rest of the results also. The survey was undertaken almost 4 years ago and even since then, one would expect online gambling to have increased. It is also hard to judge the values when there is no comparison with previous surveys i.e. no trend. It could be the case that online gambling, while low, is trending upwards and the traditional forms of gambling are trending downwards. Finally, as is the case with all gambling surveys, the level of non-reporting of gambling can be high because people may not want to report their gambling habits truthfully and they may also subconsciously tend to underestimate how frequently the engage in the activity and how much they spend. Not so much as problem with Robbie Butler however, as we will see over the coming days!

Revenue Sources for Football Clubs

8/3/2019

 
By John Considine
The latest Deloitte Football Money League (DFML) publication shows that the Top-20 clubs share approximately €8.34bn in revenue in 2018.  Just over 42% of that revenue comes from Broadcasting, 40% from Commercial revenue, and the other 18% from Matchday revenue.  However, there are some interesting differences in the distribution of that revenue.

The table below groups the clubs according to the country in which they operate.  There are 9 English clubs in the Top-20 and they share €3.73bn.  For these clubs broadcast revenue is by far the most important.  It is the source of just under half their revenue.  By contrast, the one French club in the Top-20 (PSG) receives less than 24% of their income from Broadcasting.
Picture
Broadcast revenue is the most important source of revenue for 7 of the 9 English clubs.  However, there are large differences in the level of importance - as illustrated in the table below.  Everton is the standout example.  Three-quarters of the club's revenue comes from the Broadcasting source.  Newcastle United and West Ham United are not far behind.
Picture

Incentives In The Six Nations

6/3/2019

 
Daragh O'Leary

Economic frameworks are built around the idea that people respond to incentives and government policies are often designed around them. Incentives can be observed anywhere in the world of sport but seen as it’s RBS Six Nations time again I thought I’d write something on what I think is a rather clever incentive in the competition which was recently discussed by Irish Examiner writer Peter Jackson. The incentive is the bonus prize money awarded to the team which wins the Grand Slam.

For those not familiar with the competition, the Grand Slam is when one nation manages to win all of their matches in the Six Nations. It’s a difficult task to accomplish but for the team that can pull it off it’s worth an additional €1.15 million to their prize money. This is obviously a great incentive for teams to try and remain unbeaten on the final day of the competition even if they have managed to win the Championship before the final whistle, but there is another key factor in this incentive structure which makes it great.

The Grand Slam prize money is taken from the other 5 nations in the competition, so teams like Italy who could be in last position with no hope of doing better on the final day of the Championship still have an incentive to try and beat a team that is going for the Grand Slam because it will save them €230,000.

Due to the structure of league formatted competitions, it can often be the case that top performing teams which are secure in their position often see no need to field fully strengthened teams and risk injuries to their players; it can also be the case that low performing teams who cannot escape their poor points tally regardless of their last few performances in a league also don’t play with as much desire to win. Consequentially this leads to less exciting games for fans to watch towards the end of league competitions if the winners and losers of the overall competition are known before the final few games of the league. The RBS Six Nation however, has found an interesting way to keep teams motivated to beat each other.

Are Spurs “doing a Moneyball”?

4/3/2019

 
By David Butler

Moneyball: The Art of Winning an Unfair Game is a well-known book by Michael Lewis, that tells the story the Oakland A’s innovative use of statistical techniques (sabermetrics) to exploit a hole in the labour market. The A’s commonly had one of the lowest team payroll’s in the league but won games at a discount relative to the competition. They did this by identifying how certain skills were mispriced such as on-base percentages and slugging percentages. While the A’s approach diffused relatively slowly, it could be imitated, and the competition caught up. In time, the anomaly was worked out of the market. 

In general, Moneyball is about developing an objective approach to valuing talent. As Lewis himself suggests the lessons go well beyond baseball and in many ways the book is not about baseball.

This brings me to the English Premier League and, in particular, Tottenham Hotspur.  The question is whether Tottenham should be considered in a similar light. Stephen’s post below considers wage efficiency. Here I look at transfer spend. All of the data for this analysis is sourced from Transfermarkt.

Are Spurs “doing a Moneyball”? While they may not be winning trophies they are paying far less per point in comparison to other Premier League clubs.

Spurs were the only English professional club not to make a single signing in this summer’s transfer window. Nor did Tottenham invest in talent in the most recent transfer window. They actually weakened their squad and let Mousa Dembélé go for £4.82m. An added complication is that Spurs are playing away from their home stadium.

Over 3 seasons from 15/16-17/18 Spurs have collected 233 points. Their net spend over this period (transfer incomes and expenditures only) was just over £27m. It works out that Spurs paid £116,180 per point in the English Premier League over the last three seasons.

The chart considers all clubs that have competed in the Premier League in the last three seasons. One exception is made. Over the past three seasons Southampton have ran a transfer surplus.  For every point they earned they actually earned £7,793. As the chart below shows Spurs have paid far less per point when compared to the competition. While this analysis does not control for wage budgets, Tottenham’s chairman Daniel Levy is renowned for his frugality and tough negotiation tactics when it comes to player remuneration.
Picture
Tottenham’s limited transfer market activity has been very successful from a purely economic perspective. The second chart below shows the difference between the estimated total market value of transfers minus the purchase value. Tottenham come out on top again. Transfermarkt data suggests that Tottenham have an added value of 60.9% to their squad. The second highest is Chelsea with an added value of 42.6%.
Picture

Efficiency Wages in Premier League

1/3/2019

 
By Stephen Brosnan

This post explores the relationship between Premier League club’s spending on both salaries and transfers and the number of points won during the current Premier League season.
Picture
Since 2015, Man United have had the highest annual player salaries amongst Premier League clubs. This year total salary paid out to players at Old Trafford topped £148 million. This includes the Premier Leagues top earner Alexis Sanchez, often founding warming up the United bench while picking up a hefty £315,000 p/w.

Cardiff City have the lowest wage bill in the Premier League this season. The newly promoted Bluebirds remained conservative in their approach to top flight survival. Cardiff’s summer transfer spending (£29m) was a fraction of the other promoted team’s spending. Fulham spent a hefty £105m during the summer while Wolves brought in £65m worth of talent. Only Tottenham (£0), Crystal Palace (£9.5m) and Newcastle (£23.2m) spent less than Cardiff last summer.

The question remains who have been the most efficient club in terms of spending on annual salaries? The figure below shows Premier League team’s total points and spending on salaries. 
Picture
All the teams above the line can be considered ‘efficient’. Wolves rank first for points per £m spent on player’s salaries. So far this season, Wolves have accumulated 40 points in the Premier League having spent £39 million on player’s salaries. This represents 1.02 points per million pounds spent on player’s salaries. Other ‘efficient’ teams include Manchester City, Liverpool, Tottenham, Watford and Brighton.

Manchester United are the most inefficient team in terms of points per £ spent on player’s salaries. The team has only won 0.37 points per million pounds spent on player’s salaries. This may be surprising given their recent form under Ole Gunnar Solskjaer but also may go a long way in explaining why they replaced former manager Jose Mourinho.
​
The other ‘inefficient’ teams include relegation candidates Huddersfield and Fulham along with Southampton, Crystal Palace, Everton, Leicester and West Ham. Over half of these teams have changed manager throughout the season which suggests that the team’s inefficiencies were no secret. Meanwhile, none of the managers of the ten ‘efficient’ teams have lost their jobs. 

    Archives

    February 2023
    January 2023
    December 2022
    November 2022
    October 2022
    September 2022
    August 2022
    July 2022
    June 2022
    May 2022
    April 2022
    March 2022
    February 2022
    January 2022
    December 2021
    November 2021
    October 2021
    September 2021
    August 2021
    July 2021
    June 2021
    May 2021
    April 2021
    March 2021
    February 2021
    January 2021
    December 2020
    November 2020
    October 2020
    September 2020
    August 2020
    July 2020
    June 2020
    May 2020
    April 2020
    March 2020
    February 2020
    January 2020
    December 2019
    November 2019
    October 2019
    September 2019
    August 2019
    June 2019
    May 2019
    April 2019
    March 2019
    February 2019
    January 2019
    December 2018
    November 2018
    October 2018
    September 2018
    August 2018
    July 2018
    June 2018
    May 2018
    April 2018
    March 2018
    February 2018
    January 2018
    December 2017
    November 2017
    October 2017
    September 2017
    August 2017
    July 2017
    June 2017
    May 2017
    April 2017
    March 2017
    February 2017
    January 2017
    December 2016
    November 2016
    October 2016
    September 2016
    August 2016
    July 2016
    June 2016
    May 2016
    April 2016
    March 2016
    February 2016
    January 2016
    December 2015
    November 2015
    October 2015
    September 2015
    August 2015
    July 2015
    June 2015
    May 2015
    April 2015
    March 2015
    February 2015
    January 2015
    December 2014
    November 2014
    October 2014
    September 2014
    August 2014
    July 2014
    June 2014
    May 2014
    April 2014
    March 2014
    February 2014
    January 2014
    December 2013
    November 2013
    October 2013
    September 2013
    August 2013
    July 2013

    About

    This website was founded in July 2013.

    RSS Feed

    Categories

    All
    American Football
    Athletics
    Baseball
    Basketball
    Behavioural Economics
    Boxing
    Broadcasting
    Competitive Balance
    Cricket
    Cycling
    Darts
    David Butler
    Declan Jordan
    Drugs
    Ed Valentine
    Epl
    Esports
    Expenditure
    F1
    Fifa World Cup
    Finances
    Funding
    Gaa
    Gaelic Games
    Gambling
    Game Theory
    Gary Burns
    Geography
    Golf
    Greyhound Racing
    Guest Posts
    Horse Racing
    Impact Studies
    John Considine
    John Eakins
    League Of Ireland
    Location
    Media
    Mls
    Mma
    Olympics
    Participation
    Paul O'Sullivan
    Premier League
    Regulation
    Research
    Robbie Butler
    Rugby
    Simpsonomics
    Snooker
    Soccer
    Spatial Analysis
    Sporting Bodies
    Stephen Brosnan
    Swimming
    Taxation
    Teaching
    Technology
    Tennis
    Transfers
    Uefa
    Ufc
    World Cup
    Wwe

Related

The website is not formally affiliated to any institution and all of the entries represent the personal views and opinions of an individual contributor. The website operates on a not-for-profit basis. For this reason we decline all advertisement opportunities. 

Contact

To contact us email sportseconomics2013@gmail.com or find us on Twitter @SportEcon.