The Economics of Sport
  • Sports Economics
  • About
  • Workshop
  • Selected Publications
  • Book Reviews
  • A Primer on Gaelic Games
  • Upcoming Events
  • Media
  • Education
  • Resources & Links
  • Data

Increasing Concentration in National Hunt Prize Money

31/1/2015

 
By John Considine
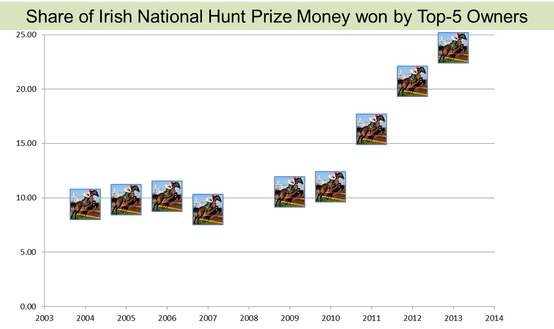
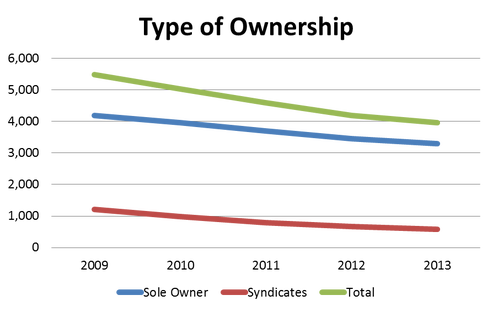
Last week, Robbie Butler posted on how the recession has hit Irish racehorse trainers hard (here).  He also showed how there is a declining number of owners in the sport.  Last Sunday, Denis Walsh examined the issue in a Sunday Times piece.  In the middle of Walsh's piece was an interesting graphic on the number of races and prize money won by the top five owners in national hunt racing.  The graphic compared the 2003-4 season and the 2013-14 season.  It showed how the prize money of the Top-5 went from €2.4m to €6.7m.  The combination of pieces by Walsh and Butler encouraged me to look at the data.  The picture below supports Walsh's graphic about the increasing share going to the Top-5 owners.  The picture also supports Butler's contention that it coincided with the recession (the data for 2008 is missing).
Picture
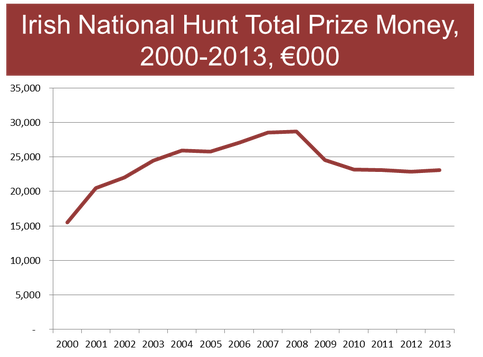
The increase in the prize money captured by the leading owners came at a time when overall prize money was declining.  Overall National Hunt prize money for the period since 2000 is presented in the picture below.  The peak comes in 2008 when the figure was just under €29m.

The decline in overall funding, and the greater share taken by larger owners, have made it harder on smaller owners to survive (as Butler points out).  As a result, the patronage of the larger owners is crucial for the survival of trainers (as Walsh points out).

Maybe the sport is again becoming the 'sport of kings'.  The Gigginstown House Stud was the leading prize money winner in 2013.  Ryanair's Michael O'Leary as the High King of Ireland?
Picture

Home Vs Away: Does It Matter?

30/1/2015

 
By Seán O'Connor

In just over two months’ time, the Republic of Ireland face Poland in what journalists, pundits, players, managers, and fans will no doubt state as a must win game.  Anyone who has followed the fortunes of the “Boys in Green”, particularly over the last decade or so would be aware when it comes to beating a team ranked higher than us at home, our results haven’t been too impressive. Bar beating Slovakia under Steve Staunton in 2007 at Croke Park, the last competitive victory against a higher ranked nation was the 1-0 defeat of the Dutch in 2001. Given this history, it is within reason to understand why some may be pessimistic in regards to Ireland defeating a very impressive Polish team.   

However, does strong home form matter when it comes to qualifying for major tournaments? Do teams who fail to collect the majority of their points from home games, still qualify? With this in mind, data has been collected for qualifying campaigns, in Europe ranging from World Cup 2010 to World Cup 2014. Given the expansion of the 2016 European Championships to 24 teams, data will only be examined for teams who finished first, second or third in the last three qualifying campaigns (two World Cups and one European Championship). Before the analysis begins it should be kept in mind prior to the expansion of the European Championships, only teams who finished in the top 2 would either, qualify, or have a chance of qualifying via play-off. This was the same for the World Cup also. So in theory when it came to a team looking to finish third in their group there was little incentive, bar a positive effect on seeding for the next qualifying tournament. Table 1, 2, 3 examine the points accumulation for the teams who finished first, second, and third in the last three qualifying campaigns.

Picture
Picture
Picture
Examining the teams who topped their respective groups, no team did worse than collecting 67% of points from the maximum e.g. 10/15 for a team playing 5 home games or 8/12 for a team playing 4. Out of the 27 teams who finished first during the three qualifying campaigns, only 9 went the entire process with a 100% home win rate. These were Spain, England, Netherlands (WC 2010), Germany, Netherlands, Denmark, Spain (Euro 2012), Holland, and Russia (WC 2014).

A number of teams who finished second and third during these three campaigns had extremely impressive home records, yet still finished behind teams who didn’t perform as well as home. For instance, qualifying for WC 2010 (Portugal, Greece, Slovenia, and France), Euro 2012 (Republic of Ireland, Bosnia, Croatia, and Montenegro) and WC 2014 (Greece, and France) either matched or bettered first place teams home record, yet still finished behind them. This phenomenon was the same for certain teams finishing second and third. Moreover, there are cases of certain teams finishing third even though they matched or bettered the first placed teams points accumulation (see Slovakia and Czech Republic, 2010; Russia and Armenia, 2012; England and Switzerland, 2012).

Collecting as many points as possible from home can aid in qualification, however, there are quite a number of exceptions to the rule. When it comes to the argument of a strong home record to ensure qualification, or at least reaching a play-off, there is no greater exception to the rule then the Republic of Ireland. Although going unbeaten for the entire campaign under Giovanni Trapattoni, only 39% of Ireland’s total points came from home games. Out of all teams who finished in the top three during the 2010 World Cup qualification campaign, Ireland’s home record was the poorest in regard to collecting the maximum number of home points available.

Similarly for the European Championship campaign it was Ireland’s away record which helped them secure second. Only 48% of their total points came from matches at the Aviva Stadium. Honourable mentions should be made to the likes of Russia, England (both group winners) and Estonia and Czech Republic (runners up) who performed much better on the road then at home, even better then Ireland. Even for the last World Cup qualifying campaign there are numerous examples of teams preforming much better away from home. So although home form can matter, a strong away record can be just as good. Can Ireland do it again? A nation holds its breath.

The FA, Non-EU Footballers & Work Permits

29/1/2015

 
By David Butler

On Tuesday the Guardian reported that an FA proposal, led by Greg Dyke, to stop allowing English clubs undertake an appeals process for non-EU players not granted a work permit looks set to fail. The proposal faces strong opposition from the Premier League. The Guardian is quoted as saying that “The FA chairman’s belief is that the changes would allow more English-born players into top-flight clubs.”  Three entries on this topic can be read here, here and here, where I collected data on 2,751 footballers from the start of this season (that is accurate up to the opening of the current transfer window). 

It will be good news if this proposal does not go ahead. I outlined reasons for not regulating against non-EU footballers in the previous entries above and will outline the central points here again:

 1
. Non-EU footballers are not biggest problem in preventing young english talent reaching EPL football... EU players are! As of the start of the 2014-2015 season, the EPL has the lowest amount of Non-EU footballers (22.5%) when compared to the other big European leagues – Serie A (34%), Lique 1 (34.66%), Bundesliga (27.2%) and La Liga (26.5%).

2
. The EPL has the highest percentage of players born in the EU (77.5%) when compared to the other Big 4 leagues, but has the lowest amount of national born players. The EPL has over double the number of footballers (231) from the EU but not from the country of the domestic league when compared to the other big four of Serie A (107), Bundesliga (102), La Liga (57) and Lique 1 (55).

3.
The non-elite EPL clubs have 12% more national born players than the elite (those whom qualified for a European competition for the current 2014/2015 season). The elite have just over 5% more non-EU players than the non-elite clubs. Further evidence perhaps that the elite in England are seeking out the best players from inside the EU.

4
.In terms of not having national talent on the books, Chelsea are bottom of the list of the 98 clubs in the sample, followed by Arsenal in second last position. EPL clubs make up 4 of the bottom 5, with Swansea and Manchester City being 4th and 5th last respectively.

Sports Sponsorship Ban Deferred

29/1/2015

 
By David Butler

Two weeks ago I raised several questions about a clause in the Public Health (Alcohol) Bill that sought to prohibit the alcohol industry from sponsoring sport  in Ireland. Last Friday it was announced that this clause has been dropped from the new Bill. A backlash from major sporting associations and a failure to secure replacement funding was cited as the cause for removing the clause. Other pricing and information measures in the Bill are set to be maintained. The Irish Independent reported that the ban has been deferred and a study group will report on the issue in a years’ time. This delay will hopefully provide time for more research to be undertaken and may also provide a window of opportunity to seek alternative funding – an unenviable challenge to say the least. 

10,000 Hours: Football In The School Yard

28/1/2015


By Robbie Butler

Outliers: The Story of Success is a 2008 book written by Malcom Gladwell. Among other things, the book repeatedly mentions the “10,000 Hour Rule”. This rule suggests that there is no such thing as innate talent but instead claims that the key to success in any field is, to a large extent, a matter of practicing a specific task for a total of 10,000 hours.

Recently, I have started playing six-a-side football with a group of lads I know. Five of the group happen to be primary school teachers. We started chatting about football in school and I discovered that in all four schools (two of them work together) football is ‘banned’ at break time!

I started to reflect on my experiences in St Paul's Boys National School in Lisduggan, Waterford. In the early 1990s school was as much about football to me, as it was education. From 1st class onward we played football when and where possible. Large footballs were forbidden so a tennis ball was used. It was almost impossible to control but made it much easier when one moved to the larger football.  

School started at 9.15am but our matches regularly kicked-off before 8.45am. “Small break” involved a rapid 15 minute game from 10.55am to 11.10am. 

“Big Break” was the main event. Lunch was quickly devoured so that games started around 12.35pm and finished at 1.15pm. All in all, we played roughly 90 minutes of schoolyard football per day with a tennis ball. That’s five full matches per week, not to mention the hours spent playing on the road after school, or with clubs and friends at weekends.

By the end of primary school, I estimate we had played more than 1,600 hours of football in school. That’s more than 16% of the way to Gladwell's magic 10,000 Hour Rule.  

This 16+% cannot be accumulated today. Many of the great Irish players of the past surely benefited from this “extra” practice time. No doubt, Niall Quinn, Ronnie Whelan and Robbie Keane were all beneficiaries of playground football. Today’s generation do not get this opportunity. The Cork children that attend the schools of my team mates don’t have the opportunity a young Roy Keane once had in the very same schools. Insurance, health and safety, etc. are all cited for this decision.

In the early 1990s getting hurt was part of school life. Cuts, bruises, scars. They were all worth it so that you had the lunchtime bragging rights. It might be some time before we see the next Roy Keane emerge; kids simply don’t get the opportunity they used to.

Competitive Balance and the European Rugby Champions Cup

26/1/2015

 
Picture
By John Eakins

The group stages of the European Rugby Champions Cup were recently completed and the identity of the eight quarter finalists revealed. As many of you are aware the format of this year's competition changed from previous years with only five pools of four teams instead of six. The eight quarter finalists were still based on pool winners and best runners up however so it is interesting to make a comparison between this year's top 8 qualifiers and qualifiers from previous years. The table below lists the top 8 teams from this year and the previous five years of the competition.


Picture
What is apparent from the table is the difference in points attained by the pool winners and best runners up in this year’s competition compared to their counterparts in previous years. The pool winners in this year’s competition finished with an average of 21.4 points while in previous years the average (across the 5 years of data collected) was 22.7. The difference in points for the best runners up is greater with this year’s three best runners up finishing with an average points tally of 18 compared to 20.7 in the past 5 years of the competition.

It is clear that having a more condensed version of the competition with better quality teams has made each pool more competitive and reduced the chances of having runaway pool winners. For example in the 2010/11, 2011/12, 2012/13, 2013/14 competitions there was at least one pool winner who went through to the quarter finals undefeated. This year, all pool winners lost at least one match. But is this such a good thing? The one feature that made the old format so attractive was the fact that losing even one match had a very strong negative effect on your chances of qualification. So every match in the pool stages turned into a cup match. In the new format the ‘punishment’ in losing a match isn’t so great. Munster for example could still have qualified as one of the best runners up even though they lost three games, if they had taken a try bonus against Sale and a losing bonus against Saracens (there is an element of wishful thinking here as well being a Munster supporter).  

What also comes out of this is that it may have become harder to knock out one of the bigger teams from the competition. Almost all teams who lost two matches or less still qualified for the quarter final stages, with the exception of Harlequins and Toulouse and that was only on points differential. Thus the bigger teams will probably need to be beaten three times for them to be knocked out at the pool stages. It looks to me that we are going to see roughly the same teams in the quarter final stages over the coming years. To me the competition has become more competitively imbalanced as a result of the new format.

Shying Away From A Tackle?

24/1/2015

 
By Sean O'Connor

During the build up to last week’s F.A Cup clash between Wimbledon A.F.C. and Liverpool football fans were regaled with tales and images of the famous 1988 final. Wimbledon, the underdogs triumphed over the newly crowned league champions and what could be described as one of Europe’s strongest teams, thanks to a first half Lawrie Sanchez goal.

However, it was not the goal itself which possessed me to write this piece, but rather the tackle by Vinnie Jones on the Liverpoodlian, Steve McMahon (
video can be seen here). The tackle itself was not one of beauty or good timing, for that matter, with Jones completely missing the ball and almost cutting McMahon in two. What more caught my interest is the referee’s reaction. Rather than produce a yellow or red for Jones, the referee simply awarded a free.

No doubt in today’s game, the above challenge would have resulted in an immediate dismissal. Moreover, in the present day players can concede a foul and receive a booking for challenges where they clearly win the ball but either weren’t in control of their movement or connected with the player after the winning the ball. With this in mind I want to examine not only the trend in fouls in the Premier League but also that of yellow and red cards. Data has been collected for fouls committed, as well as yellow and red cards. This has been broken down into home and away teams, and ranges from the 2000/2001 to 2014/2015 season (up to game week 21).

Figure 1 examines the fouls committed by home and away teams during the period under consideration.


Picture
As the graph shows, on average the number of fouls per game committed by both home and away teams has decreased from 13.95 and 12.98 in 2000/2001 to 11.46 and 11.37 so far in the 2014/2015 season. It is difficult to pinpoint what is the exact reason behind this decrease in fouls committed. Three theories could be put forward. The first: Are players becoming more proficient at tackling, thus not giving away as many frees? The second: Are referees becoming more lenient and not blowing their whistle for a free as often? The third: Is tackling declining in general, as players fear being penalised for making a challenge?

If less fouling is now occurring in the league, surely there should be less bookings also? Figure 2 and 3 examines yellow and red cards per game, respectively.

Picture
Picture
From examining Figure 2 it is evident that there has been an upward trend in yellow cards awarded per game. During the 2000/2001 season a home team and away team received 1.35 and 1.8 yellow cards per game, respectively. So far this season, this figure stands at 1.7 and 2.04. In regards to red cards, there has been a slight downward trend for away teams, with no significant change for home ones.

It is difficult to pinpoint the exact reasoning behind the downward trend in fouls and the upward trend in bookings (yellow cards) but giving an educated guess, the fear by players of receiving a caution for making a challenge even that of a clean one may have something to do with it.

Six Less Fashionable PL Clubs Make DFML Top-30

23/1/2015

 
By John Considine
Picture
The financial revenues washing through the English game is illustrated by the fact that Sunderland, Swansea City, Stoke, Southampton, Aston Villa, and West Ham are listed between numbers 21 and 30 in the Deloitte Football Money League 2015.  Although these clubs might be less fashionable than those who consider themselves top-4, some of these clubs are the more established clubs in English football.

Seven Premier League clubs make the top twenty: Manchester United (2); Manchester City (6); Chelsea (7); Arsenal (8); Liverpool (9); Tottenham Hotspur (13); Newcastle United (19), and Everton (20).  The latter two being classified as "new" entrants to the Top-20.

The prospects for Sunderland, and others, remaining amongst the highest revenue generators in Europe are good if they remain in the Premier League.  In the middle of December 2014, the Premier League issued a notice of invitation to tender for audio visual rights.  The rights included seven packages to 168 matches played over the three seasons starting 2016/17.  It is widely believed that competition between SKY and BT will have resulted in Richard Scudamore receiving applications with sizable financial bids.  Of course, there is always the possibility that some of these clubs might lose their Premier League status between now and the end of the next TV deal.  In the very short term, the possibility of a relegation battle might encourage some of them to splash-the-cash.  The most likely spenders are probably Swansea City who are sitting on some money from the sale of Bony to Manchester City.

Economic Reality Hits Irish Trainers

22/1/2015

 
By Robbie Butler

I was saddened recently when I heard the news that former Irish Champion jockey Charlie Swan has decided to retire from training at the end of the month. Swan (48) took out his training licence in 1998 and enjoyed notable success with Offshore Account and One Cool Cookie. I will always fondly remember him as the partner of the mighty Istabraq, the greatest hurdler I ever saw.

This week Charlie was joined by Joanna Morgan. The first female jockey to ride professionally at Royal Ascot, Morgan called it a day this week having taken out her training licence in 1997.

Both Swan and Morgan cite rising costs as the reason for opting to leave the sport they love. Writing in the Irish Independent on Monday, Richard Forristal was quite critical of the horse racing industry. His piece "HRI Spin Conceals Real Truth Of Stats" suggests all is not well within racing circles, despite central authority’s insistence that the sport of kings is on the rise again.

Anyone that follows racing will know that the 2008-2009 financial crash has hit the industry hard. The sport in many ways had come to symbolise Celtic Tiger Ireland. Syndicates, the Galway Races, trips to Cheltenham and beyond. Getting horses entered in races, particularly lower graded ones was an achievement during the mid-2000. The data below illustrates just why Charlie and Joanna have left the game.
Picture
Source: Horse Racing Ireland Factbook 2013
The trend is worrying and there is nothing to suggest it will be arrested in the coming years. Furthermore it appears that both flat and national hunt racing are becoming less competitive at the upper end. Just 3 horses entered the Grade 1 Novice Chase last weekend at Leopardstown. A maximum of five will probably line out for the Irish Champion Hurdle this weekend.

This is just one tiny snapshot of the past five years. The Horse Racing Ireland Fact Book provides a wealth of statistics and data for the interested reader and is available free from their website. 

Bicycle Component Exports from Ireland

21/1/2015

 
By John Considine
The Irish Exporters Association (IEA) publish a list of the Top 250 exporters from Ireland.  I scanned the "Line of Business" column for sport related exports in the 2014 publication.  The most obvious company listed was Sandleford Limited.  The company was identified as number 85 in terms of value of exports.  It exported €294.25m in 2014.  The company's line of business is listed as bicycle components.  It is based in Waterford and according to the IEA it employs 1,537 people.  This is an impressive €191,444 in exports per employee.  For comparison purposes, the table below provides some other companies and the exports per employee.
Picture
While the exports per Sandleford employee is impressive, a comparison with Benex Limited and some other companies shows it is not the best performer in that regard.  Benex Ltd. exports a massive €383m per employee (its line of business is listed as X-ray apparatus and related irradiation equipment).

Glanbia PLC is 17th in terms of the value of exporter.  It is included in the above table as it has featured previously on this blog in relation to its sports nutrition drinks (here) and its sponsorship of inter-county teams (here, here).
<<Previous

    Archives

    March 2023
    February 2023
    January 2023
    December 2022
    November 2022
    October 2022
    September 2022
    August 2022
    July 2022
    June 2022
    May 2022
    April 2022
    March 2022
    February 2022
    January 2022
    December 2021
    November 2021
    October 2021
    September 2021
    August 2021
    July 2021
    June 2021
    May 2021
    April 2021
    March 2021
    February 2021
    January 2021
    December 2020
    November 2020
    October 2020
    September 2020
    August 2020
    July 2020
    June 2020
    May 2020
    April 2020
    March 2020
    February 2020
    January 2020
    December 2019
    November 2019
    October 2019
    September 2019
    August 2019
    June 2019
    May 2019
    April 2019
    March 2019
    February 2019
    January 2019
    December 2018
    November 2018
    October 2018
    September 2018
    August 2018
    July 2018
    June 2018
    May 2018
    April 2018
    March 2018
    February 2018
    January 2018
    December 2017
    November 2017
    October 2017
    September 2017
    August 2017
    July 2017
    June 2017
    May 2017
    April 2017
    March 2017
    February 2017
    January 2017
    December 2016
    November 2016
    October 2016
    September 2016
    August 2016
    July 2016
    June 2016
    May 2016
    April 2016
    March 2016
    February 2016
    January 2016
    December 2015
    November 2015
    October 2015
    September 2015
    August 2015
    July 2015
    June 2015
    May 2015
    April 2015
    March 2015
    February 2015
    January 2015
    December 2014
    November 2014
    October 2014
    September 2014
    August 2014
    July 2014
    June 2014
    May 2014
    April 2014
    March 2014
    February 2014
    January 2014
    December 2013
    November 2013
    October 2013
    September 2013
    August 2013
    July 2013

    About

    This website was founded in July 2013.

    RSS Feed

    Categories

    All
    American Football
    Athletics
    Baseball
    Basketball
    Behavioural Economics
    Boxing
    Broadcasting
    Competitive Balance
    Cricket
    Cycling
    Darts
    David Butler
    Declan Jordan
    Drugs
    Ed Valentine
    Epl
    Esports
    Expenditure
    F1
    Fifa World Cup
    Finances
    Funding
    Gaa
    Gaelic Games
    Gambling
    Game Theory
    Gary Burns
    Geography
    Golf
    Greyhound Racing
    Guest Posts
    Horse Racing
    Impact Studies
    John Considine
    John Eakins
    League Of Ireland
    Location
    Media
    Mls
    Mma
    Olympics
    Participation
    Paul O'Sullivan
    Premier League
    Regulation
    Research
    Robbie Butler
    Rugby
    Simpsonomics
    Snooker
    Soccer
    Spatial Analysis
    Sporting Bodies
    Stephen Brosnan
    Swimming
    Taxation
    Teaching
    Technology
    Tennis
    Transfers
    Uefa
    Ufc
    World Cup
    Wwe

Related

The website is not formally affiliated to any institution and all of the entries represent the personal views and opinions of an individual contributor. The website operates on a not-for-profit basis. For this reason we decline all advertisement opportunities. 

Contact

To contact us email sportseconomics2013@gmail.com or find us on Twitter @SportEcon.