The Economics of Sport
  • Sports Economics
  • About
  • Workshop
  • Selected Publications
  • Book Reviews
  • A Primer on Gaelic Games
  • Upcoming Events
  • Media
  • Education
  • Resources & Links
  • Data

Dundalk's Prize money - A Comparison of Domestic and European Success

30/9/2016

0 Comments

 
By Robbie Butler

Dundalk FC achieved yet another remarkable result for Irish soccer on Thursday night. The County Louth club recorded the first ever victory for a League of Ireland club in the Europa League, beating  Maccabi Tel Aviv 1 – 0 in Group D of the competition.
​
The result is fantastic from a football perspective, and gives the club a realistic chance of qualifying for the knock-out stages in February 2017. The economic windfall is also enormous for a club playing domestic football in Ireland.
Picture
​To put this into perspective we can consider the prize funds on offer in both the League of Ireland and Europa League.

​In March 2016, League of Ireland sponsors SSE Airtircity announced a total prize fund, for both the Premier Division and First Division, of €475,500 for the current campaign. This was a 50% increase on the previous season. The breakdown of prize money is presented to the right.

Including the Irish Daily Mail FAI Cup, the EA SPORTS Cup and the Fair Play competition, the total prize fund available to League of Ireland clubs during 2016 is €596,500.

Dundalk’s European adventure to date has yielded the following financial return  from prize money alone (table below). 

Picture
The win last night earned the club €360,00. This is almost the same as the entire prize fund for the 2016 Premier Division.

With both Dundalk and Cork City likely to finish first and second in the League or Ireland this season, it will be very interesting to compare the €110,000 or €55,000 prize they receive with that of their European success.
​
Should the financial return from European competition continue to rise, it will have interesting consequences for competition and competitive balance in the League of Ireland next season and the years ahead.
0 Comments

Olympics and Paralympics Medals – Differences in Country Performance

28/9/2016

 
By Stephen Brosnan

Previously on this site, Robbie Butler discussed some potential socioeconomic determinants of success in winning Olympic medals (here) and how the UK’s investment in athletic programs has contributed to increases in medal counts (here). In this post, I examine the differences between countries performances at Olympic and Paralympic games to identify differences in attention and resources devoted to individuals with disabilities relative to others.
​
Comparing Olympic and Paralympic performances is not so straight forward given that there are many more medals distributed in the Paralympics compared to the Olympics. Since it is more difficult to guarantee a level playing field among individuals with disabilities, a more complex classification of sport events is often required. As such, in Rio 2016, 974 Olympic medals were awarded while 1,597 medals were distributed in the Paralympics. Thus, when comparing the performances of countries it makes sense to consider the share of total medals the country won rather than absolute values.

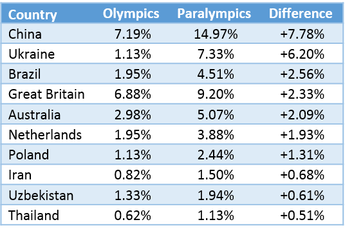
The Table below reports the top 10 countries measured by the percentage of medals obtained by countries in the Paralympics relative to the Olympics. 
​​Seven countries are represented in both the top 10 for shares of Olympic medals and Paralympic medals. These countries include USA, China, Great Britain, Australia, Brazil, Italy and Germany. Table 1 shows Ukraine is the country with second largest difference between shares of total medals in the Olympic and Paralympics. While Ukraine finished 29th overall in share of total medals in the Olympics, the country finished 3rd overall in shares of Paralympic medals. The performance of the Ukraine is surprising given its modest population and income per capita relative to its competitors and ongoing war and political turmoil in the country. 
Picture
Table 1. Difference between Countries share of Paralympics medals and Olympic
​Much of the country’s success at the Paralympics has been attributed to its investment in a programme called ‘Invasport’, under which each region in Ukraine has at least one school dedicated to sports programs for the disabled. This increase in investment has led to considerable results, similar to Team GB’s investment in their Olympic programmes which brought greater success in Rio.

China is the highest ranked country for Paralympic medal wins representing 14.97% of total medals won. This is a 7.78% difference to their share of Olympic medals (7.19%). This could be considered an indication of the country’s progress in increasing standards in social civilization. However, research carried out by Brittain (2006) suggests that rather than being a measure of national social and economic development, success at the Paralympic games is used for political propaganda which the author calls ‘athletes as a means to a political end’. 
​
Research focused on differences between Olympics and Paralympic games is currently underdeveloped particularly when comparing the different determinants of success across the two platforms. As such, researchers are provided with many potential opportunities to fill these knowledge gaps in the future. 

West Ham United & The Olympic Stadium

26/9/2016

 
By David Butler

Last May, I had an entry that considered performance pre and post a stadium move in English football in light of West Ham’s decision to play home matches at the Olympic Stadium.  The transition has not gone well so far. Since the move West Ham have collected three points from nine and currently sit in the relegation zone after showing some poor away form too.

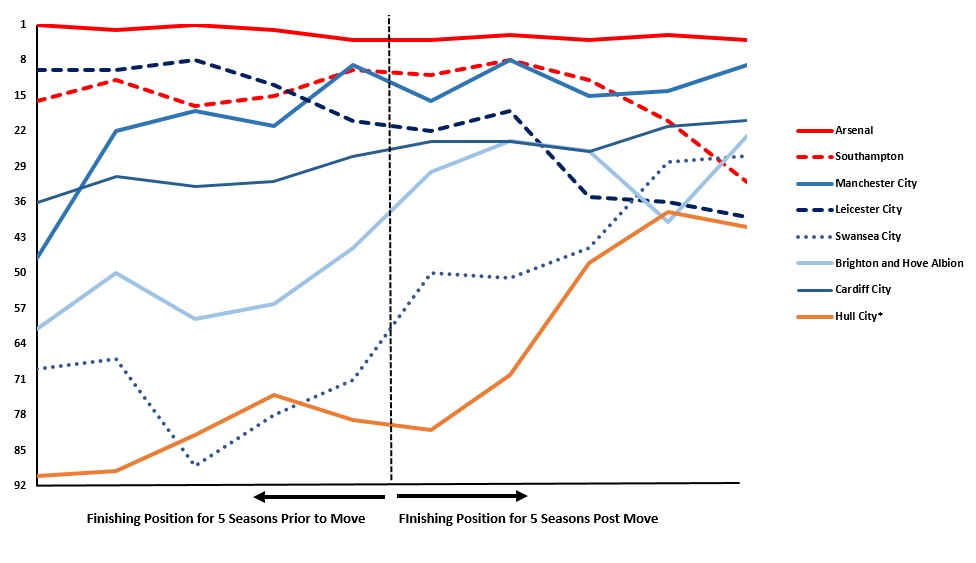
The chart (reproduced below) shows the finishing position in the English football league for eight clubs that have moved stadium since 2000. The graph plots the finishing position of each club five seasons prior to their move and five seasons after their move. Just considering top-tier clubs, the performance of Southampton and Manchester City declined after moving to a new stadium. Southampton were relegated in the five-year period after moving from The Dell.  If my memory serves me right the cost of the Walker Stadium, along with the collapse of the ITV digital deal put Leicester city under enormous financial stress when they were moving from Filbert street.

West Ham is an interesting case as one would assume significant investment in new construction projects were not required to ensure the move. Their rental contract for the Olympic stadium is probably the only significant new cost. Again, something which one would expect not to influence transfer spend too much. But is there a 'settling in' effect as a team and its supporters acclimatise to their new environs, pitches size, etc.?

Moving to new stadiums for Premier League clubs seems to bring teething problems rather than honeymoons. It took Arsenal three games to win at the Emirates in 2006 (Arsenal 3–0 Sheffield United).  Man City’s debut season in the City of Manchester stadium saw them finished 16th and they only won five home games all season in their new ground. Like Arsenal, their first home victory came at the third home game (Manchester City 4 – 1 Aston Villa).  When Southampton moved to St.Mary’s for the 2001-2002 season they didn’t get a premier league win in their new stadium until the 24th of November. On their sixth attempt at their new ground they beat Charlton 1-0.
Picture

Relative Age Effects and Player Position

23/9/2016

0 Comments

 
by Declan Jordan
​One of the explanations for the persistence in relative age effects in sport is the physiological benefits that players born closer to the age cut-off for under-age competition (usually earlier in a calendar year) have over players born later in the period. At a young age this can mean up to almost a year in the development of players in the same age category. This physiological advantage may be compounded by the advantages of getting more game time and subsequently more coaching. This could mean some young players dropping out of the game, leading to a persistent age effect.

In football this physiological difference may be more beneficial in different positions. For example, goalkeepers tend to be taller than outfield players, and defenders also tend to be taller and bigger than midfielders and attackers (we can of course think of many midfielders and attackers that are tall and big).

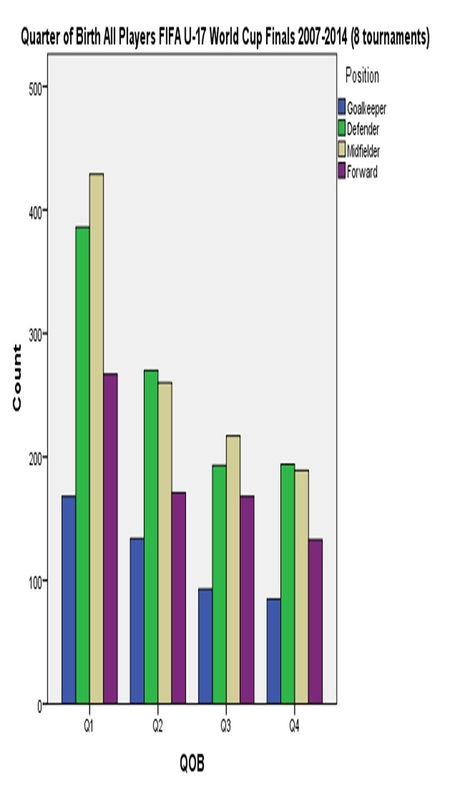
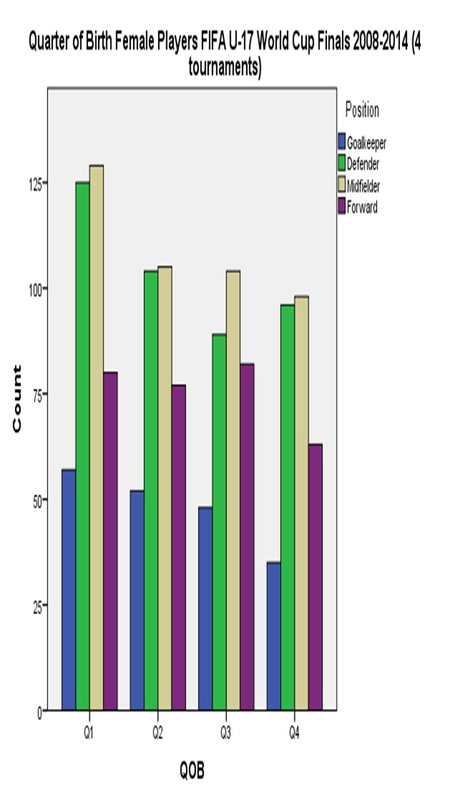
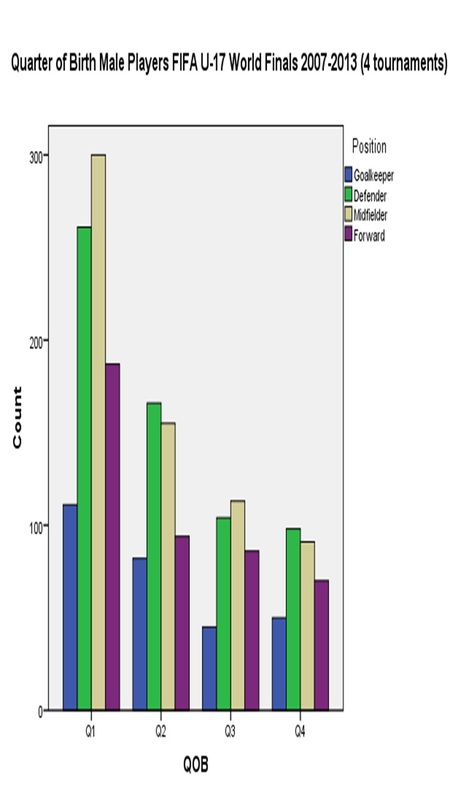
The graphs below show the breakdown of quarter of birth for elite under-17 footballers - i.e. those representing their countries at FIFA U-17 World Cup Finals between 2007 and 2014. There are four tournaments each for male and female players over the period. The data comes from FIFA and player position is designated on the website for each tournament.

The figures show, from the flatter distribution of the female players, that relative age effects are far more pronounced for males than for females.   
Picture
Picture
Picture
However, within each cohort there is no difference in the relative age effect across different positions. This means that the proportion of players in each cohort born in each quarter of the calendar year is similar to proportions in each field position. This suggests that physiological differences at early stages of development may affect the likelihood of selection (and subsequent coaching attention) in every position. Unlike rugby, it seems there isn't a position for all body shapes in football. Perhaps an interesting question would be to look at relative age effects by position in a sport like rugby, where physical size matters for different positions.
0 Comments

Romans Abandon Their Bid

22/9/2016

 
By Robbie Butler

Rome yesterday joined Boston and Hamburg becoming the 3rd city to abandon plans to host the 2024 Summer Olympic Games. Mayor Virginia Raggi’s election in June was based on a number of issues including a commitment to end plans to bid for the Games.

The proposed €5.3 billion budget will now be used for 'other' projects.  

Raggi cited the fact that Rome is still supposedly paying for the Olympics it hosted in 1960! Three cities still remain in the race Budapest, Los Angeles and Paris. So long as there is more than one the power rests with the International Olympic Committee (IOC). 

I wonder will other cities and countries follow Rome's move...

Andrew Zimbalist Circus Maximus: The Economic Gamble Behind Hosting the Olympics and the World Cup provides an excellent analysis of the economic costs and benefits of this and similar mega-sporting events. 

The History of Replica Kits

19/9/2016

 
By John Considine
Picture
There has been a number of posts on this site dealing with the issue of football shirts and replica kits.  At the start of each season, David Butler has written about the cost of getting a footballer's name printed on the back of a football shirt. There are four instalments of "shirtonomics". Robbie Butler has posted on changes in the Irish national shirt and on the origins of shirt sponsorship in English football. I have written about the UK Office of Fair Trading investigation into price-fixing in the replica kits.  It is a subject that is of particular interest to those who contribute to this website.

In this context, I would like to recommend an article from Sport in History.  The article is from a special edition of the journal devoted to sports kit (here).  The title of the article is "From Sportswear to Leisurewear: The Evolution of English Football League Shirt Design in the Replica Kit Era".  It is difficult to do justice to the article in a short blog post because of the level of detail covered in approximately 40 pages.  In addition to the text there are some excellent pictures and stories. The pictures include graphs of data and adverts used during the different eras.  For example, Figure 5a present a line graph of the percentage of replica shirts/kit that include (i) sponsor's logo, (ii) club badge, and (iii) maker's logo. There is a superb contrast between the steady increase in shirts carrying the club badge compared to the zero to 100% spike in both logos that occurred during the 1970s.  A key to understanding the spikes is a knowledge of the way that the 1968 UK Copyright Act allowed a groundbreaking deal between Admiral and Leeds United.  The article explains the chronology.

Much of the article traces the evolution through three phases.  The first phase was the child-replica football kit.  A key step in this phase was Umbro's 1959 decision to market child-sized kits to individual customers.  Prior to 1959, kits were primarily sold to clubs as sportswear.  The second phase was the official replica era.  One could argue that this era ran from the 1970s to the present (aided by the addition of club and manufacture logos to shirts of all sizes).  The third phase is the retro-replica.  This phase overlaps with the second phase and is built on the nostalgia amongst many football fans.

One particular part of the article illustrates brilliantly the way things have changed.  In 1968/69 the catalogue for Umbro featured the Manchester United and Scotland player Denis Law endorsing the kits of "Manchester United and Scotland, ... eight other leading English clubs, three Scottish clubs and the international kit of England".  Would a current Manchester United player be allowed to make such an endorsement?  How marketable would a shirt be without the club badge, sponsor's & manufacturer logo, and the name of  footballer playing Champions League?

Live Friday Night Football - A New Worry for the League of Ireland?

17/9/2016

 
By Robbie Butler

The League of Ireland finds itself again in a strange place. On Thursday night, Dundalk FC arguably got the best result in the history of the league when they managed a 1-1 away to AZ Alkmaar in the Europa League. This resulted is framed against a League that has undergone constant change and crisis over the past number of decades.

Many of the problems in the League are due to the proximity of Britain to Ireland. For almost 100 years the best Irish talent has been exported to the Britain. Some of these players have acquired legend status at the biggest clubs. The flow of talent from Ireland increased rapidly towards the end of the twentieth century, and today, hundreds of Irish players earn a living in the various professional leagues in Britain.

Demand for the League of Ireland has been suitably reduced. The demand function for the product is no different to any other. The price, income, quality, preferences, the probability of a team’s success, etc. are all determinants of demand. If you export your best talent, demand will fall. 

The high point of interest in the League of Ireland is said to have occurred during the 1950 and early 1960s. Interest in the League has subsequently declined since. What caused this to happen? There are a number of reasons, but it’s no coincidence that at the same time the League started to see a drop in attendance figures, live football from England started to appear on Irish TV screens, with the FA Cup Final broadcast live on free-to-air television . European competitions also started to appear on our screens.

Live televised football increased in quantity during the 1970s and 1980s and in 1992 BskyB changed football as we know it. Sunday afternoon football was to become a permanent fixture. This gave the League of Ireland a big problem. Sunday afternoon had been the leagues traditional kick-off time.

Over the course of the next two decades, clubs in the league experimented with various different kick-off days and times. The majority of clubs migrated to Friday nights. This is probably driven by the actions of competitors. Until this season, the Premier League was screened from 12.45pm to 7.15pm on Saturday, from 2pm to 6pm on Sunday’s and Monday evenings. European competition was shown live on Tuesday, Wednesday and Thursday night. Friday is all that was left.

But now another, potentially bigger problem, has emerged. Sky Sports have changed this again. There is now nowhere for League of Ireland clubs to realistically go to avoid direct competition. I fear this could spell the end for some. While many football fans probably love the arrival of live Friday night Premier League football, keep in mind there is an opportunity cost. It may be the very survival of the League of Ireland First Division.

Broadcasting "The Sport Of Kings"

14/9/2016

 
By Robbie Butler

Horse racing fans in the UK and Ireland might have been surprised on Saturday afternoon, when for the first time in a very long time, Channel 4 did not have live racing on our screens. This despite the fact one of just five Classics (The St Ledger) went to post at Doncaster on Saturday afternoon.

The annual Group 1 instead appeared on sister channel More 4 and was replaced on Channel 4 by live covered of the Paralympics from Rio. This could simply be down to demand by viewers and a decision by the channel to screen the more popular event. Sponsors of the St Ledger, Ladbrokes were pragmatic. Spokesman for the company David Williams, said: "We've got to be realistic. Racing doesn't have a God-given right to have first dibs at the TV buffet of sports broadcasting...we understand the bigger picture".

This could be the first parting shot by Channel 4 to horse racing authorities, in response to the channel ceasing all racing coverage at the end of 2016. This responsibility will pass to ITV who successfully purchased the broadcasting rights from 2017, for an estimated £30 million.

Whether this moves turns out to be successful remains to be seen. The movement of Royal Ascot from its traditional BBC slot to Channel 4 a number of years ago saw a drop in viewing numbers. If racing coverage appears on ITV1 (as many expect) it's likely the sport could see a rebound. If however other channels become the sports home e.g. ITV4, the sport may not get the viewing figures it expects. 

Either way, the move is a statement of intent by racing authorities. Only time will tell if it is successful.

Sports Economics at UCC

13/9/2016

 
By Robbie Butler

Sports economics formally arrived at University College Cork yesterday evening when I delivered the first lecture in the subject to third year undergraduate students registered in the Bachelor of Commerce and Bachelor of Arts degrees.

I was joined by fellow blog contributor David Butler. David shared his recent experiences at the European Sports Economics Association conference, and made special reference to the session related to teaching sports economics. 

The module will run for the duration of the first semester at UCC. ​Further details on the content can be found here. 

Increased Competition in European World Cup Qualifiers

7/9/2016

 
By David Butler

No doubt Valon Berisha will become an iconic name in Kosovo after the Red Bull Salzburg midfielder scored in the Balkan territory's first World Cup qualifying match since becoming a FIFA member. At first I was thrilled to see the Kosovans do well but then I started to question whether their arrival will spell qualification trouble from teams like the Republic of Ireland in the years to come. While the Kosovans are currently minnows, naturally they will have motivations to progress. They haven’t had a bad start; Finland were drawn from Pot 5, not Pot 6, and on top of that, it was an away point they achieved in Turku. If my memory serves me right not long after Montengro came on the seen they achieved a draw with Ireland. 

As all European soccer fans know, qualifying for the World Cup in Russia is challenging. Apart from Russia, who qualify automatically as hosts, only thirteen slots in the final tournament are available for European teams. What’s more, the lowest place runner up doesn’t even get into a play-off. As Robbie Butler showed here, us Irish draw an awful lot of matches.

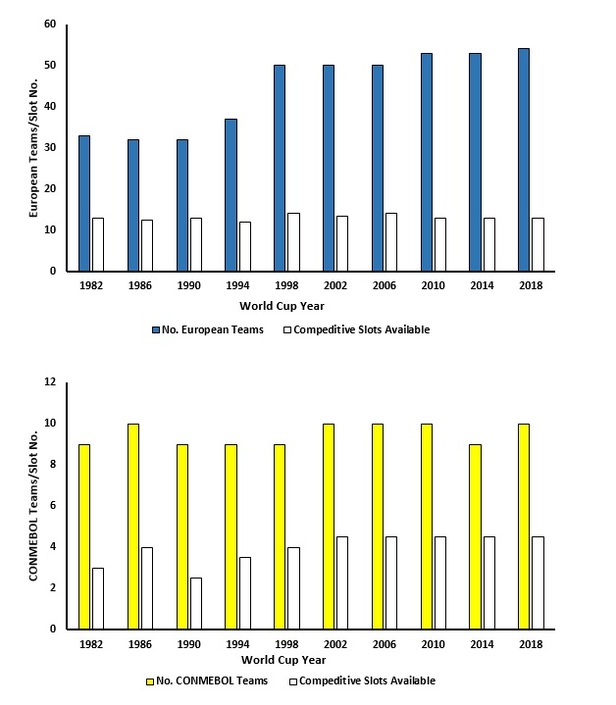
An issue for the European bloc, and perhaps for those that consider tournament design, is the expansion of the qualification stage. While this has happened on a piecemeal basis, the break-up of the USSR and Yugoslavia were particularly relevant. The graph below shows the number of European teams competing in the World Cup qualification round from 1982 to 2016 and the number of slots available (discounting automatic qualification). Approximately 40% of teams qualified from Europe from 1982 to 1990. This has fallen since then. Now under a quarter of the entrants reach the finals. The number of places on offer at the finals has remained relatively constant. 
 
​As a comparison, the second graph shows the same information for South America (CONMEBOL). The number of slots available here has increased over the years. Approximately one third of teams qualified in 1982. By the time Russia 2018 comes along 45% of CONMEBOL entrants will reach the finals.

Yesterday the new FIFA president Gianna Infantino floated the idea of a 40 team World Cup. While there is an obvious quality trade-off here as we all saw from the expanded Euro 2016 Finals, it may provide a greater opportunity for European teams to reach World Cup Finals.

While things don’t often happen instantly in international football, quick changes can come about from time to time. Wales rose from a bottom qualifying seed for the 2014 World Cup to a top seed for 2018. Iceland, and to a lesser extent Northern Ireland, have shown that success on the international stage is possible, even with relatively small populations. 
Picture
<<Previous

    Archives

    March 2023
    February 2023
    January 2023
    December 2022
    November 2022
    October 2022
    September 2022
    August 2022
    July 2022
    June 2022
    May 2022
    April 2022
    March 2022
    February 2022
    January 2022
    December 2021
    November 2021
    October 2021
    September 2021
    August 2021
    July 2021
    June 2021
    May 2021
    April 2021
    March 2021
    February 2021
    January 2021
    December 2020
    November 2020
    October 2020
    September 2020
    August 2020
    July 2020
    June 2020
    May 2020
    April 2020
    March 2020
    February 2020
    January 2020
    December 2019
    November 2019
    October 2019
    September 2019
    August 2019
    June 2019
    May 2019
    April 2019
    March 2019
    February 2019
    January 2019
    December 2018
    November 2018
    October 2018
    September 2018
    August 2018
    July 2018
    June 2018
    May 2018
    April 2018
    March 2018
    February 2018
    January 2018
    December 2017
    November 2017
    October 2017
    September 2017
    August 2017
    July 2017
    June 2017
    May 2017
    April 2017
    March 2017
    February 2017
    January 2017
    December 2016
    November 2016
    October 2016
    September 2016
    August 2016
    July 2016
    June 2016
    May 2016
    April 2016
    March 2016
    February 2016
    January 2016
    December 2015
    November 2015
    October 2015
    September 2015
    August 2015
    July 2015
    June 2015
    May 2015
    April 2015
    March 2015
    February 2015
    January 2015
    December 2014
    November 2014
    October 2014
    September 2014
    August 2014
    July 2014
    June 2014
    May 2014
    April 2014
    March 2014
    February 2014
    January 2014
    December 2013
    November 2013
    October 2013
    September 2013
    August 2013
    July 2013

    About

    This website was founded in July 2013.

    RSS Feed

    Categories

    All
    American Football
    Athletics
    Baseball
    Basketball
    Behavioural Economics
    Boxing
    Broadcasting
    Competitive Balance
    Cricket
    Cycling
    Darts
    David Butler
    Declan Jordan
    Drugs
    Ed Valentine
    Epl
    Esports
    Expenditure
    F1
    Fifa World Cup
    Finances
    Funding
    Gaa
    Gaelic Games
    Gambling
    Game Theory
    Gary Burns
    Geography
    Golf
    Greyhound Racing
    Guest Posts
    Horse Racing
    Impact Studies
    John Considine
    John Eakins
    League Of Ireland
    Location
    Media
    Mls
    Mma
    Olympics
    Participation
    Paul O'Sullivan
    Premier League
    Regulation
    Research
    Robbie Butler
    Rugby
    Simpsonomics
    Snooker
    Soccer
    Spatial Analysis
    Sporting Bodies
    Stephen Brosnan
    Swimming
    Taxation
    Teaching
    Technology
    Tennis
    Transfers
    Uefa
    Ufc
    World Cup
    Wwe

Related

The website is not formally affiliated to any institution and all of the entries represent the personal views and opinions of an individual contributor. The website operates on a not-for-profit basis. For this reason we decline all advertisement opportunities. 

Contact

To contact us email sportseconomics2013@gmail.com or find us on Twitter @SportEcon.