The Economics of Sport
  • Sports Economics
  • About
  • Workshop
  • Selected Publications
  • Book Reviews
  • A Primer on Gaelic Games
  • Upcoming Events
  • Media
  • Education
  • Resources & Links
  • Data

Correlation vs Causation – The Case of Alex Oxlade-Chamberlain

27/10/2017

0 Comments

 
By Stephen Brosnan

The difference between correlation and causation is a key feature of both undergraduate and postgraduate courses on statistical methods in economics. Correlation is a statistical measure that describes the size and direction of a relationship between two or more variables. Causation indicates that one event is the result of the occurrence of the other event; i.e. there is a causal relationship between the two events. This is also referred to as cause and effect.

This summer, Alex Oxlade Chamberlain completed a £40 million transfer from Arsenal to Liverpool. The previous week, Chamberlain played 61 minutes for Arsenal in a 4-0 defeat to his new club. Oxlade Chamberlain failed to endear himself to Arsenal fans when he stated in his first press conference “we're in good form going into the Man City game after beating Arsenal 4-0 last week”. That game would finish 5-0 to Man City and was the beginning of a series of poor results by Liverpool which much of the blame being placed at the feet of their new arrival. As such, it may be worth digging a little deeper to see if there is any foundation to these accusations.

Table 1 shows the win percentage of each club pre and post transfer of Oxlade Chamberlain.
PictureTable 1 Win (%) Pre and Post Transfer of Oxlade Chamberlain

​Liverpool were undefeated for the opening three games of the season, picking up seven points from a possible nine (2W 1D). Following the arrival of Oxlade-Chamberlain on a £40million transfer from Arsenal, the Reds have picked up just six points from a possible 18 (1W, 3D, 2L). Alternatively, Arsenal picked up just one win from their opening three games (1W, 2L), including a 4-0 humiliation against Liverpool. However, since the departure of Oxlade Chamberlain the Gunners won five out of their next six Premier League matches (5W, 1L).
​
Table 2 shows the correlation coefficient between minutes played by Oxlade Chamberlain and overall points picked up by his club.

PictureTable 2 Correlation Coefficient between Oxlade Chamberlain’s Minutes Played and Points Won

It is evident from Table 2 that a negative relationship is evident across each specification ranging from a weak negative relationship between Chamberlain’s total minutes across both clubs and overall points won (-0.158) to a strong negative relationship between Oxlade Chamberlain’s minutes played and points won by Liverpool (-0.694). However, we must be careful not to conclude that Oxlade Chamberlain is the cause of his team failing to pick up points, at least from this analysis.
​
Certainly other factors have been identified as potential causes of adverse results: both teams failure to resolve defensive issues, failings in the transfer market, star players attempting to leave which may have impacted morale. As such, further analysis and a larger dataset is required before we can make inferences to cause and effect. At this point, the only thing for certain is things have not gone according to plan for the Ox or Liverpool since his big money move to Merseyside.
0 Comments

Serie B for Balance

26/10/2017

 
By David Butler

Writers on this blog often consider competitive balance in sports leagues. Evaluating balance is a critical feature of the economic analysis of sport as it impacts uncertainty of outcome in any given league. Having balance is (generally) considered a good thing. How much balanced is desired is another question.

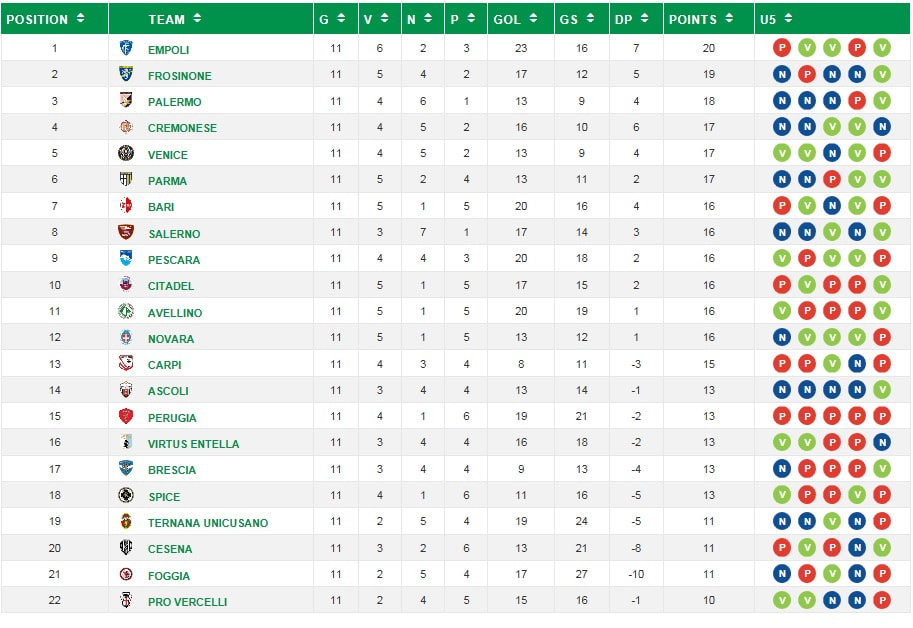
The current Serie B table is below. It’s rare that we see such balance. After eleven matches only 10 points are between the top and bottom team in a twenty-two club league. In contrast, Napoli, who lead Serie A, have amassed a 28 point lead on Benevento who are at the foot of the table and have lost all ten matches.

At present Serie B is almost a perfectly balanced league. Thanks to Robbie for quickly calculating the Herfindahl–Hirschman Index (HHI) - All draws would report a HHI of 454.54. The HHI for Serie B so far is 469.56.

Is Serie B ‘too balanced’? There seems something odd about challenging for top spot and hovering above the relegation places at the same time. As we’re only a quarter of the way through the forty-two match season, no doubt, time will reduce this balance.  
Picture

Sports Economics - Skellig Centre for Research and Innovation

25/10/2017

 
By Robbie Butler

On Friday the 3rd of November 2017 I will be presenting some of our sports economics research at the newly opened Skellig Centre for Research and Innovation in Caherciveen, Co. Kerry.

The Centre is a unique higher education and community development partnership between the Department of Adult Continuing Education in UCC, Kerry County Council & South Kerry Development Partnership (SKDP). It will serve as an outreach university campus for higher education, research and entrepreneurship and hopes to fosters collaboration, community building, and a higher education research and entrepreneurial spirit in Co. Kerry. 

Next week three poster presentations will be on display in the days prior to the event, with the public afforded the chance to view the work. The issues addressed in these posters are:
  1. Competition Structure Change, Competitive Balance, and Attendance in the GAA (John Considine).
  2. The Evolution of Sports Broadcasting - The Case of the Premier League and GAA (Robbie Butler).
  3. Relative Age in Association Football (David Butler).

I will then present the work from 7pm on  Friday the 3rd of November 2017 at the Centre in Caherciveen. All are welcome.

Sports Capital Grants – The Inequality Amongst and within Sports

20/10/2017

 
By Sean O'Connor

In a previous post, a few weeks ago I presented a breakdown of Ireland’s Sports Capital grants over the period 2002-2015 in an overall and by county breakdown (here). In summary what was noted was that inequality appeared to be more pronounced within the larger urban areas, namely Dublin, Cork and Limerick. However, what also may me of interest to people is the breakdown of the distribution between different types of sports. I have discussed this previously (here) noting that across counties particular types of sports tend to dominate the distribution in terms of funding award.

Nonetheless, I will extend the analysis to include a more up to date time series and also utilise different methods of analysis. Table 1 below highlights some descriptive statistics of the breakdown of grants by different sports, nationally over the entire time period. Before we discuss the figures presented in Table 1 it should be highlighted the methodology behind how grants where categorised into types of sports. Key words where searched for in the name of the grant recipient also the column which gave a description as to what the grant was intended for. It should also be noted, which I’ve pointed to previously that these categorises are not mutually exclusive. For instance under the Multi-Sport category it could be assumed in some cases that grants were awarded for the construction of a project for two sports, an example being an all-weather surface for a GAA and soccer team. Moreover, if a sports hall was built with grant funding, potentially numerous sporting codes could use it e.g. boxing, basketball. Thus, with this partial caveat noted let us turn to Table 1.

As noted previously, it is striking to see the inequality in terms of the share of awards given and also the share of the value of these awards. Over the entire period, Gaelic Games account for 35% of the awards given out and 36% of the overall share of funding awarded. In other words for this period and the data within this study Gaelic Games account for over 2,000 awards given out, and in nominal terms more than €200,000,000 in funding. This is nearly twice as much in terms of the share of awards and funding received by Soccer clubs over the period, the sport with the second largest share. In fact if we group Gaelic Games, Soccer and Multi-Sport awards together, these three activities account for 67% of total awards and 78% of total funding over the period. In this regard it would appear that there is quiet a degree of inequality in terms of awards given and funding between different types of sports codes.

However, what is the distribution of funding within sports? For this we turn to the GINI coefficient. On an ordinal basis, grants awarded to Basketball (0.74), Rowing (0.72) and Swimming (0.71) have some of the most unequal distribution in terms of their GINI scores. However, not a lot should be inferred from this as the GINI coefficient is known to be biased when dealing with small sample sizes (these three sports together account for 5% of awards and 3% of the value of grants). Although receiving the majority share of funding, when it comes to the actual distribution of that funding, Gaelic Games is fairly equal with a GINI score of 0.42. In contrast, other sporting codes which received large shares of funding such as Soccer and Multi-Sport projects have larger GINI scores of 0.53 and 0.59 respectively.
​
Given the heterogeneity between/within regions and sports it is also worthwhile to examine the differences between sports and regions. A follow up blog to this will examine the distribution of awards for Gaelic Games, Soccer, Multi-sport and Rugby on such a very topic.   

Picture

The Tripartite Agreement on the Transfer of Racehorses & Brexit

18/10/2017

 
By Laura Donnellan
 
The United Kingdom and Ireland joined the then European Economic Community (EEC) on the 1st of January 1973. As Ireland and the UK are dualist countries, a domestic Act was required to incorporate the three Community Treaties (European Coal and Steel Community Treaty, the EEC Treaty and EURATOM) into the respective national legal systems. In Ireland, the European Communities Act 1972 was enacted in order to give expression to EEC law. Similarly in the UK, the European Communities Act 1972 gave cognisance to the supremacy of EEC law over domestic law. Over the years, the 1972 Act in both jurisdictions has been amended to reflect changes in membership and to give effect to amending Treaties, the most recent being the European Union (Amendment) Act 2008 in the UK and European Union Act 2009 in Ireland which gave effect to the Lisbon Treaty. In July 2017 the European Union (Withdrawal) Bill (or the Great Repeal Bill as it is more commonly referred to) was put before the House of Commons (the full text can be accessed here: https://publications.parliament.uk/pa/bills/cbill/2017-2019/0005/18005.pdf). This Bill purports to repeal the European Communities Act 1972 and make other provision in connection with the withdrawal of the UK from the EU. On exit day, the 1972 Act will be repealed, however, with regard to EU-derived domestic legislation, section 2 states that such legislation will remain in force on and after the exit of the UK from the EU. This must be read in conjunction with section 5 and Schedule 1 of the Bill. Section 5 states that the doctrine of supremacy will no longer apply on and after exit day. Schedule 1 details further provisions about exceptions to savings and incorporation.
 
In an article by Arthur Beesley published in the Financial Times on the 4th of October 2017, titled “Irish horseracing fears Brexit could handicap industry”, Mr Beesley asserts that “a threat hangs over Ireland’s important horseracing industry — Brexit, which could shatter vital links with the UK, the biggest market for Irish horses and a leading racing centre for Irish owners, trainers and jockeys”. Of significance is the tripartite agreement (TPA) between Ireland, the UK and France on the transfer of racehorses. It raises the question of whether the TPA will be repealed, amended or replaced. At the moment this is mere conjecture, as UK will cease be a Member State of the European Union on exit day, the TPA as an EU measure may no longer apply to the UK. If a hard Brexit ensues and the domestic legislation incorporating the EU Directive is repealed, then it would mean that the free movement of racehorses would be effected as additional veterinary checks could be required at Customs which would both be costly and time consuming. Additional documentation/certification would also be required. As noted above, section 2 of the Bill provides that pre-exit EU-derived legislation will continue to remain in force unless it is repealed by domestic legislation. If the UK decides not to repeal the Directive on which the TPA is based, then a modified version of the TPA may be the best solution.
 
The TPA has been in existence for four decades. In the 1970s, a tripartite agreement (TPA) on the movement of horses between the United Kingdom, Ireland and France was established. Under the TPA, horses could be transferred without the need for formal veterinary inspections between the three countries. In 2005 the TPA was amended to include all equidae, with the exception of those being transported for slaughter.  Under the 2005 agreement, equidae could freely move between the three countries without health checks so long as each animal had a passport.  The amended TPA caused much concern among equine welfare bodies as the risk of undetected disease and the movement of horses destined for slaughter became increasingly apparent. In 2009, an EU Directive 2009/156/EC on health conditions governing the movement and importation from third countries of equidae was introduced, which had to be incorporated into the national systems.  The Directive covers intra-Union movement and importation from outside the European Union. Under the Directive, exemptions may be granted for equidae used for sporting, recreational or cultural purposes. The Directive had consequences for the TPA. In light of the horse meat scandal which erupted in 2013, it was decided that the TPA would be amended; these amendments came into force on the 18th of May 2014. Under the new rules, the movement of “high health” horses are traceable between Ireland and France and France and the UK.
 
The TPA is an example of a derogation given to Member States under Article 6 of Council Directive 2009/156/EC. Article 6 provides:
 
“Member States which implement an alternative control system providing guarantees equivalent to those laid down in Article 4(5) as regards movements within their territory of equidae may grant one another derogations from the provisions of the second sentence of Article 4(1) and Article 8(1)(b) on a reciprocal basis.
 
They shall notify the Commission thereof”.
 
Article 4 (1) states that equidae must show no clinical sign of disease at inspection and inspection must be carried out 48 hours in advance of the embarkment or loading of the animal.  Article 8 (1) (b) requires that a health certificate complying with the template provided for in Annex III of the Directive.
 
The Directive was incorporated into Irish Law under S.I. No. 357/2011 - European Communities (Equine) Regulations 2011 and in the UK under The Trade in Animals and Related Products Regulations 2011 (England), The Trade in Animals and Related Products Regulations (Northern Ireland) 2011, The Trade in Animals and Related Products (Wales) Regulations 2011 and The Trade in Animals and Related Products (Scotland) Regulations 2012. There is much uncertainty in the wake of Article 50 of the TEU (a Member State withdrawing from the EU) being invoked, however, secondary legislation will continue to have effect until and if they are repealed by domestic legislation.
 
The British Horseracing Authority (BHA) has stated that 22,000 horses move in and out of the UK every year with the total amount in trade estimated at £300 million (Robin Mounsey, an official spokesperson for the BHA quoted by Business Insider UK, http://uk.businessinsider.com/bha-horseracing-expert-brexit-eu-impact-300m-thoroughbred-trade-2017-3). Mr Mounsey contends that only certain ports would allow the transport of horses. 
 
 
As the TPA 2014 is based on the derogation under Article 6 of the Directive from 2009, a new TPA would need to be drafted so that its basis was no longer predicated on EU law.  As EU secondary legislation is cited throughout the TPA, a new agreement or a heavily modified agreement would arguably need to be drafted. The full text of the TPA can be accessed at: http://www.equinerescuefrance.org/wp-content/uploads/2010/12/TPA-ENGLISH-PDF.pdf.
 
If the TPA is repealed and not replaced or modified then the issue of animal welfare becomes an important consideration. The idea behind the revised TPA in 2014 was based on a number of concerns including animal welfare and biosecurity. The UK and Ireland have a shared health status for horses. The UK has been at the forefront of animal welfare legislation dating back to the 1822 Ill Treatment of Cattle Act (the world’s first contemporary animal welfare statute) and the establishment of the SPCA in 1824 which received Royal Assent in 1840 and became known as the RSPCA. Up until March 2014 and the commencement of the Animal Health and Welfare Act 2013 our animal welfare legislation dated back to 1911, the Cruelty to Animals Act 1911. As long as the UK maintains protections comparable to those required by EU law, then an agreement between Ireland and the UK and the UK and France could be concluded. It would be subject to the other Member States approving such an agreement with a non-EU Member State (or third country), in this situation, the UK.  Although the original TPA dates back to the pre-accession of Ireland and the UK to then EEC, the agreement at that time was intergovernmental in nature. In contrast, the 2014 TPA falls under the derogation under the 2009 Directive. Ireland and the UK could negotiate an agreement between themselves; however, this would be subject to the approval of the other 26 Member States. The fact that a pre-Accession agreement existed will be irrelevant as Ireland being a Member of the EU is bound by EU law and EU law is supreme and supersedes any conflicting domestic legislation.
 
If the TPA is repealed then customs duties on horses could be introduced as horses are goods for the purposes of EU law. Currently, Article 28 of the Treaty on the Functioning of the European Union (TFEU or Lisbon) applies to the UK and that provides that customs duties and charges having equivalent effect are prohibited. With regard to third countries, there is a common customs tariff. If the UK is no longer part of the common market then customs duties will need to be paid on the horse at arrival at Customs. Once the customs are paid in one Member State then the horse can move freely without incurring any more customs duties. Also, there could be VAT implications.
 
Until the UK exits the EU, the status of the TPA remains uncertain. It is hoped that a special arrangement between the UK and Ireland could be brokered that would protect the TPA, as Beesley refers to the UK horseracing industry and its concerns over the free movement of horses. He cites Will Lambe, the executive director at the British Horseracing Authority (BHA), who proffers that there is a “‘special case’ to be made for the retention of current arrangements”.

Rugby Bonus Points And Unintended Consequences

13/10/2017

0 Comments

 
By Robbie Butler

The 2017/18 European Rugby Champions Cup begins tonight when Ulster take on Wasp at Kingspan Stadium, better known as Ravenhill. This will be the 4th instalment of the Champions Cup, which replaced the Heineken Cup at the start of the 2014/15 season.

As has been the case since the 2014/15 season, 20 teams enter the pool stages, and are split into five groups of four teams. Teams in the same pool proceed to play each other twice, at home and away, between this weekend and the 3rd weekend in January 2018. At the end of the pool stage, the five pool winners and the best-runners up in three of the pools, proceed to the knockout, quarter final stage of the competition in Spring 2018.

This structure is slightly different to the previous Heineken Cup, where 24 teams entered the pool stages, in six groups of four. What has remained unchanged however, are the award of bonus points. Teams that manage to score 4 tries are awarded one attacking bonus point. One defensive bonus point is awarded to a team for losing a match by seven points or less. As always, four points are awarded to the winning team. If a game is draw two points are awarded to both teams.

Myself and two colleagues have considered the impact bonus points have had on outcomes both before and after their introduction into the Heineken Cup from 1996/97 (2nd season) to 2013/14 (final season). Our findings are very interesting.

The try bonus is extraneously effective in producing greater try-scoring outcomes, by encouraging teams to score an above-average number (four) of tries. We find that after the introduction of the point at the start of the 2003/04 season:
  • Home teams are significantly more likely to score 4 tries.
  • Home teams are significantly more likely to score a 4th try, having already scored 3 tries.
  • Away teams are significantly more likely to score a 4th try, having already scored 3 tries.

There is a catch however. Since 2003/04:
  • Home teams are significantly less likely to score 5 or more tries.
  • Home teams are significantly less likely to score a 5th try, having already secured a bonus point.

So while the bonus point has worked, there is an unintended effect – that of teams scoring less tries beyond the bonus threshold. This factor is responsible for much of the decrease in average tries scored in the bonus points era, rather than an increasing incidence of teams scoring low numbers of tries.
0 Comments

Tournament Design & UEFA Play-Off Seeding

11/10/2017

 
By David Butler

​Next Tuesday the Republic of Ireland will be drawn against Switzerland, Italy, Croatia or Denmark in the UEFA play-off for the 2018 World Cup.

The reason why the Republic have to play one of these four teams is of course because the draw is seeded. This became a controversial issue when FIFA announced, in September 2009, that the play-offs would be determined by a countries ranking and would not be an open draw. In particular, debate arose as FIFA had claimed that an open draw would be used – the rules were being manipulated during a competition. Given the timing of the decision, FIFA had a reasonably good idea which teams would be entering the playoffs …  

The worry for the Republic is that seeding the playoffs usually gives those higher ranked teams (who are usually pot 1 or pot 2 teams at the start) a second bite of the cherry. Consider the past three play-off stages.
  • In the 2014 playoffs, three out of four seeded play-off teams progressed (Portugal, Greece & Croatia)
  • In the 2010 playoffs, three out of four seeded play-off teams progressed (Portugal, France & Greece)
  • In the 2006 playoffs, two out of three seeded play-off teams progressed (Czech Republic & Spain)

Over the past three World Cup UEFA play-offs, usually only one pot 2 or ‘unseeded’ play-off team makes the finals.

Back in 1998 Ireland were beneficiaries of the seeding play-off system. Alas, we were the one seeded team not to make it from the four. The unseeded Belgium beat the Republic 3-2 on aggregate.

Regardless of our ranking, seeding the playoffs seems unfair. After all, these eight teams have already all finished second in their qualifying groups – is that not enough to show they are comparable? On the face of it, it appears another attempt by organising bodies to engineer outcomes. Chance could throw up a Croatia vs. Italy playoff next week if there was no seeding…

There are ways to redesign the playoffs to make things fairer while keeping the seeding system. Firstly, two-legged playoffs (that typically favour stronger nations) could be replaced. Why not have a one-legged play-off in a neutral location.  

Secondly, efforts could be made to separate the play-offs as a new phase of the competition. Importantly, one which is global.  In the 2002 World Cup Ireland faced Iran (from the AFC confederation) in the play-offs. Integrating UEFA teams with ACF, OFC, CONCACAF and CONMEBOL at the play-offs stage could throw up some interesting matches between nations that have never met competitively before. This approach would surely be consistent with FIFA values and could sustain play-off seeding but give UEFA nations an opportunity to overcome the increasingly difficult task of qualifying for World Cups. Approximately 40% of teams qualified from Europe from 1982 to 1990. This has fallen since then. Now under a quarter of the UEFA entrants reach the finals.

Irish Sport Expenditure 2002-2017

9/10/2017

 
By John Considine
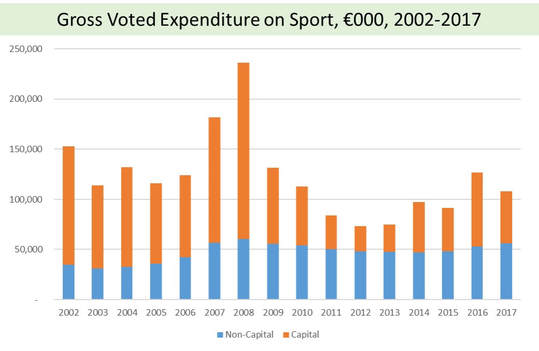
In advance of Budget 2018, the government has published the White Paper on Receipts and Expenditure for 2018.  It sets out roughly what is expected for 2018 before any changes made on Budget Day.  Despite what one reads or hears in the media today, the Ministers have probably agreed their expenditure estimate with the Department of Finance at this stage.  The Minister for Sport has probably agreed an estimate for central government expenditure on sport for 2018 (via Vote 31).  It is probably not that different from what he agreed for 2017.  We are unlikely to see the wild swings in expenditure we witnessed in the period since 2002 and illustrated in the graphic below.
Picture
There was a time at the start of the twenty-first century when the government enjoyed spending the windfall receipts from a property bubble.  The years of 2007 and 2008 were particularly enjoyable for the Minister for Sport.  Ministers doled out the cash for capital projects they had approved.  And, the physical infrastructure for Irish sport received a massive boost.

The Great Recession meant fiscal retrenchment.  Capital expenditure was slashed.  The government made good on the grants they had promised sporting clubs but the promises stopped.  It was 2014 before there was a recovery in capital expenditure for sport.

The fiscal crisis also had implications for non-capital expenditure.  It also declined but by a fraction of the cuts made to capital expenditure.  Non-capital expenditure does not show the same variation as capital expenditure.  It increased steadily from 2004 to 2008.  It has remained pretty close to €50m since 2008.  It dipped below €50m for a few years before a recent recovery.  Most of this non-capital expenditure goes to Sport Ireland.

It would be reasonable to expect 2018 expenditure on sport to resemble 2017 - at least until we know the outcome of our Rugby World Cup bid.

Sports Participation and Crime

6/10/2017

 
By Stephen Brosnan

Participation in sporting activities is considered to provide many societal benefits including increased social capital and social integration, better health and wellness and improved educational outcomes. Many studies have looked at the impact of sports participation on happiness (Huang & Humphreys, 2012), future income (Dewenter & Giessing, 2015), labour market outcomes (Lechner, 2015). The findings generally support the hypothesis that increased sports participation provides societal benefits. However, the relationship between sports participation and crime is less developed with findings more ambiguous.

Recently, I have explored the relationship between sports participation and crime in England between 2012 and 2015. The working paper utilises sports participation data sourced from the Active People Survey (APS), an annual survey conducted in the United Kingdom concerned with analysing adult participation in sport and active recreation. The survey provides the largest sample size ever established for a sport and recreational survey, providing evidence of differences in sports participation across regions as well as individuals and socioeconomic groups.

The findings suggest that sport participation reduces crime rates for both property (e.g. theft, robbery) and person (e.g. assault, sexual offences) crimes in 323 English local authorities between 2012 and 2015. The findings suggest that sports participation has a stronger effect on person crimes compared with property crimes. The results indicate that a 10% increase in sports participation leads to a fall in person crimes of 1.30 and 1.56% while a 10% increase in sports participation rates leads to a fall in property crimes of between 0.64 and 0.73%. Also, the paper finds evidence to support previous studies which identify socioeconomic variables tending to have a statistically significant impact on property crime rates as opposed to person crime.
​
The full working paper, including references cited above can be found here.

ABBA and The Penalty Kick

4/10/2017

 
By Robbie Butler

In the past various writers on this blog have considered the economics of the penalty shootout (see here, here, here and here).

A 2010 paper in the American Economic Review by Jose Apesteguia and Ignacio Palacios-Huerta called Psychological Pressure in Competitive Environments: Evidence from a Randomized Natural Experiment is another excellent contribution to this literature and has been recently operationalised.  

Using data from 129 shootouts, which resulted in a total of over 1,300 kicks, the authors found that the team the kicked first had a 60% chance of winning. This is illustrated below, with the first team represented by the grey bar, and the second, the black bar.
Picture
Source: American Economic Review (2010)

The conclusion from this is that there exists a significant and persistent advantage to the team the shoots first in a penalty kick shootout.

In order to overcome this problem, UEFA have implemented the “ABBA” system. This has nothing to do with the Swedish Eurovision winners but instead alters the sequence of kicks.

The Football Association (FA) implemented this rule change at the 2017 Charity Shield. The governing body stated that if the game were to finish level after 90 minutes, a penalty shootout would follow that would be similar in structure to the tie-break in tennis.

​Operationalised this meant “Team A” would take the first kick, followed by “Team B” taking the second and third penalty kicks. “Team A” would then return taking the next two penalties, and the sequence would repeat itself until a winner was found. Hence the “ABBA” sequence.

As luck would have it Chelsea and Arsenal required penalties to separate them in the 2017 Charity Shield.
​
Given this change, it will be interesting to start collecting the data that starts to become readily available to see if the problem identified by Apesteguia and Palacios-Huerta (2010) has been overcome. 
<<Previous

    Archives

    March 2023
    February 2023
    January 2023
    December 2022
    November 2022
    October 2022
    September 2022
    August 2022
    July 2022
    June 2022
    May 2022
    April 2022
    March 2022
    February 2022
    January 2022
    December 2021
    November 2021
    October 2021
    September 2021
    August 2021
    July 2021
    June 2021
    May 2021
    April 2021
    March 2021
    February 2021
    January 2021
    December 2020
    November 2020
    October 2020
    September 2020
    August 2020
    July 2020
    June 2020
    May 2020
    April 2020
    March 2020
    February 2020
    January 2020
    December 2019
    November 2019
    October 2019
    September 2019
    August 2019
    June 2019
    May 2019
    April 2019
    March 2019
    February 2019
    January 2019
    December 2018
    November 2018
    October 2018
    September 2018
    August 2018
    July 2018
    June 2018
    May 2018
    April 2018
    March 2018
    February 2018
    January 2018
    December 2017
    November 2017
    October 2017
    September 2017
    August 2017
    July 2017
    June 2017
    May 2017
    April 2017
    March 2017
    February 2017
    January 2017
    December 2016
    November 2016
    October 2016
    September 2016
    August 2016
    July 2016
    June 2016
    May 2016
    April 2016
    March 2016
    February 2016
    January 2016
    December 2015
    November 2015
    October 2015
    September 2015
    August 2015
    July 2015
    June 2015
    May 2015
    April 2015
    March 2015
    February 2015
    January 2015
    December 2014
    November 2014
    October 2014
    September 2014
    August 2014
    July 2014
    June 2014
    May 2014
    April 2014
    March 2014
    February 2014
    January 2014
    December 2013
    November 2013
    October 2013
    September 2013
    August 2013
    July 2013

    About

    This website was founded in July 2013.

    RSS Feed

    Categories

    All
    American Football
    Athletics
    Baseball
    Basketball
    Behavioural Economics
    Boxing
    Broadcasting
    Competitive Balance
    Cricket
    Cycling
    Darts
    David Butler
    Declan Jordan
    Drugs
    Ed Valentine
    Epl
    Esports
    Expenditure
    F1
    Fifa World Cup
    Finances
    Funding
    Gaa
    Gaelic Games
    Gambling
    Game Theory
    Gary Burns
    Geography
    Golf
    Greyhound Racing
    Guest Posts
    Horse Racing
    Impact Studies
    John Considine
    John Eakins
    League Of Ireland
    Location
    Media
    Mls
    Mma
    Olympics
    Participation
    Paul O'Sullivan
    Premier League
    Regulation
    Research
    Robbie Butler
    Rugby
    Simpsonomics
    Snooker
    Soccer
    Spatial Analysis
    Sporting Bodies
    Stephen Brosnan
    Swimming
    Taxation
    Teaching
    Technology
    Tennis
    Transfers
    Uefa
    Ufc
    World Cup
    Wwe

Related

The website is not formally affiliated to any institution and all of the entries represent the personal views and opinions of an individual contributor. The website operates on a not-for-profit basis. For this reason we decline all advertisement opportunities. 

Contact

To contact us email sportseconomics2013@gmail.com or find us on Twitter @SportEcon.