The Economics of Sport
  • Sports Economics
  • About
  • Workshop
  • Selected Publications
  • Book Reviews
  • A Primer on Gaelic Games
  • Upcoming Events
  • Media
  • Education
  • Resources & Links
  • Data

Which is better? Having the ‘Best Offence’ or the ‘Best Defence’?

28/2/2014

 
By John Eakins
This blog has had a number of contributions on factors which could be used to predict the English premier league winners (see here, here and here). Here is another one. Which will give you the greatest chance of winning the premier league – having the best offence (in terms of the greatest number of goals scored) or having the best defence (in terms of the lowest number of goals conceded)? It’s a topical question at the moment given that the current top 4 in
the premier league have two teams with the best offensive records in the league (Manchester City and Liverpool) and one team with the best defensive record in the league (Chelsea although one could arguably also add Arsenal, the other top 4 team, to this category if you exclude their big defeats to Manchester City and Liverpool). So who will triumph in the end?

Let’s look at long term trends first. Table 1 provides summary statistics based on data for the past 50 seasons of the English league. The table also gives similar statistics for the German, Spanish and Italian leagues for comparison purposes. In the table there is information on the proportion of times the best offensive team has won the league, the proportion of times the best defensive team has won the league, the median final position of the best offensive and defensive team (as there is on occasion some extreme outlier’s in the final position of the best offensive and defensive team) and the associated standard deviation.
Picture
The figures suggest that a greater proportion of English winners have been the best offensive team although the difference between this figure and the proportion of winners with the best defensive record is small. The median position of the best offensive team is also higher relative to the best defensive team. In Germany, we have the opposite trend with the best defensive team winning a significantly greater proportion of titles and having a higher  median position. In Spain, offensive teams are more successful, while in Italy, defensive teams are slightly more successful. So in ranking from most offensive to least offensive we have Spain, England, Italy and Germany. It is interesting that this ranking would bear our preconceived notions regarding football in these countries.
 
Table 2 presents the same data but this time for just the past 20 seasons of each league. In the English and German leagues there is a clear move toward more offensive teams winning the league title and having a higher median  position in the league. In the Spanish league offensive teams are just as successful while defensive teams are becoming less successful with a relatively lower median position in the league. Finally, Italy appears to buck the trend
with defensive teams becoming relatively more successful over the last 20 seasons relative to the last 50 seasons.  It would be interesting to see how this correlates with success at European and International level but that is left to another day. 
Picture
Back to our initial question. There does appear to be clear trend toward more offensive teams winning the English premier league (and other leagues) so that would favour Manchester City and Liverpool. Defensive strength is still clearly important and out of these two Manchester City have the best defensive record. So a tentative nod to Manchester City to win the premier league 2013/14. In Germany, Bayern Munich are clear favourites having the best  offensive and defensive records so far. In Spain, the analysis suggests that it’s a shoot-out between Barcelona and Real Madrid (not so much of a surprise there), while in Italy Roma could be an outside bet given that they currently has the  best defensive record.

To Sack Or Not To Sack? That Is The Question

27/2/2014

0 Comments

 
Picture
By Robbie Butler

Few things are surprising in football. Speculation surrounding the futures of David Moyes and Pepe Mel is now rife. The latter has been in charge for just 45 days! 

That said, the sacking of René Meulensteen last week did catch me by surprise. The renowned and respected coach was given just thirteen games in charge of Fulham  before it was decided to let him go. 

Fulham no doubt will argue  they had little choice given that the Dutchman failed to arrest the London club's slump which started under former manager Martin Jol. With relegation looking more likely by the week, Fulham’s new owners must fear becoming the next Bolton, Blackburn or even Portsmouth. 

Meulensteen has become the eighth manager to leave his post since the season started in August. This logic appears quite convoluted. If the players play badly sack the manager. If the players continue to underperform under the new managers, sack the new manager.

Maybe it's the players are the problem, not the manager? What do the stats suggest? The table below presents data on the points per game for ‘old’ and ‘new’ managers for the eight teams that have parted company with their manager this season.

Picture
On balance Fulham may have done the right thing. Meulensteen had an indentical record to Jol. If Jol was sacked, why not Meulensteen? Four teams have done better following the sacking of their manager; Sunderland, Crystal Palace, Spurs  and Swansea.

The two harshest sacking (in my opinion), that of Malky Mackay and Steve Clarke, appear to have backfired. Cardiff are now second from the bottom and West Brom are in a fight for survival. Sometime, it would seem, change doesn’t work.  
0 Comments

Phil Prendergast and Harry Potter

26/2/2014

0 Comments

 
By John Considine
Yesterday I received a text message telling me that Phil Prendergast (MEP) had called for the protection of Irish hurley manufacturing under the guise of the hurley being a cultural tool (or “hurl” if you are from Leinster).  My initial reaction, probably based on my training in economics, was that this was an interest group seeking to avoid competition.  Of course, the fact that a Member of the European Parliament (MEP) was making noises in the run up to the European elections was not surprising.  I read the material reported online (here) and the following words stuck out like a sore thumb - “the protective status would prevent others from making and marketing the hurley outside of Ireland”.
Picture
I then visited the website of Labour's Phil Prendergast (here).  It says that Phil sits on the Committee on the Internal Market and Consumer Protection.  I followed the link and found the ‘Welcome Words’ of the Committee Chair, Malcolm Harbour, The first two sentences of those welcoming words read “The Single Market and its free movement of people, goods and services is one of the absolute foundations of the EU. It has provided prosperity and growth, jobs, mobility and freedom of choice to Europe's citizens and businesses.”  These words seem at odds with what one of its members is suggesting.

We are more than happy to import ash to make the hurleys in Ireland.  Imagine if other countries banned the export of timber for hurley manufacturing.

During the boom years many citizens from eastern Europe came to work in Ireland.  Some worked at making hurleys with imported timber.  I remember reading newspaper stories about how some were returning home to eastern Europe make hurleys with timber from their own countries.  The idea was that they would then export them to Ireland.  Is Phil Prendergast proposing we ban such imports?

What about consumer protection?  If banning cheaper imports means kids and their parents have to pay higher prices then is this promoting hurling?  Is it promoting consumer protection?

I’m probably being too harsh on our European representative.  I can understand why she might seek to ensure that current and future generations of Irish kids have the opportunity to experience the magic of interacting with a local hurley manufacturer.  It is magic.  For those who have not had the experience, the best way I can describe it is to compare it to the moment when Harry Potter got his first wand (see it here).  If you think I’m stretching the point then compare the Harry Potter clip with what you find in superb documentary From Ash to Clash (go to about 4:30 here).

You never forget the experience of buying your first hurley in such a setting.  In my case it while visiting my grandparents’ house in County Laois.  My uncle brought me to Sean Brophy’s workshop and it was better than being let loose in a sweet shop.  A couple of years later, I was even lucky enough to get a stick made by Mick McCarthy in Riverstown, County Cork.  Legend had it that Mick made hurlies for the hurling great Christy Ring (and other great inter-county hurlers).  Under normal circumstances he would not have wasted his time making a stick for me as he knew well his efforts would be served making a stick for better players.  However, my father was a woodcutting machinist who specialized in maintaining the saws that cut timber.  In return for my father’s help, Mick delivered one of his unmistakable McCarthy hurlies.  I’m convinced I can still feel the way it felt in my hands.  This type of experience does not need to be protected by legislation. It can’t be protected by legislation.

The next best experience is to buy a stick made by prominent inter-county hurler (usually a family business).  In my time there was a year or two where some of us bought hurlies made by the Galway hurling family the Connollys.  If it came with the approval of John Connolly then it must have had something.  In recent years kids have flocked to buy hurlies made by Ben & Jerry (the O’Connors of Newtownshandrum rather than the ice-cream makers).  In the last few weeks my son purchased a Canning hurley (another Galway hurling family). This stick is brought indoors to protect it from the elements.  I’m sure he believes he will light up the summer with the aid of a Canning hurley. It was the exploits of Joe Canning on the hurling fields that prompted that purchase.  He could care less if Joe was from Portumna or Poland.  No legislation is needed to protect the Cannings when it comes to making and marketing hurlies.

I guess Phil Prendergast hopes future generations of kids experience the magic of searching for the stick that is made for them.  I think likewise.  Unlike Phil Prendergast I do not believe that legislation should be enacted to ensure that kids can only play hurling with sticks made and marketed in Ireland.
0 Comments

Boredom Fuels Dip In Global F1 Audience Numbers As Vettel Drives Fans Away

25/2/2014

 
By Ed Valentine

Competitive balance has long been a problem in the world’s premier category of motorsport which is due largely to the spending power of the big teams such as Red Bull and Ferrari. In a previous post here. I eluded to the huge differences in spending between the smaller and larger constructors. 

One result of low competitive balance is a fall in the number of global fans tuning in. Formula One Management published a media report in January confirming that viewing figures have fallen by 50 million to 450 million viewers. The drop is due to F1’s unattractiveness to the casual viewer. In seasons of close racing casual TV audience members boost up the numbers, but those viewers will tune in only if the show is exciting. It would be akin to the prawn sandwich brigade staying away from Old Trafford during a prolonged period of mid table finishes.

In TV audience terms Formula One doesn't get anywhere near the Premier League. The reason for this is because the teams are very unbalanced due to their spending capabilities. This financial difference, if compared to football, would equate to a Premier League made up of Chelsea, Liverpool, Manchester City, Arsenal, Leeds United, MK Dons, Gillingham and Walsall. Efforts are underway with the FIA to try to limit how much money teams can spend in one season with a planned resource restriction agreement; however, this is unlikely to reach unanimous consent among F1’s heavyweights.
Picture
The Barclays’ Premier League has more global viewers than any other domestic league in the world, broadcasting to 212 territories with 80 different broadcasters. The TV audience for Premier League games over a season is 4.7 billion and the broadcasting contracts for 2013-16 will be worth £5.5 billion. F1 TV rights, in comparison, bring in £300 million per season – about as much as the Turkish Premier League.

What attracts viewers to the Premier League is the propensity for teams to be relatively evenly matched. On a far greater scale than in F1 any team can potentially beat any other team on any given match day. Norwichcan be demolished 7-0 by ManCity, but then hold them to a goalless draw at home, as happened recently. Some F1 teams have been competing for four seasons and have never scored a point in an era when points are awarded to the
top 10 drivers instead of the top six. The chances of an F1 'giant killing' are not on the cards.

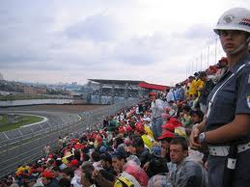
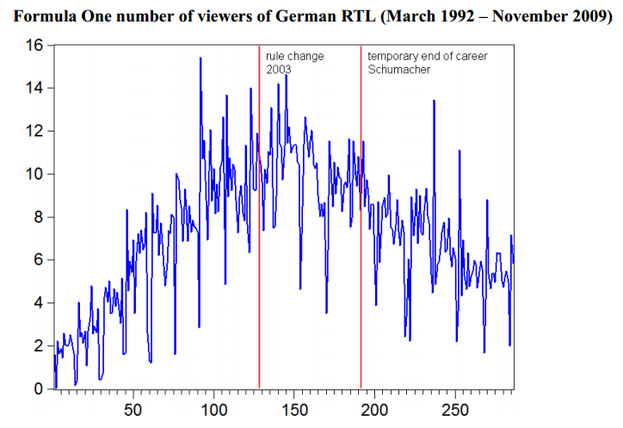
F1 has enjoyed large audiences in Germany which is due in part to the dominance of Vettel, Schumacher and Mercedes. What is striking, however, is that during these periods of dominance viewing figures had an upward trend. The graph shows that between 1992 and 2009 German audiences were highest when Schumacher was most dominant. More fans tuned in to watch him pick up his 7th World Title than watched the dramatic climax of the 2008 season when Massa lost out to Hamiltonin the final corner of the final lap of the championship.

Globally, it seems there is the desire to see a close duel at the top of the standings but within individual territories a
high level of competitive balance is not the priority for the viewers. Formula 1 needs to be more competitive, the FIA needs to turn up the heat to put the fans in a spin!

Picture
Y axis: Viewers in millions; X Axis: Number of career races contested by Michael Schumacher (308 GP)

The Franchise Tag

24/2/2014

 
Picture
By Gary Burns

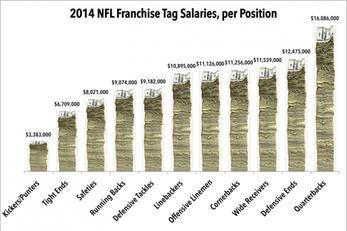
A‘Franchise Tag’ is a concept that exists in the NFL that allows each team (franchise) a once off mechanism to restrict the movement of a player that is (generally) due to become a free agent. This restricts from a player in that year from moving to another team. The window to apply the tag opened on Monday 17th February and will close on the 3rd of March.

Due to the differences in wage caps and not having transfer fees, it is almost impossible to apply to concept to association football but is a novel idea to think about all the same.

There are two types franchise tags, exclusive and non-exclusive and can get quite complex as there is also a transition tag. I’ll focus on explain the exclusive and non-exclusive tags here. Contracts in the NFL work as per association football but transfer fees are not offered to contracted players to move to other teams and once a contract ends a player becomes a free agent and thus is free to discuss, with other teams, terms and conditions. The equivalent of a footballer who is out of contract. There is also restricted free agency where the NFL team in which the player is currently playing for has the option to match other offers made to that player. Finally an NFL franchise can apply one ‘Franchise Tag’ per annum to one player to keep them at the team for at least  one more year. There is set ‘Franchise Tag’ wages for the player depending on their position. For it to be an Exclusive Tag According to the NFL's collective bargaining agreement, the player must be paid the average salary of the top five players at his position or 120 percent of the player's previous year's salary, whichever is greater. The player is guaranteed his salary for the next season and the club is guaranteed his services. 

A non-exclusive Franchise Tag, allows the player to negotiate contracts with other teams with their current team is given the right to match whatever contract they sign, if the team decides not to match the contract they are given two first-round picks as compensation for the loss of the franchise tag that year. The contract salary formula for a non-exclusive Franchise Tag is based off the average of the last five years of salaries for the top 5 players at that position.

Teams can keep prized assets for another year so new longer term contracts can be negotiated or they can position themselves for when the player eventually leaves. 

The economics behind the concept is important as the mechanism is designed to reduce player movement. As with the Draft system in the NFL, it does not allow dominant markets (teams) to emerge as have happened in football. Coupled with salary caps, it promotes competitive balance. 
 
A team can tag the same player for consecutive years but will have to pay 120% in the second year of the salary and 144% of the second tag salary if the wish to pursue a third year which is highly unlikely. 

Problems do occur of course. At the moment the biggest story stateside is that of New Orleans Jimmy Graham. The New Orleans Saints wish to apply the tag to Graham but as a Tight End. Graham believes he is a Wide Receiver. The salary disparity is nearly $5m depending on whether he is designated as a tight end or wide receiver.

So applied to Association Football, what franchise tag would you apply to your team to restrict a player leaving in another year? With Wayne Rooney’s reported£300,000 per week contract almost agreed, assuming an opportunity cost of a large transfer fee for Rooney maybe Manchester United would have been better served allowing him to become a free agent in 2015(when current contract is up), apply the franchise tag and keep his services until 2016 when he would be 31 that October? Instead they will probably contract Rooney until 2019 when Rooney will be in his 34th year.

Irish Sports Council Funding: Local Sports Partnerships

22/2/2014

0 Comments

 
By John Considine
In a previous post (here) I examined the geographical distribution of the 2012 Sports Capital Grants.  The top five counties in terms of per person allocations were Leitrim, Sligo, Mayo, Kilkenny and Cavan. These counties also did relatively well when it came to the Local Sports Partnership funding by the Irish Sports Council last week (here).
Picture
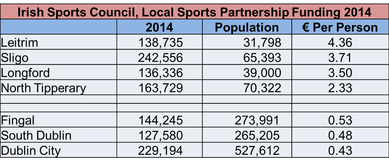
The table opposite reveals that the Leitrim, Sligo, Longford, and North Tipperary got the highest per person funding whereas Dublin City, South Dublin and Fingal got the lowest per person funding.  Leitrim is getting €4.36 per person whereas Dublin City is getting one-tenth of that (€0.43).  This is a massive difference in per person funding.  Initially, I believed that these results might be purely driven by the population of each region.  However, population only explains only part of the difference.  If we examine the column with the absolute amount of LSP funding going to Leitrim we can see it is getting €138,735 for a population of 31,794.  By contrast, South Dublin is getting €127,580 for a population 8 times larger than Leitrim.  Sligo has a population of 65,393 according to the 2011 Census of Population.  Sligo is going to get €242,556 in Local Sports Partnership funding for 2014.  This is a larger absolute amount than Dublin City, South Dublin and Fingal.  These regions have populations of double and triple that of Sligo.  The result is that Sligo is getting €3.71 per person while South Dublin is getting €0.48 per person.

Picture
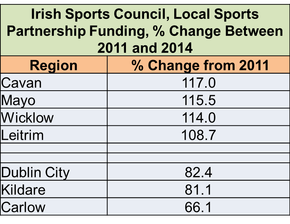
When compared to other areas of funding, Local Sports Partnership have not been hit as badly by the current fiscal crisis as some other areas of Irish Sports Council funded sport.  One third of the regions (10 out of 30) have a higher level of funding in 2014 than they had in 2011.  The table opposite presents those regions with the largest increases and  decreases.  Again, Leitrim has cause for celebration.  Cavan, Mayo and Wicklow did even better.  Unfortunately for Dublin City, it is again at the wrong end of the table.  It lies in third last position with its 2014 funding 82.4% of its 2011 amount.

Regardless of whether it is Sports Capital Grants (allocated directly by the Department of Transport, Tourism and Sport) or Local Sports Partnership funding (allocated by the Irish Sports Council) it seems that Leitrim, Sligo, Cavan and Mayo are amongst the best for attracting sports funding.

0 Comments

Football Perspectives 

20/2/2014

 
By Robbie Butler

Myself and David had a piece recently published by the UK based Football Perspectives. The work examines differences in the allocation of additional time in the English Premier League during the 2009-2010 season and can be viewed here.

The Wisdom of Crowds & 'Money' Mayweather

20/2/2014

 
Picture
By Robbie Butler

In 2005 American journalist James Surowiecki wrote the book The Wisdom of Crowds: Why the Many Are Smarter Than the Few and How Collective Wisdom Shapes Business, Economies, Societies and Nations. The book was an instant hit and the author gained worldwide recognition for his explanation of how ‘the many’ are smarter than ‘the few’, an idea he introduces by telling the intriguing story of how Francis Galton was shocked to find that the crowd at a county fair accurately guessed the weight of an ox when their independent individual guesses were averaged. 
 
A similar experiment could be run for the upcoming World Cup in Brazil. If one were to ask people independently how many goals will be scored in the entire competition, the mean value of all the guesses should be the ‘best guess’. 
 
Undefeated boxing legend Floyd Mayweather Jr took a similar approach on Twitter last week. The Grand Rapids native tweeted the following to his followers last week:
Picture
Mayweather reckons his followers know what fight is best for him next- exactly what James Surowiecki would say. Luckily (or maybe unluckily) for Amir Khan, he came out on top. 60% of the 35,000 voters opted for the Bolton fighter, according to ESPN. 

Goal Kicking Performance in International Rugby Union Matches

19/2/2014

 
By John Eakins
This just goes to show why New Zealand are the best rugby team in the world – their attention to detail. Ken Quarrie who works as an analyst for New Zealand rugby has carried out research on the goal kicking performance of international rugby players using data from 582 international rugby matches played between 2002 to 2011. The research is about to be published in the Journal of Science and Medicine in Sport (February 2014 see here).
Picture
I first noticed this on the score.ie and you can read what they think of the research (here). They also provide a link to the rankings spreadsheet on the All Blacks’ official website but for convenience it can be found (here).  Quarrie first ranks goal kickers based on their percentage success rate (a raw rank) and then adjusts this ranking (modelled rank) for factors that include kick distance, kick angle, a rating of the importance of each kick and venue-related conditions.  Based on this modelled rank the top three goal kickers over the period 2001 to 2011 are Morne Steyn (South Africa), Federico Todeschini (Argentina) and Dan Carter (New Zealand). From an Irish point of view, David Humphreys is the top ranked Irish goal kicker (15th) followed by Ronan O’Gara (34th), Paddy Wallace (39th) and Jonny Sexton (90th). O’Gara was the second best ranked goal kicker in 2010 and 2011. What is interesting is that apart from Morne Steyn (who it appears stands head and shoulders above everybody else with an adjusted success rate of 87%), there is not too much difference in the goal kicking performance of say the top 50 players. Todeschini has an adjusted success rate of 80% while Gavin Williams (Samoa) in 50th place has an adjusted success rate of 73%. So as expected not much separates the top goal kickers at international level.

Quarrie also provides what he calls an importance ranking which ranks the goals kickers solely on the success rate for kicks under pressure. He defines an important kick as one that is likely to reflect affect the outcome of the match. Specifically, the score difference at the time of the kick and the time remaining in the match are used to measure the overall kick importance. Based on this ranking the top three goal kickers are James O Connor (Australia), Morne Steyn (South Africa) and Stirling Mortlock (Australia). Ronan O’Gara (39th) is now the most highly ranked Irish player followed by Jonny Sexton (42nd), then Paddy Wallace (51st) and finally David Humphreys (86th). A lot of reports picked up on this ranking but again it is important to note that the difference in the success rates on these kicks under pressure across all the kickers in the sample is not great. So while David Humphreys is ranked 86th, his actual success rate on pressure kicks is 71% compared to James O Connor at 76%. 

One final interesting titbit from the research is the fact that over the matches studied, goal kicks comprised 45% of the total points scored, with penalties accounting for 29% and conversions 15%. This can be compared to 53% of scores that come from tries, and 2% that come from drop goals. This in itself highlights the important of the goal kicker in modern day international rugby.

Revenue Sharing and Competitive Balance in the GAA

18/2/2014

 
By Paul O'Sullivan
On page 36 of his recent report to the GAA’s Annual Congress, GAA director general, Paraic Duffy outlines what he believes is an imperfect system of financial re-distribution from the GAA’s Central Council. Mr Duffy is quoted in this
Irish Times article
as saying that “We treat all of our counties exactly the same. We give Leitrim the same direct financial support as we give any of the large-population counties. I think there’s an issue of fairness here.” 

Duffy’s argument is that the ‘weaker’ counties, with lower population and funding resources, must incur similar levels of
expenditure to ‘stronger’ counties in terms of travel, meal and medical costs, as well as having to fund players’ expenses for travelling to training from large population areas. Consequently, Duffy would like to see “a county like Leitrim or Longford…… getting more money from us. Some of the bigger counties……could do with less from us”.
 
With the current redistribution system, ‘stronger’ counties are already subsidising the ‘weaker’ counties as most  Central Council gate revenue is generated by the former, yet distributed equally among all counties. In economics jargon, weaker counties are net beneficiaries from the revenue pool.

This idea of re-distribution is usually justified in terms of ‘promoting competitive balance’. Many sports have some form of revenue-sharing mechanism or constraints on talent accumulation, e.g. salary caps and player drafts, that seek to minimise the gap between the large/rich and small/poor clubs in order to‘level the playing field’ and maintain fan interest. 

If such a proposal were to be implemented, would it be successful in improving the outcomes, in terms of playing success, of weaker counties? One of the biggest problems for many GAA counties is that their talent pool is restricted by geographic location and there is no transfer market as in professional sports. Given these constraints, providing more financial resources may not translate into much greater playing success, however ‘success’ is defined. 
 
While Duffy talks in general terms about amending the re-distribution mechanism, and rightly foresees complaints from those that would have their funding cut, he offers little indication as to what criteria might be used to assess whether one county receives more than another. While the report makes reference to differences in population size, the number of clubs in the county and what division of the National League a county is in, what other criteria might be used? Previous spending? Average attendance at home games? The number of championship games won over a given time period? As well as this, if counties are to receive different allocations, how much different will these  allocations be? Whatever criteria are used, the GAA will need to ensure that there are no perverse incentives whereby a county may find it in its interests not to exert maximum ‘effort’ on the field in order to benefit financially. 
  
As Gaelic football and hurling are amateur games for players, the GAA cannot impose a salary cap to control spending on talent.  Instead, Duffy talks about regulating spending on county teams. As it is likely that the interests of Central Council will be in direct conflict with those of many county boards, it will be interesting to see how successful the GAA would be in effectively tracking all spending on teams and what penalties would apply to those counties that break any spending regulations. 
<<Previous

    Archives

    February 2023
    January 2023
    December 2022
    November 2022
    October 2022
    September 2022
    August 2022
    July 2022
    June 2022
    May 2022
    April 2022
    March 2022
    February 2022
    January 2022
    December 2021
    November 2021
    October 2021
    September 2021
    August 2021
    July 2021
    June 2021
    May 2021
    April 2021
    March 2021
    February 2021
    January 2021
    December 2020
    November 2020
    October 2020
    September 2020
    August 2020
    July 2020
    June 2020
    May 2020
    April 2020
    March 2020
    February 2020
    January 2020
    December 2019
    November 2019
    October 2019
    September 2019
    August 2019
    June 2019
    May 2019
    April 2019
    March 2019
    February 2019
    January 2019
    December 2018
    November 2018
    October 2018
    September 2018
    August 2018
    July 2018
    June 2018
    May 2018
    April 2018
    March 2018
    February 2018
    January 2018
    December 2017
    November 2017
    October 2017
    September 2017
    August 2017
    July 2017
    June 2017
    May 2017
    April 2017
    March 2017
    February 2017
    January 2017
    December 2016
    November 2016
    October 2016
    September 2016
    August 2016
    July 2016
    June 2016
    May 2016
    April 2016
    March 2016
    February 2016
    January 2016
    December 2015
    November 2015
    October 2015
    September 2015
    August 2015
    July 2015
    June 2015
    May 2015
    April 2015
    March 2015
    February 2015
    January 2015
    December 2014
    November 2014
    October 2014
    September 2014
    August 2014
    July 2014
    June 2014
    May 2014
    April 2014
    March 2014
    February 2014
    January 2014
    December 2013
    November 2013
    October 2013
    September 2013
    August 2013
    July 2013

    About

    This website was founded in July 2013.

    RSS Feed

    Categories

    All
    American Football
    Athletics
    Baseball
    Basketball
    Behavioural Economics
    Boxing
    Broadcasting
    Competitive Balance
    Cricket
    Cycling
    Darts
    David Butler
    Declan Jordan
    Drugs
    Ed Valentine
    Epl
    Esports
    Expenditure
    F1
    Fifa World Cup
    Finances
    Funding
    Gaa
    Gaelic Games
    Gambling
    Game Theory
    Gary Burns
    Geography
    Golf
    Greyhound Racing
    Guest Posts
    Horse Racing
    Impact Studies
    John Considine
    John Eakins
    League Of Ireland
    Location
    Media
    Mls
    Mma
    Olympics
    Participation
    Paul O'Sullivan
    Premier League
    Regulation
    Research
    Robbie Butler
    Rugby
    Simpsonomics
    Snooker
    Soccer
    Spatial Analysis
    Sporting Bodies
    Stephen Brosnan
    Swimming
    Taxation
    Teaching
    Technology
    Tennis
    Transfers
    Uefa
    Ufc
    World Cup
    Wwe

Related

The website is not formally affiliated to any institution and all of the entries represent the personal views and opinions of an individual contributor. The website operates on a not-for-profit basis. For this reason we decline all advertisement opportunities. 

Contact

To contact us email sportseconomics2013@gmail.com or find us on Twitter @SportEcon.