The Economics of Sport
  • Sports Economics
  • About
  • Workshop
  • Selected Publications
  • Book Reviews
  • A Primer on Gaelic Games
  • Upcoming Events
  • Media
  • Education
  • Resources & Links
  • Data

Irish claims of unfair competition in European rugby ring hollow

22/1/2016

0 Comments

 
by Declan Jordan
Picture
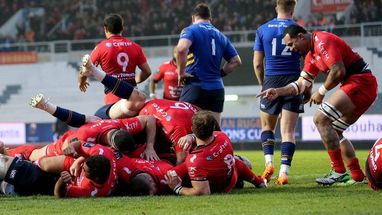
​This has been a pretty dismal season for Irish rugby clubs in European competition. Both Leinster and Munster were out of the competition with two games to play in the group stages. Ulster require a bonus point win and a string of favourable results to emerge from their group. Connacht, in the Challenge Cup, is likely to be the only Irish team in European competition after the Six Nations.
 
It’s probable that this will be the first season since 1998 that an Irish side will not appear in the knock-out stages of the elite European club competition. The situation was very different in the not-so-distant past when Munster and Leinster between them shared five titles in the six seasons between 2006 and 2012. It is important not to overstate the perceived decline of Irish club rugby based on one season (after all Munster and Leinster have appeared in the semi-finals in the last three seasons – sharing that with Toulon, Clermont and Saracens), there are persistent warnings that Irish clubs are no longer in a position to compete, and that this problem is likely to get worse before it gets better. There have been accusing fingers pointed at French Top 14 clubs (particularly Toulon) and English Premiership clubs for distorting the market for rugby playing talent with their large chequebooks – often funded by wealthy owners.
 
Toulon has now won the trophy for the last three years. Over that time their squads have boasted some the greatest names in world rugby – and this year even has former Munster and Ireland talisman Paul O’Connell. It is argued that Pro-12 clubs cannot hope to compete with the financial muscle of the French and English leagues. There are almost daily reports of threats of elite Irish players being lured to France and England to play their rugby. This is likely to be true but the claims that this prevents a level playing field ring a little hollow when the benefits that Irish clubs in particular have enjoyed during their recent successful years.
 
The success of the Irish clubs in Europe was an obvious motivating factor in the changes demanded by French and English clubs in the new qualification rules for the European Cup (formerly the Heineken Cup). In a previous post I noted that elite players at French clubs played more championship games for their clubs than their Irish counterparts.


“Taking a look at three clubs vying for honours domestically and in Europe from each league, there is a clear disparity in how they used a critical resource at flyhalf. Jonny Wilkinson appeared in 24 of Toulon's 28 Top 14 matches (86%) (including play-offs) and all 9 of their Heineken Cup matches on their way to lifting the trophy. Nick Evans played in 20 of Harlequin's 23 Aviva Premiership matches (87%) and 6 of their 7 Heineken Cup matches. Ronan O'Gara played in 50% of Munster's 22 Pro12 games but was available for 6 out of 8 (75%) of Heineken Cup games.”
​Since top players were centrally contracted to the Irish governing body for rugby (the IRFU), players were used more sparingly. There was very little at stake in the ‘domestic’ competition of the Pro12 (or whatever it was called at the time) since Irish clubs were guaranteed their places in the following season’s Heineken Cup. This has now changed so Irish clubs are likely to take the Pro-12 much  more seriously. (In that context, Connacht’s resurgence is even more worrying for the more dominant Irish clubs with limited country representation in European competition).
 
The lack of qualifying pressure and the implicit financial subsidy involved in the central contracting of Irish players were distortions in the “level playing field” in European rugby in Irish clubs’ favour. The lack of concern at these distortions at the time from Irish rugby commentators and officials makes their current protests less credible.
0 Comments

Deloitte Annual Review of Football Finance

11/6/2015

 
By David Butler

The latest Deloitte Annual Review of Football Finance can be found
here. Some key points that are good for the Premier League are below - revenues are increasing, wages and revenues are coming closer together again and debt is being reduced.

1. “Record Premier League revenue of £3.26 billion represented a £735m (29%) increase on 2012/13, due to 2013/14 being the first year of the current broadcast rights packages”

2. “The overall Premier League wages/revenue ratio fell dramatically to 58%, its lowest level since the 1998/99 season”

3 “Premier League clubs’ aggregate net debt reduced to £2.4 billion in 2014, with record levels of cash now present in balance sheets”

Deloitte predict future growth in the industry.

Purchasing power of record transfer fees (or Di Maria is literally worth more bread than Bob Latchford)

30/8/2014

0 Comments

 
by Declan Jordan
Of course the new English football transfer record set by Manchester United this week in signing Angel Di Maria from Real Madrid is generating a lot of column inches. In coming days we can expect to see some questioning the amount of money being spent on a footballer and whether this is moral. We saw similar pieces after the previous record signing of Fernando Torres by Chelsea from Liverpool in 2012. 

Robbie Butler posted on this blog a couple of times about the importance of adjusting for inflation when comparing transfer fees in deciding which are the largest transfers. Equally it's important to have a mechanism for comparing transfer fees across time. For example, how do we compare the transfer of Di Maria in 2014 to, for example, the then record transfer of another Manchester United Number 7, Bryan Robson from West Bromwich Albion in 1981 for £1.5m?

One approach would be to compare the purchasing power of the transfer fees in terms of another product. The graph below shows the number of average price houses that could be purchased with each record transfer fee paid by an English club. The data on transfer fees is sourced from Wikipedia (health warning attached) and the data on house prices is sourced from the Nationwide House Price Index (a little less of a health warning). The house price is the mean price for all housing units taken for the last quarter of the relevant year. This may be an appropriate benchmark as both are capital rather than current expenditure. Of course, housing will be a longer term investment than a striker.

So, in 1951, Jackie Sewell went from Notts County to Sheffield Wednesday for £34,500. That was the equivalent of 18 average priced houses. Angel Di Maria's fee is the equivalent of 320 houses. It's clear that football transfer fees have risen significantly in a relative context over the last 60 years. What is interesting, I think, from the graph is the decline in relative transfers fees through the 2000s - since these are all record transfers it must be driven by a booking UK property market. The Di Maria transfer is not significantly higher in relative terms than the transfer of Sebastian Veron from Laxio to Manchester United in 2001 for £28.1m. I really hope this latest transfer of an Argentinian to United works out a lot better than the last one.

Picture
While gathering the data I also came across an article with the cost of everyday consumer items in 1973 and 2013. It may also be useful to see how many of these products could be purchased with the record transfer fees at those times. Using the prices from 1973 and the nearest record transfer to that time (Bob Latchford from Birmingham to Everton for £350,000 in 1974) it's possible to compare the Di Maria transfer in terms of purchasing power. The table below shows how many of the products could be purchased with the transfer fees and the multiple increase. So one Bob Latchford would have bought 5.8 million pints of milk in 1973 and one Angel Di Maria would get you just under 130 million pints now. That's a 22 fold increase.

What's noticeable in the table is the differences in the rate of increase for some products. While Di Maria is equivalent to 22 times more milk than Latchford, he would 'only' but 8.3 times more lager and 9.7 times more diesel. This indicates the choice of reference point can provide somewhat different stories.
Picture
0 Comments

Fama & The Galway Festival

28/7/2014

 
Picture
By Robbie Butler

Day 7 Results:
The final day proved to be just as disappointing as many before. The market had us all but beaten and the trend continued. In fact, it looked like we wouldn’t have any success until Windsor Park won the last race of the Festival at odds of 2-9. A truly disappointing week. Hats off to Eugene Fama. 2014 goes to the market.
Total stake: €10
Return: €2.44
P/L on Day 1: -€7.56
P/L on the week: -€29.14

Day 6 Results:
We needed somewhat of a minor miracle on Saturday to beat the market for 2014. Marty’s Magic got the ball rolling when finishing 2nd @ 9-4. However both Spryt and Initial failed to follow up on our early success. Silwana did win the 4.55pm but at odds of 2-5. Teach Nua and Call Vinnie were both unplaced in the final two races.

Total stake: €12
Return: €4.93
P/L on Day 1: -€7.07
P/L on the week: -€21.58

Day 5 Results:
Our busiest day of the week so far. A runner in all of the seven races but our luck didn't change. Only our 5th runner (Massinga 8-11) and our 7th (Forgotten Rules 9-10) passed the post first. Both were odds on and did little to stem the damage of the other five. We are well behind entering the weekend. 2014 isn't shaping up to be a success...

Total stake: €14
Return: €7.25
P/L on Day 1: -€6.75
P/L on the week: -€14.51

Day 4 Results:
Day four proved to be a tough one. Five horses went to post and for the first time this week D.K. Weld did not saddle a winner. 8-11 shot Tested finished 2nd but the odds were too short for us to collect. Only Hisaabaat's (16-1) 4th place finish in the Galway Hurdle saw a return. 

Total stake: €10
Return: €5.00
P/L on Day 1: -€5.00
P/L on the week: -€7.76

Day 3 Results:
Five Dermot Weld trained horses took their chances on Day 3 of the Festival. Of the five, four went off at a price of 13-8 or shorter. Only Moonbi Creek (6.05pm) didn't start as the market favourite. Like yesterday we had two winners (Whitey O'Gwain @ 9-10 and Brooch @ 4-9). However, unlike yesterday we didn't finish ahead, leaving us behind overall for the week to date.

Total stake: €10
Return: €6.69
P/L on Day 1: -€3.31
P/L on the week: -€2.76

Day 2 Results:
Four horses when to post for us today. Chinese Light finished 3rd @ Evens in the 6.05pm but we failed to see a return given the short odds. However, things rapidly improved. Defining Year finished 4th @ 6-1, while both Hidden Universe (9-4) and Antique Platinum (2-5) crossed the line in front. This leaves us ahead for the week to date.

Total stake: €8
Return: €11.80
P/L on Day 1: €3.80
P/L on the week: €0.55 

Day 1 Results:
As with previous years we stick to the following format: €2 win stake if the horse is shorter than 4-1; €1 each-way for horses 4-1 or more. DK Weld saddled seven runners on Day 1 resulting in an outlay of €14. Manhattan Swing (6th @ 15/8), Postulation (2nd @ 5/2), Pay Day Kitten (20th @ 14-1), Bobby’s Heart (10th @ 7-4) and Call Vinnie (2nd @ 5-4) all failed to deliver. We did collect in the 6.45pm when 7-1 shot Grecian Tiger finished 2nd. Our only winner arrived in the 7.45pm (Timiyan @ 3-1). 

Total stake: €14
Return: €10.75 
P/L on Day 1: -€3.25
P/L on the week: -€3.25 

***************************************************************************************************************************************************
The Galway Festival starts on Monday with seven days of both flat and national hunt racing action. Since 2012 we have used the festival and horses trained by top horseman Dermot Weld to test put Eugene Fama's Efficient Market Hypothesis (EMH) to the test.
 
For non-economists, Fama published a groundbreaking article in May 1970 called the "Efficient Capital Markets: A Review of Theory and Empirical Work", which appeared in the Journal of Finance and conceptualized the idea of the efficient market hypothesis. Put simply, Fama concluded that 'the house always wins' (as they say in Vegas). 

We disagree. If you had followed D.K. Weld over the past two Festivals, assuming the same stake on all horse, you would have seen a return of 12.5% in 2012 and 4.6% in 2013.  

Monday will see that start of our quest to, once again, ‘beat the bookies’. Let's hope 2014 proves to be just as profitable. 

Supporter-Owned Clubs Proving their Worth

20/7/2014

 
By John Paul Clifford
Picture
There is a growing problem in football in many countries, which has also affected Irish football significantly in recent years, of clubs living beyond their means and going under due to the weight of excessive debt. This becomes a real problem for fans losing the team they adore, along with jobs lost, unpaid debt to local businesses and a void being formed which once brought people together in a positive manner. The massive rise in transfer fees and wages across the continent at the top levels has not improved the overall game. Those with the massive television deals may benefit but the rest are left to fight among themselves for any smaller deals that may come their way.

In fact, a recent European Commission report focusing on the professional sport transfer market proves that the above is indeed correct. This has led to a massive gap between the highest tiers across Europe and anything outside the top divisions, making it increasingly harder for other clubs to compete. Sean Kelly MEP spoke on behalf of European Parliament’s committee on Culture and Education which includes sport, saying that ‘’The figures are striking, €3 billion is spent every year on transfers in professional football in Europe, with only approximately 3% of that or €60 million filtering down towards the smaller and amateur clubs for the development of the sport and talent for the future.

The proposal being floated is to have a 'fair play levy' on these exorbitant transfer fees would help smaller clubs and grassroots threefold: compensating them for the costs of training and educating young players, funding development of sport at community and grassroot level, as well as helping clubs to compete on a more level playing field’’. 

The above figures show that finances are not filtering down through to the lower levels and grassroots clubs in the game, who often provide the initial starting point and footballing education for the future‘superstars’ of the game who later end up with the big clubs.

This brings in a fundamental question though, if 97% of the transfer fees don’t ‘trickle down’, where does it go? Well, a lot of the top clubs across Europe have to serve many masters such as investors, owner’s profits, operating costs, debts, high wages, dividends, and focus on the stock market. A lot of this money within the top clubs may be repatriated to areas outside with which the clubs themselves actually operate in, which leads to less money within the local economies, less spin offs, lower growth (if any) and lower social benefits to the local communities. Some clubs even have their company's incorporated outside of the locality they represent as a club for tax reasons. Some are incorporated in the Cayman Islands. This reduces taxes and forces money which could have been reinvested or kept within the locality of the club, further increasing the 'value added' aspect to the economic impact the club has in the local region. 

This is why fan ownership can offer a fantastic alternative. Less financial risk is likely to be taken, as fans on the clubs board of management are unlikely to personally guarantee financial risk in a club they love. The fans and board often hold many skills from their personal and professional lives which can be of great benefit to their club. This can actually save clubs money in the long run as they don’t have to seek it externally. Fans generally pay a subscription to become a shareholder or member of the club. This generates a nest egg for the club providing security for any unforeseen situations that may lay ahead. That pot of money can also be used to improve the club, reduce debts or for social projects which can help both the club and local community. Fans are unlikely to be focused on dividends, returns, benefits, expenses, and massive profits. This means that the money is generated within the club, is more likely to remain within the club. Any profits are very likely to be reinvested in the club and/or local community. This creates both economic and social benefits to local community.

Picture
Clubs that have their fans at the heart of their ownership structure allows for instant feedback on all issues which the club can take on board and address more readily, rather than clubs which are privately owned and may have to commission studies, reports and interviews to get a feeling of how the people (fans) outside of the clubs ownership feel about fundamental issues. It is only logical for fans to have a large input in to the running of the club. After all, these clubs are a business, any good business must look at its market and how the market feels about issues. By bringing the market in to an internal aspect of the club, this creates goodwill, loyalty, accountability and long term financial backing (in the form of membership fees) which the club can rely on. That creates a financial safety net or ‘rainy day’ fund for any future situations. This is in contrast to financial backing from privately owned groups who are likely to pull the plug on their investment as soon as it becomes unlikely that a return will be made. In fact, director’s loans may be placed on the club, pushing it in to further debt until the investor’s returns are met. This can financially strain future owners of the club, who may be the fans, as they are likely to be uninterested in paying the previous owners for their work on top of purchasing the club. However, if they are not met, this can force the club in to insolvency and possible extinction. The fan ownership model creates a sustainable, long term strategically planned club with a constant fundraising mechanism in place, in the form of membership subscriptions.

In recent years in the League of Ireland (Airtricity League), many clubs have faced several financial situations. Some have unfortunately met their demise, whilst others have become supporters owned clubs. Cork City, Sligo Rovers, Shamrock Rovers and Dundalk are just a few who have supporters groups at the heart of the decision making with respect to the running of the club. In times before some clubs had become supporter owned, massive unsustainable losses was surrounding the league as a whole. This sadly led to the demise of some clubs including Sporting Fingal, Monaghan United and Kildare County. Some other clubs had to rejoin the league years later or reform under new ownership, such as Cork City and Derry City. In 2007, the collective losses of the league was €6.9 million. In 2012, the league recorded a collective profit of €241,000. Some of this can be distorted by prize money received by Shamrock Rovers from their very successful 2011 Europa League run, but it remains to be seen if it was included in the 2011 or 2012 accounts. Either way, the problem has stabilised for the league as a whole. Clubs run by fans are being run far more prudently. There have been no massive financial losses recorded either, the most being €40,000. As more clubs have become supporter owned, they have become far more prudent, only spending what they take in, being conservative with estimates. This shows why the problem has reduced and hopefully with more supporter involvement, we can see the league record yearly collective profits on a consistent basis. 

As the huge losses that once gripped the League of Ireland have been eroded, this allows money generated by clubs to be spent in other forms, rather than servicing debt. Stadium facilities, training grounds, under age teams and community projects can be considered and invested in by the clubs and supporters, the possibilities are endless, with less debt and supporter ownership, fans have the power to make real, sustainable and positive change for their clubs. The feeling that a supporter can have even the smallest say in the running and direction of a club is hugely encouraging, rewarding and also keeps them a supporter for life, leading to a sustainable market and model. The days of relying on outside investment based on unsustainable spending and lack of sound structures within clubs appear to be gone. Clubs have focused on prudent financial planning and developing structures, links with the community and underage teams, leading to more youths getting senior experience, has resulted in a more financially sound league with more supporter involvement in the decision making process at many of those clubs. This appears to be the way forward and for now, for the first time in a very long while, clubs and supporters are rowing in the right direction together, leading to healthier clubs and a healthier league. The supporter ownership model is leading the way.

This article is based on one that originally appeared in the European Commission supported ‘Heart of the Game’ document, which was created by the FORAS Trust.

The Finances of Football Associations in Britain and Ireland

17/4/2014

 
by Sean O'Connor
Picture
Information on and interest in football clubs’ finances have grown considerably over the years, to the point whole financial reports have been published on them. One of the most well known and anticipated is the “Deloitte Football Money League”. This yearly report, now in its 17th edition provides a detailed analysis of clubs’ financial performance over the course of a season.

However, while financial information on clubs is generally easy to access, information on national associations’ performance generally goes undocumented, at least in a comparable sense.  Fortunately a large level of information on national associations’ financial performance is readily available and with this in mind I’m going to examine a number of financial measures for the football associations of England, Wales, Scotland, Northern Ireland and the Republic of Ireland from 2003-2012

Turnover or revenue highlights monies received by each association from ticket sales, sponsorship deals, television rights, qualification for tournaments etc.  Although all associations are generating a greater level of turnover in 2012 than that recorded in 2003 (or 2006 for Northern Ireland), none can match the capabilities of England. This is no surprise when you factor in the revenue streams that the FA has to call upon in comparison with the other associations. Qualification for major championships, multi-million pound sponsorship deals with Budweiser, Vauxhall as well as the TV rights to the FA Cup mean England are a juggernaut with regards to revenue generation. Surprising is Ireland’s impressive performance on turnover throughout the period. A doubling of revenue in the FAI from 2003 to 2012 is a significant achievement given the interim period didn’t see the nation qualify for a major tournament (they did qualify for the European Championships in  2012), which usually brings with it increased sponsorship revenue.

Picture
Retained Profit refers to the profit left to an association once all costs and taxes have been accounted for. During the period examined the FAI was the association making the largest loss (in 2008). A number of factors were noted for this loss, operating losses being the greatest of them. (Click here for summary). FAI profits have dropped dramatically from highs of over €4m in 2007. Of all the associations the Welsh FA was the only organisation to record a loss for 2012. Throughout the entire period the SFA recorded profits in every year with 2006 being the most impressive. 
Picture
Examining wages and salaries from a per worker basis, no association is paying staff on average more than what they did at the start of the period under review. If we take the change in wages since 2007, as this year provides comparable data for all 5 associations, FAI salaries per worker fell by -7.5%, Welsh FA by -3.7% England FA by -30.9% and IFA by -20.3%. During this period only the SFA per worker salaries increased, by 8.6%. Only the FAI has decreased staff numbers, with all other associations employing more staff now than they did in 2008. 
Picture
Table 4 highlights the fees which directors of the various associations received throughout the period examined. In the FAI, in nominal terms John Delaney was paid a salary of circa €431,000 in 2010, however adjusting for inflation this corresponds to circa €450,000 in 2012 terms. Only the highest paid director in the FA received a higher allowance, of circa €701,000, which is nearly double what the highest paid director of the SFA receives. However, it should be noted that the fee to the highest paid director in the FA has dropped considerably since 2011 (-48%). In contrast the SFA has increased the amount paid to its highest paid director since 2010. Directors’ fees in the other associations are quite substantial in comparison to the Welsh FA. In 2012 €90,000 was paid out in directors remunerations, up from circa €20,000 the previous year. 
Picture
Throughout the period examined both the FAI and English FA undertook considerable costly capital projects. In the FAI’s case this was the reconstruction of the Old Lansdowne Road and new Wembley for the FA. As Table 5 indicates these projects added considerably to both associations long term debt, which has been a focal point of many opinion pieces in regards to both associations. In fact the FAI have acknowledged that they may not be able to achieve their ambition to be debt free by 2020, and having only reduced their long term debt by 3.3% between 2012 and 2011 it is easy to see why. Similarly the FA are extremely determined to reduce their debt burden, so much so that they’ve sold the naming rights to their stadium for both football matches and music concerts. 
Picture

    Archives

    March 2023
    February 2023
    January 2023
    December 2022
    November 2022
    October 2022
    September 2022
    August 2022
    July 2022
    June 2022
    May 2022
    April 2022
    March 2022
    February 2022
    January 2022
    December 2021
    November 2021
    October 2021
    September 2021
    August 2021
    July 2021
    June 2021
    May 2021
    April 2021
    March 2021
    February 2021
    January 2021
    December 2020
    November 2020
    October 2020
    September 2020
    August 2020
    July 2020
    June 2020
    May 2020
    April 2020
    March 2020
    February 2020
    January 2020
    December 2019
    November 2019
    October 2019
    September 2019
    August 2019
    June 2019
    May 2019
    April 2019
    March 2019
    February 2019
    January 2019
    December 2018
    November 2018
    October 2018
    September 2018
    August 2018
    July 2018
    June 2018
    May 2018
    April 2018
    March 2018
    February 2018
    January 2018
    December 2017
    November 2017
    October 2017
    September 2017
    August 2017
    July 2017
    June 2017
    May 2017
    April 2017
    March 2017
    February 2017
    January 2017
    December 2016
    November 2016
    October 2016
    September 2016
    August 2016
    July 2016
    June 2016
    May 2016
    April 2016
    March 2016
    February 2016
    January 2016
    December 2015
    November 2015
    October 2015
    September 2015
    August 2015
    July 2015
    June 2015
    May 2015
    April 2015
    March 2015
    February 2015
    January 2015
    December 2014
    November 2014
    October 2014
    September 2014
    August 2014
    July 2014
    June 2014
    May 2014
    April 2014
    March 2014
    February 2014
    January 2014
    December 2013
    November 2013
    October 2013
    September 2013
    August 2013
    July 2013

    About

    This website was founded in July 2013.

    RSS Feed

    Categories

    All
    American Football
    Athletics
    Baseball
    Basketball
    Behavioural Economics
    Boxing
    Broadcasting
    Competitive Balance
    Cricket
    Cycling
    Darts
    David Butler
    Declan Jordan
    Drugs
    Ed Valentine
    Epl
    Esports
    Expenditure
    F1
    Fifa World Cup
    Finances
    Funding
    Gaa
    Gaelic Games
    Gambling
    Game Theory
    Gary Burns
    Geography
    Golf
    Greyhound Racing
    Guest Posts
    Horse Racing
    Impact Studies
    John Considine
    John Eakins
    League Of Ireland
    Location
    Media
    Mls
    Mma
    Olympics
    Participation
    Paul O'Sullivan
    Premier League
    Regulation
    Research
    Robbie Butler
    Rugby
    Simpsonomics
    Snooker
    Soccer
    Spatial Analysis
    Sporting Bodies
    Stephen Brosnan
    Swimming
    Taxation
    Teaching
    Technology
    Tennis
    Transfers
    Uefa
    Ufc
    World Cup
    Wwe

Related

The website is not formally affiliated to any institution and all of the entries represent the personal views and opinions of an individual contributor. The website operates on a not-for-profit basis. For this reason we decline all advertisement opportunities. 

Contact

To contact us email sportseconomics2013@gmail.com or find us on Twitter @SportEcon.