The Economics of Sport
  • Sports Economics
  • About
  • Workshop
  • Selected Publications
  • Book Reviews
  • A Primer on Gaelic Games
  • Upcoming Events
  • Media
  • Education
  • Resources & Links
  • Data

Prospect Theory in the Champions League

30/4/2018

 
By Robbie Butler

I sat watching the Champions League semi-final first leg between Liverpool and Roma last week and had mixed emotions at the end of the game. As a Liverpool supporter I have been trying to reason why I was a little uneasy despite the fact the Reds had secured (another) three goal advantage going into the second leg of a Champions League knock-out game.I consoled myself with the fact that others around me had similar feelings. 

Before the game I think a three goal lead would have been taken by every Liverpool player and supporter. In fact, all would probably have taken a win, of any description, and some may have been content with a 0-0. Even a score draw would not have been an awful result. 

The root of my uneasiness can be somewhat explained by anchoring - a cognitive bias that explain the tendency for people (in this case a football supporter) to rely too heavily on an initial piece of information. The initial information was a 5-0 lead that had me thinking about the final. 5-1 was less favourable to this. 5-2, as the result turned out be, was less favourable again. 

The sequence of the score was very important. Had Roma led 2-0, a 5-2 win for Liverpool would have been heralded as one of the greatest comebacks of all time. Had the game been 2-2, and Liverpool gone onto win 5-2, the win would have been seen as a great victory. When 5-0 becomes 5-1, and then 5-2, this is not the case despite the fact the outcome is identical. 

This moves me on to prospect theory - the idea that  people make decisions based on the potential value of losses and gains rather than the final outcome. There are three fundamental pillars at the heart of the theory, created by Daniel Kahneman and Amos Tversky. One: Evaluation is relative to a neutral reference point. Two: Diminishing sensitivity to gains and losses exist. Three: Loss aversion is paramount, with losses looming larger than gains.

​The theory is best explained by the graphic to the right, which I have manipulated to show the relationship between the joy and pain from scoring and conceding a goal which I experienced last week.
Last Tuesday night, I certainly felt the salient S-shape of the prospect theory graphic. The first Liverpool goal gave me the greatest leave of satisfaction, followed by the second and so on...There is nothing new here, it is simply diminishing marginal returns.

However, the pain of the first Roma goal, even at a scoreline of 5-0 at the time, was greater to me than the goals going in the other way. Some of this explanation is evolutionary. The second Roma goal, whilst just as damaging as the first, did not elicit the same cognitive reaction. It should have. There were the same value. 

With the second leg this week I am anticipating more pain than joy but, I hope, not so much that it  might turn the tie around. 
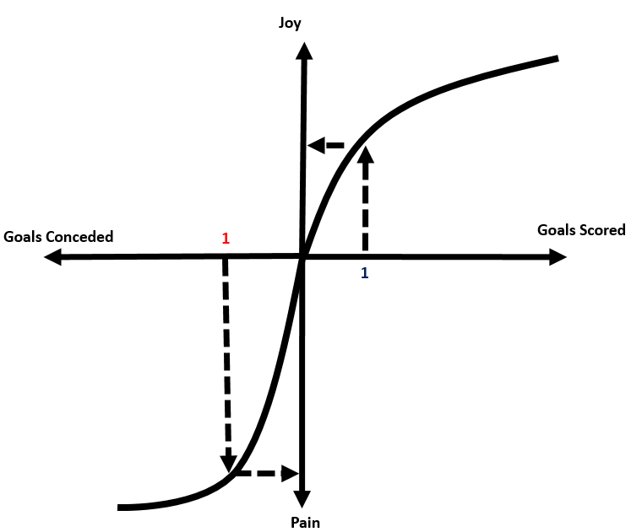
Picture

Prize Money at the Festivals

27/4/2018

 
By Robbie Butler

This week we had the privilege of addressing the University of Liverpool's MBA in horse racing class on Merseyside. We had a good conversation about many racing issues, particularly the tendency for Irish horses to travel to the UK in large volumes but a much smaller flow of traffic the other ways across the Irish sea.

In many respects this is unusual given the prize money on offer in Ireland. I have previously addressed this here and here. With Punchestown's Festival in full flow this week it is notable that there are far fewer English horses running in Ireland than Irish trained horses as the English equivalent - The Cheltenham Festival. Prize money however might answer this.

Four years ago I addressed this issue, and while prize money in Ireland tends to be better on average than the UK, the same cannot be said when comparing Punchestown to Cheltenham. Below I compare the various races, which match up quite well across both festivals, and the corresponding prize money. Just one, the Champion Bumper, has larger prize money in Ireland than the UK. 
Picture
Cheltenham continues to dominate in terms of the money on offer and therefore it is no wonder the flow of horses tends to be from these shores to the Cotswolds rather than the other way around. 

Darts Players are Getting Better Too

24/4/2018

 
By David Butler

Last week John Eakins looked at the ‘increase in perfection’ for snooker players scoring a 147 (maximum) break. See his post below. He mentioned darts as another sport (?) where the ultimate display of skill can be achieved. As 9-dart-finishes are so rare, here I look at the average number of 180 throws for the PDC tournament over ten years (2008-2018). 180 is the highest score possible with three darts. Perhaps it can be thought of as a type of ‘mini-perfection’ for any given set of three darts. A 180 is recognisable as it is typically greeted with an animated announcement from the commentator and loud roars from watching spectators.  

The chart below shows the average number of 180’s, adjusting for the number of players, for eleven years of data from 2008 to 2018.  Typically, the allocation of these 180 data are skewed for any given tournament given that it is a knockout design.
Picture
The next two charts show other measures of improved performance in the PDC over ten years. These consider the 3-dart averages per player and high checkout averages. I guess all of these measures are correlated and shouldn’t be thought of as independent but rather showing a similar trend.

Like snooker, the equipment in darts hasn’t changed that much over the years, hence technological change may only marginally effect player ability. Improved performances could be due to increased practice, rules to improve professionalism and other incentives such as increased prize money.
Picture
Picture

Research Masters - MSc (Commerce)

23/4/2018

 
By Robbie Butler

The Department of Economics at Cork University Business School (UCC) Ireland, are pleased to invite applications for a specialist postgraduate research masters in sports economics.

PROGRAMME PARTICIPANTS
Participants in this programme will be enrolled in the full-time MSc (Commerce) - Economics (Full-Time) for one year, with a start date of October 2018. They will be paired with a supervisor(s) from the Department of Economics who is currently undertaking research in sports economics. 

Programme participants will conduct original research in sports economics. Specific topics and appropriate research methods will be co-developed by the supervisor and advisors, considering the participant’s application, interests and background.

Students will leverage their research, with their supervisors, with the aim of producing research articles for conference presentations and other academic outlets such as peer-reviewed journals.  By the end of semester 3, participants will complete a full research paper, between 12,000 and 15,000 words in length.

SUCCESSFUL APPLICANTS
Applicants must have obtained a standard of at least Second Class Honours (Grade One) in an approved primary degree or present other such evidence under the University’s Policy for the Recognition of Prior Learning for Admission to Research Degrees.

They must demonstrate an aptitude for creative problem solving, analytical and critical thinking, effective written communication, and capacity for self-directed and independent learning.

Applicants must also submit a research proposal (maximum 1,500 words) outlining an empirical question.  In this proposal applicants should explain how their research question relates to theory and the current literature. They should detail the relevant data sources, and suggest potential methods of analysis. A timeline for the research should also be provided.

An interview with the Programme Directors must also be successfully completed as part of the application process

WHY CHOOSE THE MSC (COMMERCE) - ECONOMICS)?
Key advantages of the programme include:
  • Researching within a vibrant group of academics studying and publishing at the nexus of sport and economics.
  • Having the opportunity to attend seminars, workshops and conferences where visiting scholars in the field present cutting-edge research.
  • Initiating a research platform to potentially grow further collaborative projects.

TO APPLY
Applications should be made via the Postgraduate Application Centre (PAC) using the course code CKM07. 
Informal enquiries can be directed to either r.butler@ucc.ie or david.butler@ucc.ie

Snooker Perfection

20/4/2018

 
By John Eakins

Snooker is a sport which does not feature that heavily on our blog. Given that the most prestigious global snooker tournament, the World Snooker Championships, is starting this Saturday (21st April), it is a good opportunity to take a look at the game.

One interesting feature is that it is an example of a sport where there is a possibility of achieving a measure of perfection. What I refer to here is the 147 maximum break. This is when the player pots all of the balls on the table in the right order without missing a pot or making a foul shot. That is, 15 reds and 15 blacks (giving 120 points) and all of the remaining 6 colours (giving 27 points), consecutively.

It is perfection in the sense that it is the maximum number of points that a player can achieve in a break in one frame (although there is a caveat to this, if the opposition player makes a foul initially and you use one of the colours as a free ball before potting the remaining balls – but this happens on even rarer occasions). While it is only 36 pots in a row, those who know the game of snooker, appreciate that it represents the ultimate display of skill. Its possible equivalents include a 9 dart finish in darts, a sub 60 round in golf and a perfect 10 in gymnastics.   

The first official maximum break in professional competition was made by Steve Davis in 1982. Since then a total of 138 maximum breaks have been achieved in professional competitions. Fig. 1 below present the number of 147’s achieved over time (on a per season basis – with thanks to cuetracker.net for the data). As can be seen there is a significant trend upwards in the data. Taking simple averages, from 1981-1982 to 2000-2001, 2.1 maximum breaks were recorded on average each season. Between 2001-2002 and 2017-2018, 5.7 maximum breaks were recorded on average each season.
Picture
One needs to be careful in interpreting this data however as the number of matches and frames have also increased over time. Adjusting the figures for the number of frames played per season (i.e., 147’s per 10,000 frames played) gives us the data in Fig. 2.
Picture
Even when adjusting for the number of frames played, the trend is still very similar. Again, taking simple averages, from 1981-1982 to 2000-2001, about 1 in every 10,000 frames had a maximum break, while between 2001-2002 and 2017-2018, the rate increased to 3 in every 10,000 frames.

So what explains this increase in perfection? The increase in the use of coaches, and in recent years the use of mind coaches, is undoubtedly an important factor. The expansion of the game, particularly into the Asian market, is also probably a factor in terms of increasing the degree of quality and competition. Technological improvements, such as the increased quality of the tables and cue tips would also have an effect but I suspect they play a more minor role in contrast to technological improvements in other sports.

Or maybe it’s simply down to increased levels of practice among pro-players. While it is very difficult to verify this, given the absence of data, snooker appears to me to be one of the games where practice plays a very significant role. Furthermore, in the debate between natural talent versus 10,000 hours of deliberate practice, I would suspect that snooker falls more in the latter category as a determinant to achieving success and/or perfection on a regular basis.

For those of you with a passing interest in the sport, Fig. 3 displays the number of centuries per 100 frames played, a more standard measure of talent and skill that is used in the game. Again, as you can see, the trend is upwards over time. In the seasons from 1981-1982 to 2000-2001, there were 2 centuries for every 100 frames, while in the seasons from 2001-2002 and 2017-2018, the rate increased to 5.5 centuries for every 100 frames.
Picture

Where VAR Can and Cannot Work

18/4/2018

 
By Robbie Butler

FIFA is the body that has run world football since 1904 but it does not hold responsibility over the rules of the game. Instead the International Football Association Board (IFAB) retains this honour, and has done so since 1886. FIFA is represented on IFAB and, given the voting arrangements on the Board, any rule changes require FIFA support. Those that follow football closely will recognise that this authority is quite conservative. 

The 2017/18 Laws of the Game are very different in this regard as they saw the inclusion of new laws, for the purposes of testing, the most significant being the introduction of the Video Assistant Referee (VAR). VAR is mentioned twice in this document and it says:
​
“For a Law to be changed, The IFAB must be convinced that the change will benefit the game. This sometimes means that the proposal will be tested, e.g. the current video assistance for referees (VAR) and 4th substitute in extra time experiments”.

“The IFAB will continue the video assistant referee (VAR) experiment with around 20 competitions, including FIFA, undertaking ‘live’ experiments of the protocols established in 2016”.


I have watched a large number of games where VAR has been used. In my opinion, it has not benefited the game. It’s becoming clear that there are certain instances in football, and indeed sport, where video technology can help and other scenarios where it is no better than the referee. The dividing point comes down to whether a rule or law is objective or subjective.

Objective rules are based on fact. They don’t require opinion, feelings or emotions. Something is or isn't. Subjective rules are open to interpretation and can be influenced by emotion or opinion. 

Tennis and rugby are two excellent examples where video technology are used superbly to ensure fairness in the application of the rules of each game. Hawk-Eye has become an exciting element of tennis and is effectively flawless as the rule is objective. Did any part of the ball touch any part of the line? If yes, the ball is in. If no, it is out. We don't read about instances where Hawk-Eye 'may have got it wrong'.

Ireland’s third try against England at Twickenham in the recent Six Nations is another great example. Jacob Stockdale’s solo run had a number of questions posed of it. Did Stockdale knock the ball forward with his hand? Yes, or no? Did the ball cross the end-line before Stockdale put downward pressure on it? Yes, or no? Did Stockdale apply downward pressure on the ball? Yes, or no. These questions don’t require interpretation. They are not open to opinion or judgement calls.

Football has had similar success with goal-line technology. The question is objective. Did all of the ball, cross all of the goal line? This change has been a welcome addition. I bet Frank Lampard wishes it was in place during the 2010 World Cup in South Africa. I have yet to see this technology fail. I doubt it ever will. 

If the VAR experiment is to work like these examples, it needs to be altered. Using VAR to “help” with subjective rules is a recipe for disaster. Everyone views the game differently. A good tackle to one person might be a foul to another. A pull on a jersey, where a player goes down, could be a penalty to one viewer and a dive to another. That is what the referee is there for. If VAR is to be used for these, why the need for the referee? 

To use VAR, there must be a 'clear and obvious' need - this seems objective but in reality it is still fuzzy. How do we justify that the foul on player X was clear and obvious but the foul on player Y was not? The controversy is just pushed back a step.   

VAR could be used in some circumstances but only where rules are objective. For example, goals where offside may be an issue could offer some hope but the parameters for use need to be made very clear.

At the moment a player is offside if "any part of the head, body or feet is in the opponents’ half (excluding the halfway line) and any part of the head, body or feet is nearer to the opponents’ goal line than both the ball and the second-last opponent”.

There are two instances here where VAR could work, for the benefit of the game. Scenario one occurred in the recent Champions League semi-final between Manchester City and Liverpool. Leroy Sane was incorrectly judged to be offside, having put the ball in the net, just before half-time. In this instance, VAR could have confirmed an incorrect decision and awarded the goals. The second scenario is when a goal is scored and awarded, where offside might be an issue. These occurrences are rare but do occur, and in this case, the referee could rule out the goal and award the defending team an indirect free-kick as is the norm with offside decisions. ​Crucially, in both cases, the game can only restart in one of two ways; a kick-off at the centre circle or an indirect free-kick. At the moment VAR could result in a kick-off, penalty, an indirect-free kick, a thrown-in, a corner, a goal-kick, etc. 

A word of caution. The parameters on this would need to made very clear so that everyone is aware how far back in play offside decisions could be viewed. VAR may require a complete overhaul of the Rules of the Game if it is to work like technology in other sports. This begs the questions whether it is worth the cost. 
​
Most recently, German referee Guido Winkmann had to ask players from Mainz and Freiburg to return to the pitch during half time as VAR had awarded a penalty. Anyone that thinks this will “benefit the game” is mistaken. 

Goals from Corner Kicks

16/4/2018

 
By John Considine
While watching part of the Newcastle v Arsenal game yesterday I was slightly taken aback by a table of numbers detailing the goals from corner kicks.  Arsenal were amongst a number of teams with eight goals from corner kicks this season.  At least that is what I thought I saw.  It has been nagging at my brain ever since.  To further bother my brain, I seem to remember Southampton were listed as scoring 7 or 8 from corners.  Arsenal have scored a total of 62 goals and Southampton a total of 33.  Corners seem to be a good source of goals.  Or are they?

Chris Anderson and David Sally question the value of a corner kick in their book The Number Game: Why Everything You Know About Football is Wrong.  Their analysis of 1,434 corners from 134 Premier League games in 2010-11 suggests a corner is worth 0.022 goals.  In May 2015 Michael Caley had a cracking article in the Washington Post where he used two seasons of games from English, German and Spanish leagues.  That was 20,000 corners and a value of 0.035 goals per corner.  Caley also examined how the corner kick could be costly in terms of dragging defenders into the opposition penalty area and making the team vulnerable to a counter attack.

Anderson & Sally framed their numbers with the Jose Mourinho line about the English cheering the award of a corner kick almost as loudly as a goal.  The suggestion is that fans are fooled by the award of a corner kick.  And, it is not just fans.  Managers like Nigel Adkins believe there is value to a corner kick.  In fact, Adkins has blogged on the importance of corner kicks (here and here).  If you are a fan of Southampton is it not understandable that you get excited when they are awarded a corner kick.  A large proportion of your goals come from that source.

Looking at the Arsenal number for this season shows that they have 203 corners.  Eight goals implies that a goal comes along every 25 corners.  A corner is worth 0.039 goals.  Seems small.  But remember 13% of Arsenal goals come from corners.  That is over 1 in 8.

The Arsenal fans have seen 100 times more passes than corners.  Arsenal's 20,799 passes is surpassed only by Manchester City.  Not a great goal value to each Arsenal pass - 62 goals for 20,799 passes.  Is it any wonder Arsenal fans, like many others, might welcome a corner kick?

Record Revenue at Tottenham Hotspur

11/4/2018

 
By Robbie Butler

Last week Sky Sports published an interest article about the record revenues recently announced by Tottenham Hotspur. The piece explains the growth in Spurs' revenues and presents a table of data labelled "Tottenham financial highlights". Below I reproduce an abridged version of this and circle an interesting dimension - gate receipts.
Picture
Note: White Hart Lane did have a reduced capacity during the 2016-17 season as construction on the clubs new stadium began.
What has become apparent in recent years is the diminishing importance of gate receipts, to Premier League clubs, in the overall context of club revenue. For the vast majority of the history of football, getting fans through the turnstiles was the primary way to fund club expenditure. This is still the case for most lower league clubs but no longer the reality in the Premier League. 

In the last number of weeks, various clubs have made announcements about ticket prices for the 2018/19 season. Manchester United will freeze prices for a 7th consecutive season, and introduce further third degree price discrimination, by charging a lower price to 18-25 year age bracket, in an attempt to improve the atmosphere at home games. This is on the back of a general reduction across all clubs, of about 33%, during the 2016-17 Premier League season.

In an era of record club revenues this might come as a surprise. The graphic above should help explain the apparent contradiction (ironically this is not the case for Tottenham).

Ticket revenues are dwarfed by broadcasting deals today. Reducing ticket prices, or at a minimum freezing prices, has high impact in terms on public perception. In fact, the television spectacle is greatly enhanced by full stadiums. The fans are a major reasons why the Premier League has become so exportable globally.

​If broadcasting revenues continue to climb, local supporters should see further reductions in ticket prices, where television viewers effectively subside the club's core fan base. 

Negative Signals & The Length of Unemployment

9/4/2018

 
By David Butler

Mark Hughes recently returned to employment to take up the Southampton job. Some weeks earlier Garry Monk was appointed manager of Birmingham City. Both were sacked earlier on in the season.

There's always lots in the press about the managerial merry-go-round from the demand-side (a club seeking out a Sam Allardyce, Tony Pulis, Alan Pardew, Roy Hodgson etc. to save the day). Hughes and Monk's appointments made me think about the supply-side a little more. Namely, the pressure manager's face to resume a career when laid off. Over the course off their managerial careers Hughes has spent 3 months off on average between jobs while Monk has only had 2 months off between jobs.

The hunch is that a managers duration of unemployment will affect their prospect of re-entering the labour market. Perhaps the probability of gaining a new job will decrease after some critical threshold? In economic parlance, the duration of unemployment may be a signal to clubs looking to appoint a new boss. Simply put, a chairperson may ask…”if you haven’t been good enough for anyone else over X number of months, why are you good enough for me?”.

Perhaps managers may even withdraw from the labour market completely after failing to find a new club after a critical number of days.

Alan Curbishley comes to mind. He has been pretty much exiled since leaving West Ham United. In his own words in a 2016 interview with the Independent he recalls how  “I was getting [offers from] clubs that were in trouble in the Premier League but I was waiting for the club that I thought was going to be right for me. One did come along and I thought I had it; I met the club three times. I never got it. Someone came in at the end and got the job. I basically lost my enthusiasm for it.”

He goes on to say “You do have to get back in as soon as you can, a bit like Alan [Pardew] when he went to Southampton, he suddenly ended up at Newcastle. I did think after the problems I had at West Ham, I wanted to make sure my next job was right for me and it never happened. And now I don’t think there’s any way back really but we’ll have to wait and see.”

It might be worth remembering that both demand and supply keep the merry-go-round going. The incentives for managers to remain relevant are strong.

Professor Bill Gerrard Lecture

8/4/2018

 
Bill Gerrard, Professor of Business and Sports Analytics, Leeds University Business School will be in UCC this Wednesday (11th of April) to present a paper called “Analysing Defensive Effectiveness in the Invasion-Territorial Team Sports: Some Perspectives from Football and Rugby Union”. The presentation will start at 12 noon in Aras na Laoi 2.15.

Bill has worked as the data analyst in the Aviva Premiership for Saracens (2010 – 2015) and currently London Irish (2017 - ). In addition, he has worked as a data analyst for AZ Alkmaar in Dutch football since 2014.

All are welcome.

    Archives

    March 2023
    February 2023
    January 2023
    December 2022
    November 2022
    October 2022
    September 2022
    August 2022
    July 2022
    June 2022
    May 2022
    April 2022
    March 2022
    February 2022
    January 2022
    December 2021
    November 2021
    October 2021
    September 2021
    August 2021
    July 2021
    June 2021
    May 2021
    April 2021
    March 2021
    February 2021
    January 2021
    December 2020
    November 2020
    October 2020
    September 2020
    August 2020
    July 2020
    June 2020
    May 2020
    April 2020
    March 2020
    February 2020
    January 2020
    December 2019
    November 2019
    October 2019
    September 2019
    August 2019
    June 2019
    May 2019
    April 2019
    March 2019
    February 2019
    January 2019
    December 2018
    November 2018
    October 2018
    September 2018
    August 2018
    July 2018
    June 2018
    May 2018
    April 2018
    March 2018
    February 2018
    January 2018
    December 2017
    November 2017
    October 2017
    September 2017
    August 2017
    July 2017
    June 2017
    May 2017
    April 2017
    March 2017
    February 2017
    January 2017
    December 2016
    November 2016
    October 2016
    September 2016
    August 2016
    July 2016
    June 2016
    May 2016
    April 2016
    March 2016
    February 2016
    January 2016
    December 2015
    November 2015
    October 2015
    September 2015
    August 2015
    July 2015
    June 2015
    May 2015
    April 2015
    March 2015
    February 2015
    January 2015
    December 2014
    November 2014
    October 2014
    September 2014
    August 2014
    July 2014
    June 2014
    May 2014
    April 2014
    March 2014
    February 2014
    January 2014
    December 2013
    November 2013
    October 2013
    September 2013
    August 2013
    July 2013

    About

    This website was founded in July 2013.

    RSS Feed

    Categories

    All
    American Football
    Athletics
    Baseball
    Basketball
    Behavioural Economics
    Boxing
    Broadcasting
    Competitive Balance
    Cricket
    Cycling
    Darts
    David Butler
    Declan Jordan
    Drugs
    Ed Valentine
    Epl
    Esports
    Expenditure
    F1
    Fifa World Cup
    Finances
    Funding
    Gaa
    Gaelic Games
    Gambling
    Game Theory
    Gary Burns
    Geography
    Golf
    Greyhound Racing
    Guest Posts
    Horse Racing
    Impact Studies
    John Considine
    John Eakins
    League Of Ireland
    Location
    Media
    Mls
    Mma
    Olympics
    Participation
    Paul O'Sullivan
    Premier League
    Regulation
    Research
    Robbie Butler
    Rugby
    Simpsonomics
    Snooker
    Soccer
    Spatial Analysis
    Sporting Bodies
    Stephen Brosnan
    Swimming
    Taxation
    Teaching
    Technology
    Tennis
    Transfers
    Uefa
    Ufc
    World Cup
    Wwe

Related

The website is not formally affiliated to any institution and all of the entries represent the personal views and opinions of an individual contributor. The website operates on a not-for-profit basis. For this reason we decline all advertisement opportunities. 

Contact

To contact us email sportseconomics2013@gmail.com or find us on Twitter @SportEcon.