The Economics of Sport
  • Sports Economics
  • About
  • Workshop
  • Selected Publications
  • Book Reviews
  • A Primer on Gaelic Games
  • Upcoming Events
  • Media
  • Education
  • Resources & Links
  • Data

Money In The Pipeline

28/2/2020

 
By Ed Valentine
 
First money, then trophies, then money again. The endless race for revenue and silverware in sport reached a shock moment with UEFA handing out a two-year European Competition ban to Man City. The estimated revenue loss across the two seasons is somewhere in the region of €500 million. It’s a lot. A figure which would do serious damage to most clubs.
 
Most clubs are not owned by sovereign investment funds which, amid the private jets and 18ct gold toilets, have become football’s new best friends in the last 10 years. The Qatari Investment Authority, Abu Dhabi Group and Gazprom neatly make up the new hyper brand power club signatories across European football.
 
Gazprom is an interesting case. A gas extraction company who are majority owned by the Kremlin have been very aggressive in acquiring a presence in football and currently own Zenit St Petersburg, Red Star Belgrade plus provide lucrative sponsorship to Schalke and Chelsea as well as the UEFA Champions League and The FIFA World Cup. That’s significant money to promote a product which fans cannot buy. Why is that?
 
Russia supplies gas to much of Eastern Europe with several pipelines passing through its neighbours. Western European countries have started to phase out nuclear and coal power with gas being the prime replacement. Some of Russia’s gas pipes pass through Ukraine where skirmishes have broken out in the past decade. The Western European market represents an important goal in Gazprom’s expansion. In order to secure supply and avoid the pass-through tariffs charged by its neighbours Russia has engineered the Nord Stream pipeline which bypasses Eastern Europe and connects directly into Gelsenkirchen – the area where Schalke is based. In essence Zenit and Schalke are at opposite ends of this pipeline. Pumping money into football will help with brand perception.
Picture
It’s easy to see why football teams represent exciting investment opportunities, the brand growth and financial returns, regardless of success, may provide sovereign fund groups with additional cash streams to help plug the hole left by future dried up liquid gas fields. The game of 2 halves is now a game of 2 matches, as the teams do battle on the pitch, the investment funds do battle across the sporting brandscape.
 
You cannot buy tradition but with revenues high in the billions the next headline Sovereign sporting investment won’t be too far away. Whilst the surplus capital has to find something to do, we can hardly expect the petro gas industry to just sit there mining their own business.
Measuring Distance to Swimming Pools and Outdoor Sports Facilities in Ireland

27/2/2020

 
By John Eakins

The Central Statistics Office (CSO) is Ireland's official national statistical office whose main purpose is to impartially collect, analyse and make available statistics about Ireland’s people, society and economy (more information at www.cso.ie). As well as regularly producing statistics regarding the health of the economy and related areas, the CSO is also mandated to produce reports on specific issues which can promote public discussion and have the potential to inform policy in the area.

One such report released at the end of November 2019 titled “Measuring Distance to Everyday Services in Ireland” analysed how close or far away people in Ireland live from everyday facilities (such as schools, hospitals, public transport and post offices) and provides insights on the differences in service accessibility at regional and local level. The report used geographical coordinates for each residential dwelling in Census 2016 and a routing algorithm to calculate the shortest distance by road from each of these dwellings to a set of everyday services (see here for more details of the publication and methodology).

Of interest to us and our readers is the fact that within this publication the CSO examines the distance to a swimming pool and outdoor sports facilities. A list of swimming pools and their coordinates were supplied to the CSO by Active Swimming Ireland while outdoor sports facilities were identified from a national mapping database developed by Ordnance Survey Ireland (OSI). All objects with the following function types were identified from the database as an outdoor sports facility: Polo ground, Athletic track, Bowling green, GAA pitch, Hockey pitch, Rugby pitch, Soccer pitch, Cricket pitch, Tennis court, Race track, Sports ground, Multiple use sports ground, Golf course, Golf links, Pitch and Putt course.

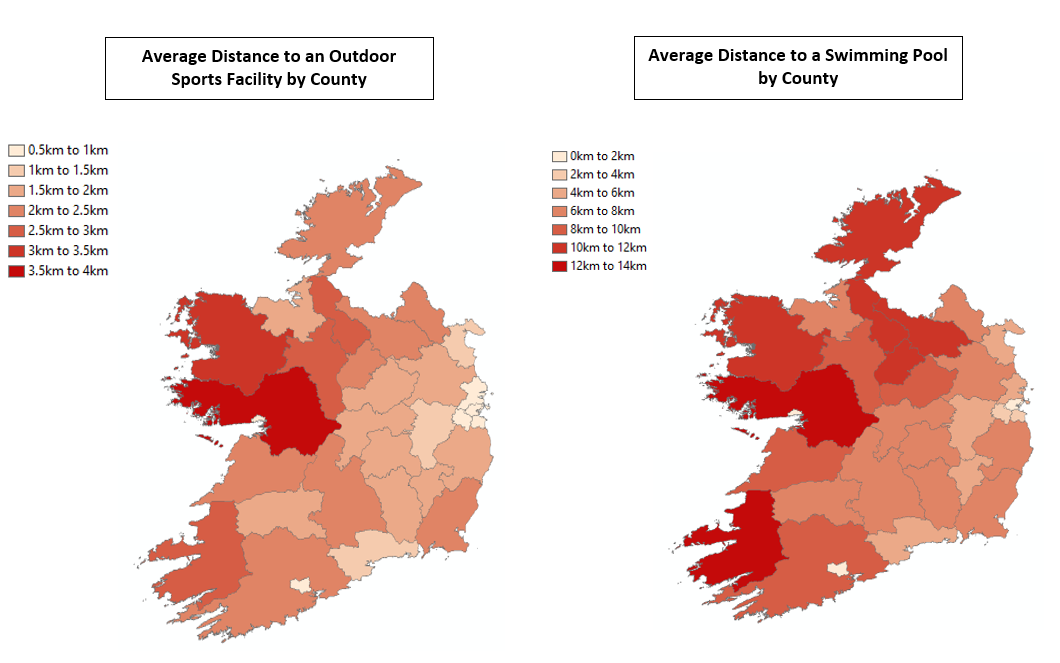
Overall, the average distance of a residential dwelling to a swimming pool is 6.3km while to an outdoor sports facility is 1.7km. Not surprisingly, average distances differ significantly by urban/rural location. For swimming pools, urban households have to travel 2.7km while rural households have to travel 12.1km. For outdoor sports facilities the figures are 0.8km and 3.1km respectively.
​
At county/local authority level, households located in Dublin City, Cork City, Galway City, Dún Laoghaire-Rathdown, South Dublin and Fingal (the last three of which are all part of the broader Dublin Metropolitan area) are the most proximate to swimming pools and outdoor sports facilities while Galway County, Kerry, Leitrim, Donegal, Cavan, Longford and Mayo are the most distant from swimming pools and Galway County, Mayo, Leitrim, Kerry and Roscommon are the most distant from outdoor sports facilities. The maps below give a visual overview of the relative proximity of each county/local authority with lighter shades reflecting closer proximity and heavier shades reflecting further proximity.
Picture
​The report also calculates the percentage of population by distance to these services, figures which are reproduced in the table below
Picture
​As can be seen, outdoor sports facilities are proximate to a greater share of the population with 94% of the population within 5km of an outdoor facility whereas only 62% of the population within 5km of a swimming pool. Obviously, these figures are biased in favour of outdoor sports facilities given the greater number of possible types of outdoor facilities that exist and it would be interesting to break down this data by the different sports represented i.e. GAA, Rugby, Soccer, Golf, etc. Something for future research perhaps.

A Concentration of Champions

25/2/2020

 
By John Considine
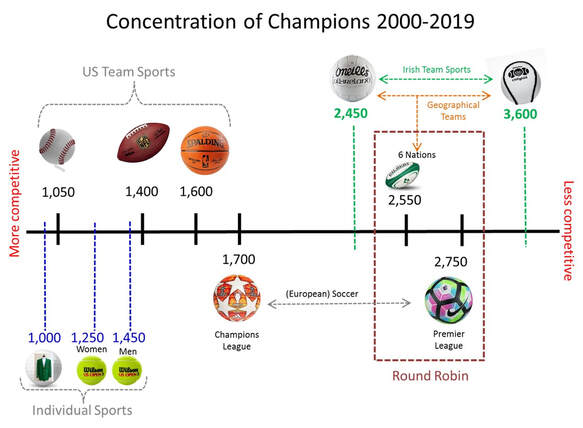
The graphic below illustrates the concentration of champions in various sports for the first twenty titles of the 21st century.  It is constructed using the Herfindahl-Hirschman Index (see below the graphic for greater detail).

There are no big surprises.

Individuals sports like golf and tennis are going to have a greater spread of champions.  There are very few Tigers.  The Masters is the most competitive competition in the graphic.  Tiger's first title in 1997 is not included.  His 2019 triumph is included.  The US Open Tennis tournaments are also at the more competitive end of the scale.  The women's tournament being more competitive than the men's tournament.

US team sports are more competitive than the UEFA Champions League.  A variety of potential explanations could contribute to this feature - including the relatively closed nature of US Major Leagues, the draft system, and the higher scoring in US sports.

US team sports and the Champions League have a league element (regular season) followed by an elimination tournament element (post-season).  On balance, the elimination tournament should give "weaker" teams a better chance.  The two tournaments with only a round-robin structure are at the less competitive end of the spectrum.  Teams play each other once in the Six-Nations rugby union competition.  The Premier League is a Home & Away format.

The teams in the Six-Nations are representative teams with no trades/transfers.  The teams and players represent their countries.  Path-dependency or tradition can play a large role in these competitions.  The Irish team sports of hurling and gaelic football are also played by representative teams (counties rather than countries).  Kilkenny have won 55% of the hurling titles.  The last five gaelic football titles (25%) have been won by Dublin.
Picture
The Herfindahl-Hirschman Index is calculated as the sum of the market shares squared.  Four countries have won the Six-Nations since 2000:  England (6); France (5); Wales (5); and Ireland (4).  England has 30% of the "market", i.e. 6 of 20 titles.  France and Wales have 25% each.  Ireland has 20% of the "market".  The HHI is 2,550 [ = (30x30) + (25x25) + (25x25) + (20x20) ].

Successful Sports Seminar in Skellig CRI

24/2/2020

 
A great night in Kerry.  Thanks to all who contributed to this successful event in a wonderful location.
Picture

Sports Economics in Cork on Tour

21/2/2020

 
By Robbie Butler

We are in beautiful South-West Kerry this afternoon and will bring our second sports economics event on to the Ring of Kerry at Caherviceen Library.

Among other things, the town is famous for being the birthplace of Irish political heavyweight Daniel O'Connell. O'Connell was the preeminent force in Irish politics during  the first half of the 19th century, campaigning for Catholic emancipation and a repeal of the Acts of Union which combined Great Britain and Ireland. In 1829 he achieved Catholic emancipation in Ireland and is today often referred to as simply The Liberator or The Emancipator. 

Fittingly, our event today has a uniquely Irish theme and considers economic, social and sporting issues in Gaelic Games. Throw-in is at 4.30pm and all are welcome. 

The Youngest In Ages

18/2/2020

 
By Ed Valentine

Close to 2pm every Saturday the football media rises to a chorus of pings generated by the landing of team sheets from the ether into the virtual timelines of the web. It’s generally followed by commentary on who’s in and who’s on the bench for the afternoon’s games with individual “big name” players who miss out on starting which generates the pre-match waffle. Very little attention is given however to the overall collective team selections over the course of the season. Below data is presented to give some insight on current trends in the Premier League 2019/20.
 
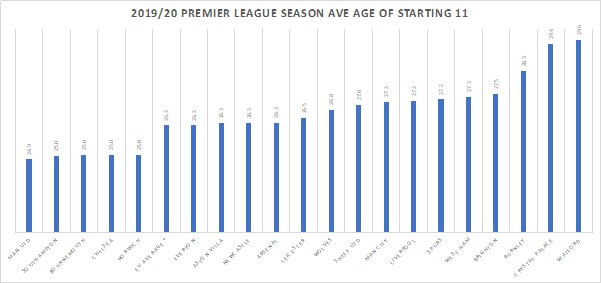
One team selection which did gain much criticism was Liverpool’s starting xi for the FA Cup replay against Shrewsbury Town. Despite The Red’s virtually unbridgeable points gap, Jurgen Klopp decided to take advantage of the winter break by fielding a team with the average age of 19yrs 102 days. This selection, in terms of age, is a clear outlier in terms of topflight men’s senior professional football. But by how much?
 
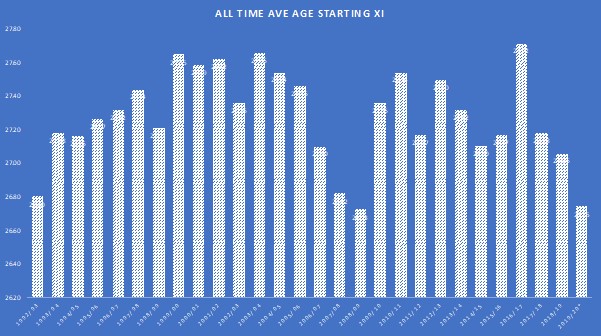
Analysis of season so far numbers shows the average age of Premier League starting xi is decreasing. Though this season’s figure has not surpassed the all-time low set in 2008/09, fans have seen 5 teams with line ups averaging 25yrs or less, an unprecedented event in the Premier League.
Picture
 There is no correlation between age of players on the pitch and more favourable numbers for shots, possession, distance run or any other key metrics. Younger players in midfield and defence generally have more positive possession turn overs (winning the ball back) than older players but the difference is not significant. What could be driving managers to select players of lower age is the speed of the game, distance covered per game and the ability of younger players to recover quickly from multiple matches per week.
Picture
​Perhaps Ed Woodward has swapped sabermetrics for age-metrics given that Ole Solskjaer’s team selections this season have been the youngest in the league and occupy 5 of the 10 youngest starting XI’s in the EPL. Watford, at the opposite end of the table, are pushing 30.  At 36 years old Ben Foster must feel like the designated driver of the Premier League.  Perhaps the Hornet’s team selection is based on who owns the most Elton John LPs in their record collection.

Does Your Telly Know You’re Here?

14/2/2020

 
By David Butler

The League of Ireland restarts tonight with the first four fixtures of the 2020 season kicking-off between 7.45pm and 8.00pm. Wolves and Leicester will battle it out for the Champions League places in the Premier League from 8.00pm also. This will be broadcast on BT Sports (a premium subscription channel in Ireland and the UK).

Competing against the Premier League, albeit a relatively rare event now given our February to October calendar, is often suggested as a reason why League of Ireland attendances may stagnate.

The argument goes that high-quality football on television changes the opportunity costs for fans. They could be disincentivised from supporting a local team when a high-quality substitute exists on TV.

I’ll leave the morals of what football supporters ought to do to the fans who penned and sing the lyrics to the chant that makes up this entry's title. The empirical question however - whether conflicting Premier League matches on TV impact League of Ireland attendance? - is something I can offer some insight on. 

Research that Robbie Butler, Ewan Mullane and I are currently working on would suggest that there is no relationship between Premier League broadcasts and League of Ireland turnouts. Looking at attendance data from the 2018 and 2019 League of Ireland season, we find no statistical relationship between turnout and whether a match clashes with a Premier League broadcast (controlling for a range of other factors).  

Although we don’t compete with Premier League broadcasts very often, the evidence suggests that when we do, this doesn’t statistically impact the turnout here. There is two ways of looking at this. First, you could say this is good news – Irish clubs don’t have to worry about competing with televised Premier League matches.

On the other hand, televised Premier League not acting as a substitute may point to the fact that fans do not see the two types of football as interchangeable.  Maybe this is the worrying implication. At least if these Premier League broadcasts were taking fans away from the turnstiles, the league could behave strategically, altering scheduling or running promotions. I think the task of convincing consumers that both ‘products’ are substitutes is the challenging task.  At present the quality differential between the Premier League and the League of Ireland means that this may not enter the consumers mind.

2020 Sports Economics Workshop

13/2/2020

 
By Robbie Butler

The 6th annual workshop on sport and economics will take place on Friday 22nd of May 2020 at University College Cork.

The event will have a dedicated session on sports broadcasting. The full schedule will appear in early April.

This event is funded by Cork University Business School and the College of Business and Law at University College Cork.

Is The Golf Tour Duopoly In Trouble?

12/2/2020

 
By Robbie Butler,

When teaching undergraduate students’ introductory economics, I speak about different market structures at an early point. The classification of these, from perfect competition at one extreme to monopoly at the other, is aided by using examples. Sport can help here. There are many examples of sports operating as “monopolies”. For example, The International Olympic Committee has a monopoly right on the sale of the Summer and Winter Olympic Games. They use this power to maximise their position with would-be-host cities.

The Major League Baseball has an effective monopoly of professional baseball in the United States. It administers the 15 teams in the National League (NL) and 15 in the American League (AL). MLB also oversees Minor League Baseball, which comprises 256 teams affiliated with the major league clubs. The owners of these franchises often operate as a monopsony - a market situation in which there is only one buyer – and use their power to maximise their welfare.

The next step from monopoly is a duopoly - a situation in which two suppliers dominate the market for a commodity or service. Golf can provide a nice illustration of this. While not a perfect representation of an industry with just 2 suppliers, the PGA Tour based in the United States and PGA European Tour are an effective duopoly. There are other professional tours (the Japan Golf Tour or the Southern Africa–based Sunshine Tour) but few can compete in money terms with the US or Europe. For example, the top golfer in Japan would rank about 40th in European Tour money standing. The leading US player earns about 3 times are much as those in Europe.

The power of the PGA Tour and European Tour has worked well for decades. However, change may be afoot with recent talk of the Premier Golf League. This would involve the worlds best players in the US and Europe, creating their own tour of about 48 players, and playing weekly competitions over 54 rather than 72 holes. Leading players have suggested that they do not play each other outside of the 4 Majors and the Player’s Championship (5 events in total) and that there is demand for more frequent battles between the world’s best.

Both current tours could not be impressed. This is not dissimilar to a decision by 22 English Football Clubs in the early 1990s who decided to break away from an administrator founded in 1888. The English Premier League was born, and the rest is history.

It may be that case that the duopoly of golf is coming to an end. If the Premier Golf League is successful the supply of professional golf will not be the same again.

The Blades and Moneyball

10/2/2020

 
David Butler

Before Christmas and back last April I wrote about the Sheffield United story. Chris Wilder’s approach has been to largely source talent from the UK and Republic of Ireland talent pool. The signing of Sander Berge recently was a rare departure from their past strategy. Of course, budget limitations may have been the source of this strategy and with the Blades having virtually secured their Premier League position for next year, the purse strings may have been loosened.

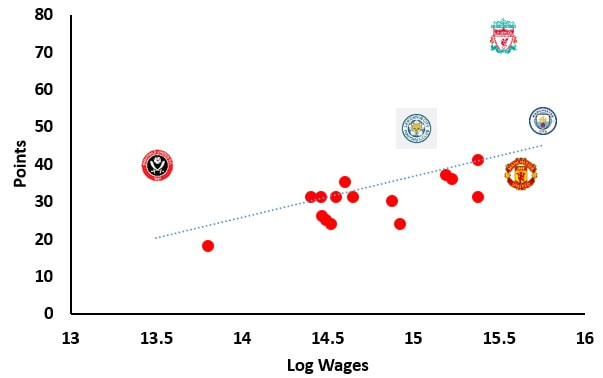
After yesterdays win Sheffield United are two points off the top 4 with an extra fixture played.  Wilder’s side are going closer to  'doing a ‘Moneyball', right’? 

The chart below shows the relationship between total points and average annual salary by club. This is sourced from talksport via a sport intelligence survey (take from it what you will)

Sheffield United have the lowest average player salary in the league (£728,000). To stick to the Moneyball rhetoric, they appear to be “buying wins at a discount”.  
Picture
<<Previous

    Archives

    March 2023
    February 2023
    January 2023
    December 2022
    November 2022
    October 2022
    September 2022
    August 2022
    July 2022
    June 2022
    May 2022
    April 2022
    March 2022
    February 2022
    January 2022
    December 2021
    November 2021
    October 2021
    September 2021
    August 2021
    July 2021
    June 2021
    May 2021
    April 2021
    March 2021
    February 2021
    January 2021
    December 2020
    November 2020
    October 2020
    September 2020
    August 2020
    July 2020
    June 2020
    May 2020
    April 2020
    March 2020
    February 2020
    January 2020
    December 2019
    November 2019
    October 2019
    September 2019
    August 2019
    June 2019
    May 2019
    April 2019
    March 2019
    February 2019
    January 2019
    December 2018
    November 2018
    October 2018
    September 2018
    August 2018
    July 2018
    June 2018
    May 2018
    April 2018
    March 2018
    February 2018
    January 2018
    December 2017
    November 2017
    October 2017
    September 2017
    August 2017
    July 2017
    June 2017
    May 2017
    April 2017
    March 2017
    February 2017
    January 2017
    December 2016
    November 2016
    October 2016
    September 2016
    August 2016
    July 2016
    June 2016
    May 2016
    April 2016
    March 2016
    February 2016
    January 2016
    December 2015
    November 2015
    October 2015
    September 2015
    August 2015
    July 2015
    June 2015
    May 2015
    April 2015
    March 2015
    February 2015
    January 2015
    December 2014
    November 2014
    October 2014
    September 2014
    August 2014
    July 2014
    June 2014
    May 2014
    April 2014
    March 2014
    February 2014
    January 2014
    December 2013
    November 2013
    October 2013
    September 2013
    August 2013
    July 2013

    About

    This website was founded in July 2013.

    RSS Feed

    Categories

    All
    American Football
    Athletics
    Baseball
    Basketball
    Behavioural Economics
    Boxing
    Broadcasting
    Competitive Balance
    Cricket
    Cycling
    Darts
    David Butler
    Declan Jordan
    Drugs
    Ed Valentine
    Epl
    Esports
    Expenditure
    F1
    Fifa World Cup
    Finances
    Funding
    Gaa
    Gaelic Games
    Gambling
    Game Theory
    Gary Burns
    Geography
    Golf
    Greyhound Racing
    Guest Posts
    Horse Racing
    Impact Studies
    John Considine
    John Eakins
    League Of Ireland
    Location
    Media
    Mls
    Mma
    Olympics
    Participation
    Paul O'Sullivan
    Premier League
    Regulation
    Research
    Robbie Butler
    Rugby
    Simpsonomics
    Snooker
    Soccer
    Spatial Analysis
    Sporting Bodies
    Stephen Brosnan
    Swimming
    Taxation
    Teaching
    Technology
    Tennis
    Transfers
    Uefa
    Ufc
    World Cup
    Wwe

Related

The website is not formally affiliated to any institution and all of the entries represent the personal views and opinions of an individual contributor. The website operates on a not-for-profit basis. For this reason we decline all advertisement opportunities. 

Contact

To contact us email sportseconomics2013@gmail.com or find us on Twitter @SportEcon.