The Economics of Sport
  • Sports Economics
  • About
  • Workshop
  • Selected Publications
  • Book Reviews
  • A Primer on Gaelic Games
  • Upcoming Events
  • Media
  • Education
  • Resources & Links
  • Data

Maynard, Mythology and Moyes

31/3/2014

0 Comments

 
By Robbie Butler

In 1929 the Great Depression changed the face of economics. The Classical doctrine which had pervaded the subject, almost unopposed since 1776, shuddered to a grinding halt. In the years that followed the market failed to clear. Savings and investment did not equilibrate. British economist John Maynard Keynes, whose popularity had soared during the 1920s following publication of his
Economic Consequences of the Peace, was not immune to this criticism. In response to changing his position on monetary policy, Keynes is alleged to have said “When my information changes, I alter my conclusions. What do you do, sir?” This was later paraphrased to the more popular "When the facts change, I change my mind. What do you do, sir?"

On the 9th of May 2013 it was announced that David Moyes would become manager of Manchester United. In order to avert possible early instability, the Old Trafford hierarchy offered the former Everton boss a six year contract. A classic example of what economists refer to as a commitment mechanism; a freely made decision designed to constrain oneself in the future. 

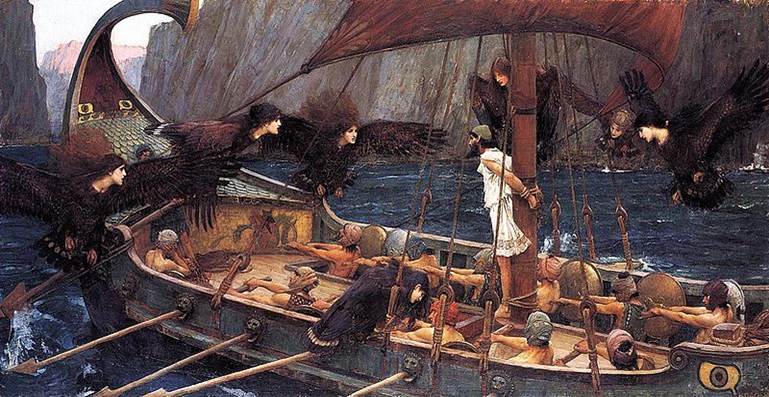
One of the most famous examples of this is the pact Ulysses made with his sailors, as they approached the Sirens of Anthemoessa.  Ulysses desired to hear the Sirens' song. However, he knew that doing so would render him incapable of rational thought. To avoid this, he poured bees wax into the ears of his sailors rendering them deaf, and proceeded to tie him to the mast of his ship so that he could not jump overboard upon hearing the song. He ordered his sailors not to change course and to stay armed in case he should break free. When Ulysses heard the Sirens’ song legend has it that he was driven momentarily mad and tried to break free of his bonds. However, his commitment mechanism worked and he escaped harm.
Picture
Maybe the same will be true at Old Trafford. Maybe David Moyes will come good during the course of the next five and a bit seasons.
 
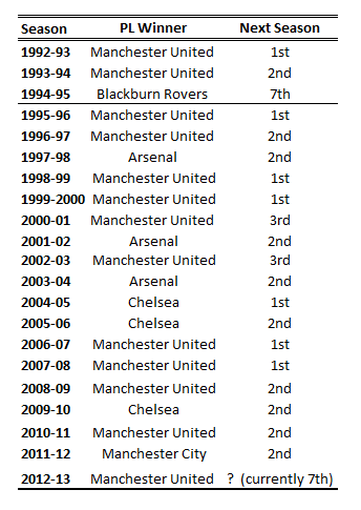
Unfortunately, for Manchester United a lot has changed since David Moyes took over. United will not be playing in the Champions League next season (unless they win the trophy this year). The champions could equal Blackburn Rovers' record of the worst defense of a league title (7th place finish). In fact, the manager’s former team (Everton) could finish above the Red Devils for the first time in Premier League history. Home form has been appalling and a growing number of senior players now seem set to leave the clubs. One year on, Old Trafford looks a very different place.
 
A year ago, David Moyes was considered a positive appointment by most. Since then the many of the facts have changed. Keynes would probably have changed his mind on Moyes’ appointment. Will the board do the same? 
0 Comments

Man Utd's Fall From Grace

29/3/2014

 
By David Butler

The
stats would suggest that it is highly unlikely that Manchester United will finish in the top four this season. This is definitely a fall from grace given the club's past successes. What shocks most is usually not that the club has taken backward steps after the loss of Alex Ferguson but rather how quickly they have lost competitiveness.

Below is a table that shows how teams faired the season after winning the Premier League title.  For the most part teams that have won the title offer a strong challenge the following season too, often retaining the trophy. Only once was a Premier League winner outside of the top three the season after – Blackburn were 7th in the 1995-1996 season after topping the pile the year before. If things remain as they are this season David Moyes’ side will replicate this
feat.  

Historically speaking winning the league doesn't just have repercussions for that season, approx 85% of the time the winning team come back to win it or are runner up the season after too. Which, of course, makes sense and is just another stat that doesn't do Mr.Moyes any favours.

Picture

Incentives matter - Bonus points in rugby and what could have been for Leinster

28/3/2014

0 Comments

 
by Declan Jordan
Picture
The recent Six Nations Championship have raised a number of issues around how sports bodies set up rules to incentivise behaviour and actions by teams. It has also brought into focus whether final round matches should be played simultaneously or not to avoid giving an advantage to teams playing the final game. This latter advantage is less clear cut I think than it may seem since having a points target to hit (over and above winning the game) may impose greater stress and pressure on a team than not knowing a specific target. How stressful would it have been last Saturday evening for Irish rugby supporters and the team if Ireland needed to chase a 5 or 10 point victory.

However, in this post the focus is on how the structure of the championship and the rules fr determining who are the champions incentivises particular behaviour. Sports bodies are no strangers to tinkering with regulations (sometimes with perverse outcomes) to encourage participants to do certain things or to indicate what is 'valued'. Economists are very familiar with the idea of using incentives to change behaviour. In football the points awarded to winning teams went from 2 to 3 to change the relative value of attacking play. In a previous post on the League of Ireland I looked at the change from choosing among teams on the same points based on goal average to goal difference. Also, the league also once tested the effect of awarding 4 points for an away win, 3 for a home win, 2 for an away draw and 1 for a home draw. 

Rugby has at different times awarded different points for tries (initially it was worth less than a penalty or drop goal). However the value of a try relative to a penalty has increased to 5:3 (since 1993) from 4:3. This is before the propsect of an additional 2 points for a try conversion is considered. This has increased the relative value of a try compared to other ways of scoring. Presumably this is intended to encourage teams to seek tries, improving the game for spectators. 

How sports bodies frame incentive structures can determine the behaviour of participants and so encourage particular types of play. Also, sports bodies need to find ways that allow them determine a winner when participants are level after 'regulation' play. Examples include tie-breaks in tennis, penalty shoot-outs and away goals rules in soccer and overtime in American football.

In European rugby union there are two approaches used to determine the winner of a 'league' when teams are tied on points. In the Six Nations Championship points difference is used (similarly to football's goal difference). In the Heineken Cup the winner of a pool is determined by the number of points, then, if that is the same, the number of points in the games between the teams and then the number of tries scored by each team. Points difference is quite a bit down the list of criteria. The rules are available here. There is another difference between the Heineken Cup and Six Nations Championship in that the latter provides a bonus point if a team scores four or more tries in one game and one bonus point if a team loses by 7 points or less. The intention is to reward try scoring teams and also to encourage teams to maintain effort even if they are likely to lose a game.

The lack of bonus point system in the Six Nations is curious. The excuse usually given for its absence is that teams do not have home and away fixtures like in the Heineken Cup and bonus points could give an unfair advantage to teams with more home games. A previous post referred to this advantage. However, it is likely that a points difference rule also gives an advantage to teams with more home games if a team is more likely to win home matches.

The tables below show what the outcomes would have been in the 2014 Six Nations Championship and the pool stages of the Heineken Cup if both systems were applied in each case. There is no change in the Six Nations outcome. Perhaps it's notable how few bonus points are won. On only three occasions did a team score four tries or more - twice it happened against Italy. Would bonus points improve this number?

Picture
For the Heineken Cup the six pool winners and best two runners up qualify for the knock-out quarter final. The top four teams get home advantage for the quarter final game. This is a significant benefit. The ranking is based on winning points. The teams are set out in their actual final rank. Interestingly the top team and the two best runners up came from groups with Italian opposition (T stands for Treviso and Z stands for Zebre). This is a benefit for teams as the top sides would look to get 2 winning bonus points from games against Italian opposition.

Using the Six Nations approach of deciding rank based on winning points (stripping out bonus points) and then on points difference gives a somewhat different outcome. The top 3 teams in that case are all Irish. Leinster go from sixth (and an away game against Toulon) to second and a home game against Saracens. Munster would move from fourth to third. Clermont and Toulon would both lose home advantage.
Picture
0 Comments

Cricket: To bat or not to bat – that is the question

27/3/2014

 
By John Eakins
Picture
Cricket has got its detractors mainly because it’s viewed as being a boring game with rules and terminology that are difficult to grasp. Not so however with Twenty20 cricket, a shorter version of the game that is easier to understand and more importantly is much more exciting (although cricket purists would probably argue differently).  In Twenty20 cricket each team bats for a maximum of 20 overs (an over consisting of 6 balls) with the winner being the team that posts the most runs. Because the objective is to score as much runs as possible in a limited amount of overs, a lot more happens in Twenty20 cricket compared to Test cricket and One Day International (ODI) cricket. In Twenty20 cricket there is a much higher scoring rate with more 4’s (a shot that reaches the boundary) and 6’s (a shot that clears the boundary), more wickets are taken and you also have closer and more exciting finishes. For some evidence of this you can look no further that the International Cricket Council (ICC) World Twenty20 that is currently taking place in Bangladesh. You can find highlights here.

One would wonder where the relationship between cricket and economics is but cricket can essentially be summed up as a game of strategy. You have the bowler and the batter who, similar to a penalty taker and goalkeeper, have to guess what each other’s strategies will be. There is also the captain’s strategy as to the best way to position his field in order to limit the amount of runs that the batsman can take or to try and get the batsman to make a shot that will get him out. Another interesting facet of the game is the toss at the beginning of the game between the two captains. The captain that wins the toss can decide to bat first or second. As opposed to most other the games, the toss in cricket is seen as an important determinant of the outcome of the game as factors such as the condition of the playing surface or even weather may give a distinct advantage to a team batting first or second. 
 
Recently published research in the Journal of Sports Economics by Abhinav Sacheti, Ian Gregory-Smith and David Paton (here) has looked at this in more detail using data from international Twenty20 cricket matches. Contrary to the perceived wisdom, they find little evidence to suggest that winning the toss or choosing to bat first improves the likelihood of winning. More interestingly however they argue that the captain’s choice after winning the toss may be influenced by social pressure resulting in incorrect judgements of how the game will play out. The “irrational behavior of captains may be because captains are making batting order choices that shield them from media criticism” pg 17. They further suggest that a potential cause of this irrational behaviour is the competitive nature of international cricket matches and thus paradoxically if competition is reduced more rational behaviour could be created. They also make the analogy between this and the decisions made by stock market investors and corporate managers and their potential irrational behaviour in making decisions based on market sentiment rather than in the best interests of the  client.

Life After Brian O'Driscoll

26/3/2014

1 Comment

 
By John Considine
The world's most capped rugby international, Brian O'Driscoll, played his last Irish game on Saturday 15th March 2014.  ESPN present his career in statistics (here).  It reads: Appearances 141, Tries 47, Drop-goals 5, Points 250, Wins 82, Loses 57, Draws 2, Win rate 58.86%.  If we limit the analysis to the Five/Six Nations tournament then the win rate climbs to 70%.  That 70% can be compared to the 40% win rate Ireland had in the 2012 Six Nations when O’Driscoll was missing due to injury.  It seems fair to suggest that O’Driscoll will be missed.
Picture
Two papers in economics would also suggest that O’Driscoll will be missed.  The Quarterly Journal of Economics published a paper called ‘Superstar Extinction’ in 2010.  The paper by Pierre Azoulay, Joshua Graff Zivin and Jialan Wang examined the output of academics when a collaborating superstar died.  The authors examined the changes in research output for collaborators of 112 eminent scientists who dies suddenly and unexpectedly.   They found that there was a 5% to 8% decline in the quality-adjusted publication rates.  While O’Driscoll’s retirement was neither unexpected nor sudden, the fear must remain that a similar drop in quality-adjusted play might follow.

The second paper of interest was published in the American Economic Review in 2009. Alexandre Mas and Enrico Moretti examined peer effects in the workplace.  The workplace was a large supermarket chain and the workers were cashiers.  Mas and Moretti found positive productivity spillovers from the introduction of highly productive personnel into a shift.  They also found that the productivity spillovers were limited to those who could see the highly productive worker.  For example, a productive cashier introduced into aisle 13 had an impact on 12 and 14.  If we translate this into rugby then O’Driscoll’s productivity in the number 13 shirt should have rubbed off on people like Gordon D’Arcy (12) and Andrew Trimble (14).

The Gordon D’Arcy example is also relevant for another finding by Mas and Moretti.  O’Driscoll and D’Arcy have been the most capped centre-pairing in international rugby.  They also play together in Leinster.  Mas and Moretti found that cashiers respond more to the presence of colleagues with whom they frequently interact.  Maybe Gordon should be  doing his best to get Brian to reconsider a return to the Irish shirt.  Even allowing for the sentimentality, a player who received the man-of-the-match award in each of his last two games must have something left to offer.

1 Comment

Jerry Kiernan on the GAA Getting Public Funds

26/3/2014

 
Yesterday, Shane Coleman (NewsTalk) interviewed Jerry Kiernan.  The ten minute interview can be heard here.  It is thought provoking and worth a listen.  The Score was quick out of the blocks with a piece on it here.  The Irish Examiner and The Mirror also carried related stories (here and here).

Racing Expectations

25/3/2014

 
By Ed Valentine

The excitement of a fascinating season opening Grand Prix in Melbourne was silenced by the loud noises made by fans concerned by the sound made from the new F1 power units. The change in engine noises didn’t affect Nico Rosberg who cruised to a 24 second victory over Red Bull’s Daniel Ricciardo (later disqualified for a fuel sensor infringement).The mood coming from the paddock suggests that Mercedes had plenty in reserve
and had they wished could have won the race by well over a minute.
Picture
In absolute pace terms just how much quicker was Rosberg than everyone else?

This  table demonstrates the fastest single lap for each of the top eight drivers. Although Nico won by nearly half a minute, and had his 5.8 second lead wiped out on Lap 12 with the introduction of the safety car, he was lucky to have enjoyed such a walk in the park.

Rosberg stopped on Lap 12, just as the safety car was called and set his quickest lap 7 laps later. Bottas, who was stuck in traffic for most of the race whilst on a recovery drive following his collision, set his fastest lap one lap from the finish. Though it was set on a significantly lighter fuel tank, he was on tyres that were 20 laps old. The Finn was also in traffic for much of the race which cost about .75 of a second per lap against the front runners who were in cleaner air.

Picture
Australian GP Lap Comparison Nico Rosberg (grey line) vs Valterri Bottas (blue line)
The graph highlights the pace of the Williams in dry conditions. It is .2 of a second faster than the McLaren and could pose a real threat to Mercedes at Sepang this weekend which is a circuit that favours overtaking. 

Mercedes outright pace is largely due to the immature technology on the part of the other teams. This is likely to continue until the European series of races kick in at the start of May when the development race gathers pace.
 
Until then it seems the level of competitive balance in Formula 1 is still around the corner.

Home advantage matters in the Six Nations

24/3/2014

3 Comments

 
by Declan Jordan
Picture
A peculiar feature of the Six Nations Championship is that teams play each other once in the tournament and that home advantage reverts every second year. There was a lot of discussion before the 2014 Championship about whether Ireland could win in a year when they were playing England in Twickenham and France in Paris. Prior to the final game there was much made of the history of Irish games in Paris and the often quoted statistic that Ireland had won only once in 42 years there. 

This is a tournament where the outcome has been very close very often. In each of the last three years the winner has been decided on points difference, with two or more teams having finished level on winning points. This has been the case in almost every year when there hasn't been a Grand Slam winner (where a team wins all 5 of their games). The Irish still feel the pain of losing by a points difference margin of 4 points in 2007 following a last minute try conceded against Italy and a dubious try awarded by the television match official to champions France against Scotland in the final game.

Where there are such tight margins, it is likely that home advantage could be a critical factor in success. This is backed up by a look at the winners of the tournament since it was expanded to 6 teams (and 5 matches) in 2000.

Picture
The table on the right shows the Six Nations Champions since 2000 (15 seasons). There have been 8 grand slam champions - making it more common than might have been expected. On 10 occasions the champion has played 3 home games and 2 away games. This suggests there is a significant advantage in having 3 home games. All of the 5 champions that won when they had 3 away games played Italy (the tournament's weakest team) in one their away games.

This is not good news for Ireland seeking to retain their title next year as they will have two home games (against England and France) in 2015. They can maybe look to the fact that they travel to Rome for one of those away games.

It would appear that this is simply another quirky feature of the Six Nations with which countries will have to live. The only solution is to extend the calendar and play home and away games. It is hard to see how this could fit into the packed rugby calendar. The southern hemisphere has four countries participating so a home and away style league there requires just one weekend of fixtures more that the six nations.  

3 Comments

The Business Podcast

24/3/2014

 
Blog contributor Robbie Butler was interviewed by George Lee on RTE Radio 1 show The Business on Saturday. The interview can be heard here (starting at 49 minutes 20 seconds).

Injuries in Gaelic Football

22/3/2014

0 Comments

 
By John Considine
In the last couple of weeks there have been a variety of newspaper accounts of knee injuries to gaelic football players (here, here, here and here).  One knee injury has grabbed most of the headlines – it is the damage to the anterior crucial  ligament (ACL).  There seems to be a consensus that there is an increase in these injuries but there is less agreement on the exact cause of any increase.
Picture
It is possible to examine the incidence of injuries in gaelic football that are covered by the GAA injury scheme.  This information is provided in the GAA Annual Report.  Table 1 opposite presents the top-15 injury locations based on this data for 2013.  There were 4,367 gaelic football injuries in total.  Knee injuries are by far the most common injury accounting for 28.99% of gaelic football injuries.  Table 1 includes injuries in hurling for comparison purposes.   Knee injuries also dominate in hurling with almost the same  percentage of total claims on the scheme.  As might be expected, given the nature of the games, there are far more hand, finger, and  thumb injury claims in hurling.

It is important to note that the information in Table 1 is based on the GAA injury scheme.  Claims on the scheme for 2013 amounted to over €8m.  One might argue that these are the more serious injuries.  Those players covered by the scheme might have made a claim based on the seriousness of their injury.  It does not mean that knee injuries are the most common injuries in gaelic football.  Table 2 presents the top 5 injuries in gaelic football based on a 2012 paper in The American Journal of Sports Medicine.  The paper is the work of John Murphy, Edwenia O’Malley, Conor Gissane and Catherine Blake.  According to the work of Murphy et al (2012) thigh injuries account for the greatest proposrtion of injuries in gaelic football.  In their study thigh injuries accounted for 33.3% of the injuries.  Knee injuries were the second most common injury.

Picture
The American Journal of Sports Medicine paper defines an injury as “any injury that prevents a player from taking a full part in all training and match activities typically planned for that day, where the injury has been there for a period greater that 24 hours from midnight at the end of the day that the injury was sustained”.

John Murphy and his colleagues document how most of these injuries are the result of  match activity rather than training.  The incidence of injuries in gaelic football are 61.86 per 1,000 hours of match activity whereas it was only 4.05 per 1,000 hours of training activity.  They also compare these rates to those in other football codes.  They point out that the incidence of injuries in soccer training is similar to gaelic football.  However, the incidence of injury in match activity is much higher in gaelic football.

The authors point out that injury to the anterior crucial ligament (ACL) accounts for 1.5% of the injuries in their study.  The corresponding figure for Australian Football is 2.0%.  They argue that the severity of the ACL means that any intervention to reduce its incidence would be very important for the sport.  There is widespread agreement.  What is now needed is research into the causes of the ACL and potential ways of minimising the numbers suffering from it.

0 Comments
<<Previous

    Archives

    March 2023
    February 2023
    January 2023
    December 2022
    November 2022
    October 2022
    September 2022
    August 2022
    July 2022
    June 2022
    May 2022
    April 2022
    March 2022
    February 2022
    January 2022
    December 2021
    November 2021
    October 2021
    September 2021
    August 2021
    July 2021
    June 2021
    May 2021
    April 2021
    March 2021
    February 2021
    January 2021
    December 2020
    November 2020
    October 2020
    September 2020
    August 2020
    July 2020
    June 2020
    May 2020
    April 2020
    March 2020
    February 2020
    January 2020
    December 2019
    November 2019
    October 2019
    September 2019
    August 2019
    June 2019
    May 2019
    April 2019
    March 2019
    February 2019
    January 2019
    December 2018
    November 2018
    October 2018
    September 2018
    August 2018
    July 2018
    June 2018
    May 2018
    April 2018
    March 2018
    February 2018
    January 2018
    December 2017
    November 2017
    October 2017
    September 2017
    August 2017
    July 2017
    June 2017
    May 2017
    April 2017
    March 2017
    February 2017
    January 2017
    December 2016
    November 2016
    October 2016
    September 2016
    August 2016
    July 2016
    June 2016
    May 2016
    April 2016
    March 2016
    February 2016
    January 2016
    December 2015
    November 2015
    October 2015
    September 2015
    August 2015
    July 2015
    June 2015
    May 2015
    April 2015
    March 2015
    February 2015
    January 2015
    December 2014
    November 2014
    October 2014
    September 2014
    August 2014
    July 2014
    June 2014
    May 2014
    April 2014
    March 2014
    February 2014
    January 2014
    December 2013
    November 2013
    October 2013
    September 2013
    August 2013
    July 2013

    About

    This website was founded in July 2013.

    RSS Feed

    Categories

    All
    American Football
    Athletics
    Baseball
    Basketball
    Behavioural Economics
    Boxing
    Broadcasting
    Competitive Balance
    Cricket
    Cycling
    Darts
    David Butler
    Declan Jordan
    Drugs
    Ed Valentine
    Epl
    Esports
    Expenditure
    F1
    Fifa World Cup
    Finances
    Funding
    Gaa
    Gaelic Games
    Gambling
    Game Theory
    Gary Burns
    Geography
    Golf
    Greyhound Racing
    Guest Posts
    Horse Racing
    Impact Studies
    John Considine
    John Eakins
    League Of Ireland
    Location
    Media
    Mls
    Mma
    Olympics
    Participation
    Paul O'Sullivan
    Premier League
    Regulation
    Research
    Robbie Butler
    Rugby
    Simpsonomics
    Snooker
    Soccer
    Spatial Analysis
    Sporting Bodies
    Stephen Brosnan
    Swimming
    Taxation
    Teaching
    Technology
    Tennis
    Transfers
    Uefa
    Ufc
    World Cup
    Wwe

Related

The website is not formally affiliated to any institution and all of the entries represent the personal views and opinions of an individual contributor. The website operates on a not-for-profit basis. For this reason we decline all advertisement opportunities. 

Contact

To contact us email sportseconomics2013@gmail.com or find us on Twitter @SportEcon.