The Economics of Sport
  • Sports Economics
  • About
  • Workshop
  • Selected Publications
  • Book Reviews
  • A Primer on Gaelic Games
  • Upcoming Events
  • Media
  • Education
  • Resources & Links
  • Data

11 Is Prime

29/10/2019

 
By Ed Valetine,

Imagine if someone got four numbers on the lotto, where you got five, but they got the bigger prize due to some sort of anomaly? It may seem unfair, even farcical. This would never happen in reality. However, sport can occasionally serve up anomalistic situations where it is more advantageous to be the runner up or loser in the long run.

Formula One has tinkered with its qualifying set up a number of times in the last 15 years in order to create a unique set of race management issues for the drivers to juggle in the search for a more entertaining product. The product was damaged somewhat with September’s Italian GP qualifying session where 8 of the 9 drivers in the top 10 shootout failed to set a lap time due to slowing down on the out lap to avoid missing the slip stream. It raised a few questions and gave rise to talk of shaking up the qualifying format in future seasons.

The FIA, Formula One’s governing body together with the commercial rights holder Liberty Media, recently discussed introducing the idea of sprint races to determine the starting grid for the main race instead of the current qualifying format where the slowest drivers do not make it into the top 10 shootout. It might make for interesting grids and more entertaining opening race stints, but could it eliminate certain anomalies that can advantage slower cars on the starting grid?

The current format comprises a first session of 18 minutes to decide places 16-20 (the five slowest cars). These five are then eliminated with the remaining 15 advancing to Q2 where the same is done for positions 11-15. The final session lasts 12 minutes and determines the top 10 starting order with the fastest winning pole position and so on.
 
It seems straight forward. It’s not.
 
Drivers who do not make the final session e.g. 11th – 20th can choose any tyres they like to start the race on while those in the top 10 must use the tyres they set their fastest lap on in that session.
 
Typically, the 11th – 20th place qualifiers will choose brand new “option” tyres for the race with those in the top 10 likely to have set their fastest laps on “prime” tyres. Prime are the fastest available tyre compound but do not last as long and are generally quicker by half a second a lap initially in clean air but this drops off a cliff quite rapidly. In a straight fight a driver on options can expect to lose .5-.75s a lap initially however this reduces and then cuts over to a dramatic gain in performance.
 
These prime tyres will have had a lap or two in “party mode” which means all of the go faster buttons have been activated to enable ultimate performance from the car. This can damage the tyre via wear and thermal degradation resulting in a 7-8% loss in performance and life - a significant amount. Occasionally, and depending on track conditions drivers in lower positions on the grid can be ahead into turn one thanks to the advantage of newer rubber off the line.

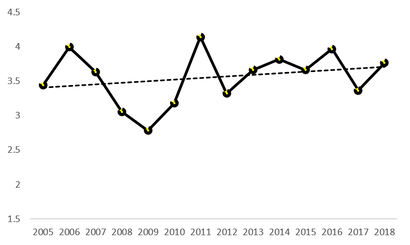
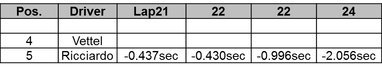
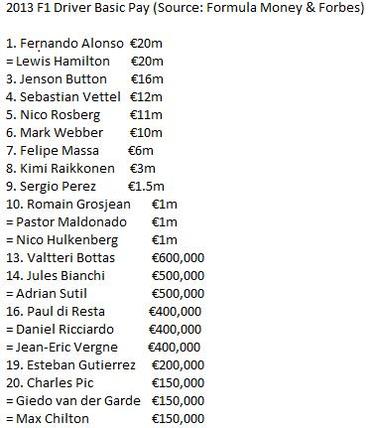
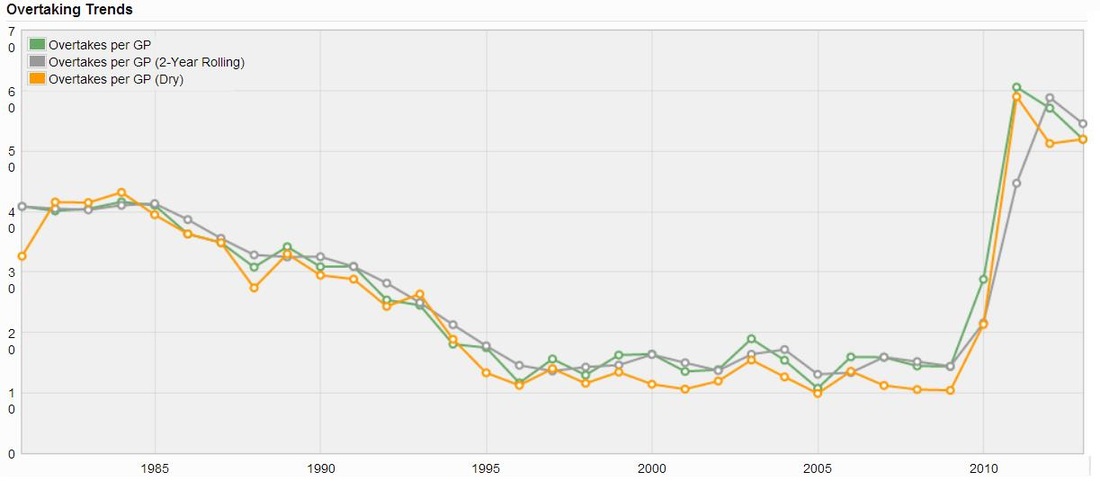
The figure and table of data aims to explain why it may be more beneficial to start from 11th place than 10th. The graphic provides points data on finishing places 9 -12. The table expands on this and show data from 1st to (in some cases) 24th position. 
Picture
Picture
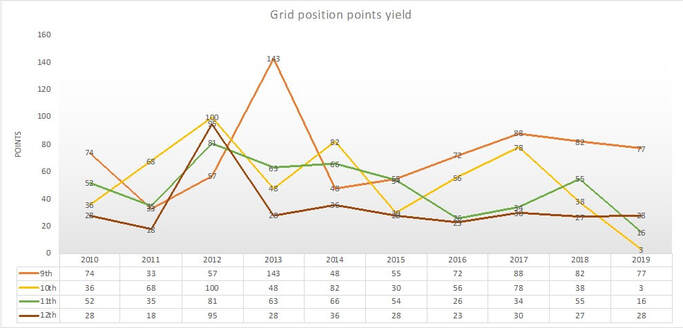
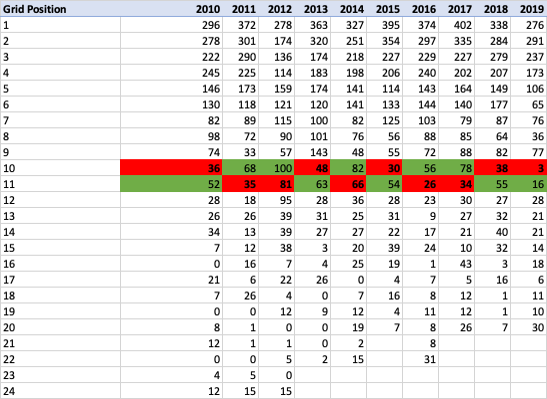
Points data over the last 10 seasons has been analysed in this table, which demonstrates that in five of these 10 seasons* (*2019 season still in progress). Drivers starting from 11th position have outscored those in 10th. It is therefore more efficient to start from 11th because it means less mileage on the engine and gearbox plus reduces the risk of an accident or mechanical failure. It all amounts to lower cost and lower risk. Remarkably this season in a points sense it is 10 times better to start from last position than 10th.
 
Another contributing factor is that the 11th place grid slot is on the same side of the grid as 1st – the clean side. That’s worth a tenth or two off the line together with newer tyres. Beginning the 1st stint of the race on new tyres and track position helps to stay ahead of “faster packaged” cars as the race develops.
 
The data demonstrates that drivers at the back of the grid tend to outscore those who start in the midfield – this can be explained by the fastest cars, once or twice a season, starting from the back of the grid due to a penalty but then scoring a high points finish on race day. It also demonstrates the value of pole position though this is skewed in the current era due to Mercedes overwhelming performance advantage.
 
The scenario could be compared to finishing 2nd in a Champions League group in order to avoid playing a stronger team in the knockout rounds. Whilst it doesn’t reward out and out performance it does reward those genuinely attempting to achieve the best result overall result in the context of the wider tournament.
 
One solution to the qualifying anomaly is to have a FIFA style starting grid draw where the positions are drawn out of a hat with some seeding worked in to ensure some fairness across the field. This really would turn F1 into a lottery.

Freight Expectations

21/10/2019

 
By Ed Valentine

Of all the places to see live Major League Baseball’s New York Yankees play against The Boston Red Sox – a classic box office fixture in the annals of bat and ball history - West Ham’s London Stadium would not be the primary venue on the list. Earlier this year MLB played, for the first time, on European soil with a 4-game series following the trend set by NFL and NBA with regular season games being contested in London.

​Whilst the flight across the Atlantic may not be the norm for American sports franchises, in logistical terms pitching their tent in Europe for a weekend or two every season is not a difficult undertaking. This can be contrasted to Formula One’s global circus where 21 of the World’s finest racetracks in the most glamorous of destination cities are visited every other weekend from March to December.
 
Th F1 circus is arguably the largest global touring sport. Thousands of tons of kit are transported across the world throughout the season with occasional back to back weekend races.  It’s a tough logistical exercise but could the current calendar be arranged to make the travel easier on teams and staff?

​Below is a table demonstrating the kilometers travelled from city to city under the current F1 schedule. 
Picture
The current calendar forces teams to clock up a total of 105,711 Km end to end with some tight turnarounds along the way. Take Race 2 to Race 3 - Sakhir, Bahrain to Shanghai, China. These are back to back Grand Prix which forces all of a team’s kit (fits into about 80 trucks) to be dismantled by the Sunday evening and flown to Shanghai and being fully operational by the following Thursday. Shanghai is 5 hours ahead and almost 7,000km away. Essentially the entire F1 paddock has to be dismantled and rebuilt on the other side of the world within 70 hours. The pit infrastructure and hospitality units are of the volume of 35 average family sized house moves per team. The aim of the game is not about packing up quickly but making sure it’s easy to reassemble at the other end. Every step has to be meticulously planned.
 
 
A quarter of the total annual distance is travelled by the 4th race weekend. The cash burn for these fly aways is easily $1million per week largely due to the travel. It must be a massive disincentive for new consortia who may want to enter the championship knowing that just to travel to work they’d be eight figures out of pocket. 

Picture
​By comparison the calendar could be arranged as per this table. The championship could begin in Europe and then move to North America. 8 rounds would be completed in the same transportation distance as the going from Melbourne to Bahrain under the current arrangement. Overall it would allow for a 40% reduction in distance travelled.
 
The limitations to this are that contractually some governments pay more to hold races at certain times of the year. Melbourne and Abu Dhabi will pay more to host the season opening and closing races than for any other slot on the calendar. In return there is the added exposure of the opening Grand Prix after a long summer break and the potential of a final race championship showdown. Monaco historically has to be in May and Silverstone marks the halfway point in the season.
 
​Formula One manages to pull this off every year without a hitch. There are lessons to be learned for global supply chains from F1’s collaborative freight management systems. I bet they even manage to keep within the Ryanair luggage allowance.

Uncertainty of Outcome in Formula One

22/10/2018

 
Picture
By Robbie Butler

The United States Grand Prix was held yesterday. Many had anticipated a Lewis Hamilton victory which would have secured the British drivers' 5th Formula One World Drivers' Championship (WDC). This was not to be as Ferrari's Kimi Räikkönen finished in first place, with Hamilton nearly three seconds behind in 3rd place.

Regardless of Ferrari's success, this has delayed the inevitable, and with Hamilton 70 points ahead in the race for the WDC, he is likely to be crowned next weekend in Mexico City. Success for Hamilton will mean his 4th title in five years, and represent a five-in-a-row for Mercedes in the World Constructors' Championship (WCC).

Such dominance is nothing new to Formula One. Since 2000 just eight men have won the WDC. Including the 2018 Championship, and assuming Hamilton wins the title, it will mean three drivers (Hamilton, Vettel and Schumacher) will have won 14 of the past 19 WDC. 

The WCC is even more concentrated. Again since 2000, just six teams have won this title, and 15 of the 19 are shared by three constructors (Ferrari (6), Red Bull (4) and Mercedes (5 including this year). 

Whether this is good for the sport is an open question.

In 2010, rule changes were implemented into the scoring. Although the sport has a long history of altering the scoring system, there was a radical move to award the winner of each race 25 points. This had traditionally been 10 points or less. It could be argued that this rule change has reduced competitive balance.

Is this the case? I don't believe so. The figure above presents one measure of competitive balance, a concentration ratio, of the top two drivers in the WDC standing each year since 2005. It is hard to argue that rule changes to the scoring system in 2010 are responsibility for a reduction in competition. The sport was at its most competitive (since 2005) the year before the rule change, three of the seasons that followed have been less concentrated than the WDC's in 2005, 2006 and 2007. 

The trend is suggesting a movement away from more competitive races but this may not be a consequence of the points scoring changes. The new owners may want to consider the level of competitive balance. Sports fans generally start to become disinterested in events that become noncompetitive. However, the answer to this problem might require more than just changing the points scoring within races. 

Academic Assessment, Sports Statistics and Other Feedback

31/5/2014

4 Comments

 
By John Considine
Earlier this week, as I was grading summer examination papers, Seamus Coffey sent me the following statistical output on the Cork - Waterford, Munster Senior Hurling Championship game.  The output was produced by Ray Boyne (here).  It is an example of what inter-county teams use to examine their performance (Ray was involved with the Dublin senior footballers for a number of years).  Of course, the statistical and video analysis that is conducted by teams goes much deeper than what is presented below.  Last January, I attended a presentation organised by Avenir Sports on the type of work they do with inter-county teams.  In the presentation, Sean O'Donnell outlined the extensive work done analysing the playing and training performances of the Cork senior hurling team.  I was left pondering the gap between the statistical analysis on academic performance and those of sporting performance.  While academic assessment practices are improving, they could benefit from a look at the sporting world.
Picture
At a minimum GAA teams would have the above type of material to them before their next training session (usually two days later).  Timely and detailed feedback is followed by planned performance improvement.  A pretty good system.  Unfortunately, a portion of academic assessment falls short of timely and detailed feedback.  Sometime this is a function of student numbers and the lack of technological supports.  However, there are some technological developments helping to facilitate academic performance improvement.  For example, in economics there are systems like MyEconLab and Aplia.  The latter was developed by Paul Romer.

Romer's thinking about the crossover between performance assessment in sport, and that in the study of economics, is discussed by David Warsh in his book Knowledge and The Wealth of Nations.  Romer believes that students need a coach, and that as a coach what he "needed was the equivalent of a stopwatch, or a heart-rate monitor - some way of gauging their performance and discovering which areas needed work".  As a result, Romer developed an online assessment system for students of economics that allows them to assess their knowledge and receive immediate feedback.  Aplia is limited in its application and is far from providing a silver bullet for students of economics (see an evaluation of its potential here is a piece by Brendan Kennelly, Darragh Flannery and myself).  However, Aplia and MyEconLab do provide another support mechanism in evaluating student performance and providing timely feedback.
Picture
The above sporting statistics and assessment systems are only scratching the surface when compared to the way such data is used in other settings.  An example of how F1 use an almost unimaginable amount of performances statistics is explained in a TED talk by Peter van Manen (here).  The skills involved have been put to good use outside of F1.  Van Manen explains how they used their expertise in data analysis to help monitor the health of babies in life and death situations.

As time passes, we can expect the the use of sporting statistics to increase.  However, they are unlikely to prove a short-cut to success on the field.  They can be a useful supplement to hard work rather than a substitute for it.  In my experience, individuals who seek out new methods as a means of reducing their effort come unstuck.  It is those that use new method to improve their performance that accumulate the benefits.

I hope that not too much time will pass before we can see further improvements in the assessment systems in academia.

4 Comments

Red Bull fails to take away a remedy from the Chinese GP

28/4/2014

 
By Ed Valentine
                                                Sebastian Vettel: “Which tyres is he on”
                                                Race Engineer: “Primes - but he (Daniel Ricciardo) stopped later than you”
                                                Sebastian Vettle: “Tough luck!”
 
The Chinese GP didn’t give fans anything to shout about but it did provide the type of set up economists love by throwing up a mix of strategies, gains and losses based on the constantly evolving track and tyre conditions. The circuit comprises two 270° right hand corners which caused all to suffer from left front graining and it proved to be a limiting factor during the race.

Generally the trend this season compared to last is to pit one less time in race conditions. Last year, the soft and more grip-giving tyre (which is 0.6 - 0.8 of a second faster over 1 lap when used as a new set) gave optimum performance over 5 – 6 laps during a three stop strategy. This year the majority of leading runners have been aiming for two stops in race conditions as they can eek more life out of the softer rubber without falling off a performance cliff as quickly.  Eight laps into a stint in Shanghai the medium tyre became quicker as graining caused the soft compound to lose performance which essentially means that 0.6 - 0.8 of a second advantage gets whittled down and then becomes slower after those eight laps.
 
Pre-race models demonstrated that a two stop strategy would be about six seconds quicker than a three stop strategy but care would be needed to enable than to happen. The graph below shows that Fernando Alonso went for a three stop strategy.  He took the life out of soft tyres and dumped them after 12 laps. Ricciardo went for a two stop strategy.  He managed to squeeze 17 laps out of his tyres and produce competitive lap times. So why did Alonso rather than Ricciardo finish on the podium?  Because Ricciardo he could not get past his team-mate Sebastian Vettel (despite implied team orders).
Picture
Ricciardo managed to stay out for three laps longer in order to have less race laps to do during the final stint. This tactic is known as offsetting. Alonso pitted sooner than Ricciardo and offset him by four laps which gave the Spaniard more pace in the middle stint but would cause him to suffer from older tyres towards the end. This really came home to roost as Ricciardo was closing in on the Ferrari at about one second per lap.  Unfortunately the chequered flag came too soon and Ricciardo was left to rue what happened in the middle of the race.

Vettel was initially on a three stop plan but by lap 25 everyone had decided a two stopper was the optimum strategy. If Vettel had let Ricciardo through on lap 23 then Ricciardo would have caught Alonso with four laps to go. Alonso was forced into a 23 lap final stint in a bid to outwit Rosberg in the Mercedes. The Mercedes driver sailed past Alonso during the final stint as the offset didn’t work out the way of the Ferrari number 1.

This move by Alonso ultimately cost him time on the road relative to Ricciardo but Ricciardo lost out by being behind Vettel. The graphic below shows how much quicker he was than his team mate prior to being allowed past.
Picture
This cost the best part of five seconds.

Nico Rosberg's Mercedes spent much of the race catching up after a poor start but good economics got him into 2nd.

Can Mercedes be caught? The silver arrows had a 22kp/h advantage over the Red Bull on the kilometre long straight at the Shanghai International circuit. That equates to almost 100 meters or 2 seconds on average. Development through the season would allow for the better teams to find about 1.5 – 2 seconds overall. The technology is very immature and so bigger gains can be made by the teams who have more to learn from their overall package.
 
Mercedes will win the championship but their massive advantage should narrow substantially in the second half of the season.

Boredom Fuels Dip In Global F1 Audience Numbers As Vettel Drives Fans Away

25/2/2014

 
By Ed Valentine

Competitive balance has long been a problem in the world’s premier category of motorsport which is due largely to the spending power of the big teams such as Red Bull and Ferrari. In a previous post here. I eluded to the huge differences in spending between the smaller and larger constructors. 

One result of low competitive balance is a fall in the number of global fans tuning in. Formula One Management published a media report in January confirming that viewing figures have fallen by 50 million to 450 million viewers. The drop is due to F1’s unattractiveness to the casual viewer. In seasons of close racing casual TV audience members boost up the numbers, but those viewers will tune in only if the show is exciting. It would be akin to the prawn sandwich brigade staying away from Old Trafford during a prolonged period of mid table finishes.

In TV audience terms Formula One doesn't get anywhere near the Premier League. The reason for this is because the teams are very unbalanced due to their spending capabilities. This financial difference, if compared to football, would equate to a Premier League made up of Chelsea, Liverpool, Manchester City, Arsenal, Leeds United, MK Dons, Gillingham and Walsall. Efforts are underway with the FIA to try to limit how much money teams can spend in one season with a planned resource restriction agreement; however, this is unlikely to reach unanimous consent among F1’s heavyweights.
Picture
The Barclays’ Premier League has more global viewers than any other domestic league in the world, broadcasting to 212 territories with 80 different broadcasters. The TV audience for Premier League games over a season is 4.7 billion and the broadcasting contracts for 2013-16 will be worth £5.5 billion. F1 TV rights, in comparison, bring in £300 million per season – about as much as the Turkish Premier League.

What attracts viewers to the Premier League is the propensity for teams to be relatively evenly matched. On a far greater scale than in F1 any team can potentially beat any other team on any given match day. Norwichcan be demolished 7-0 by ManCity, but then hold them to a goalless draw at home, as happened recently. Some F1 teams have been competing for four seasons and have never scored a point in an era when points are awarded to the
top 10 drivers instead of the top six. The chances of an F1 'giant killing' are not on the cards.

F1 has enjoyed large audiences in Germany which is due in part to the dominance of Vettel, Schumacher and Mercedes. What is striking, however, is that during these periods of dominance viewing figures had an upward trend. The graph shows that between 1992 and 2009 German audiences were highest when Schumacher was most dominant. More fans tuned in to watch him pick up his 7th World Title than watched the dramatic climax of the 2008 season when Massa lost out to Hamiltonin the final corner of the final lap of the championship.

Globally, it seems there is the desire to see a close duel at the top of the standings but within individual territories a
high level of competitive balance is not the priority for the viewers. Formula 1 needs to be more competitive, the FIA needs to turn up the heat to put the fans in a spin!

Picture
Y axis: Viewers in millions; X Axis: Number of career races contested by Michael Schumacher (308 GP)

FIA Plays Joker As F1 Points Double

25/1/2014

 
By Ed Valentine

Among the many rule changes for the 2014 F1 season is the decision to award double points for the final race of the 19 round championship. The idea, put forward in a response to Red Bull’s dominance over the last four years, is intended to give a greater chance for the driver’s championship to remain undecided heading into the final weekend in the hope of retaining TV audiences for the entire duration of the calendar. 
 
The FIA have thrown a dart rather than attempting to find a credible solution but claim that the alteration to the points on offer for the final GP would “maximise focus on the championship until the end of the campaign”. Only three of the previous 20 championships would have had a different outcome had the double points rule been in force. One of Schumacher’s seven titles and one of Vettel’s four would have ended up going to another driver but hindsight doesn’t count in this scenario as the rules were the rules on those days in history.
 
By attempting to make the final race a prized commodity there are a number of unintended consequences and perverse incentives which may result.
Picture
As F1 teams, like all rational economic agents respond to costs, benefits and incentives a change in the approach to the championship from those lower down the rankings is likely to take place. 53 points separated the 7th and 11th placed teams going into the final round of the 2013 championship. With 86 points on offer for a one two finish instead of 43 the smaller teams will almost certainly alter their design process and pour resources into a specific chassis construction for the Abu Dhabi circuit in order to secure those points. This will heavily compromise their competitiveness in the preceding 18 rounds of the championship. Although it is unlikely for the minnows of Williams and Caterham to be tussling for a podium finish there is a high value in creating a 1 race championship as the difference between 8th and 11th place in the standings could be as much as $35 million.

Picture
The new regulations state that engines and gear boxes must last 4,000km before being replaced. If there is a mechanical failure a team can make a change but cannot replace a unit if they want fresh equipment without taking a penalty. This essentially means that the smaller teams will keep 1 unused gear box and engine per car in order to limit the risks of mechanical failure going into Abu Dhabi. Everyone finishing outside the points scoring positions for the penultimate race in Brazilwill register a DNF in order to take a penalty free gear box and engine change. Some drivers running well inside the top 10 may also forsake their points finish if they feel there is a chance of scoring more than double that amount in the last race. We may see only four or five finishers. Honda F1 received a reprimand in 2005 for purposely “retiring” Jenson Button on the last lap in Australia in order to take a free engine change as they felt they had a chance of winning the following GP. If Button had crossed the line and not registered a DNF then a 10 place grid penalty would have been awarded for the next race had they elected to maximise their chances with a fresh engine.
 
The new engine and power-train rules are likely to cause a shakeup in the pecking order. Until the lights go out in Melbourne nobody will truly know where each team stands. This coupled with the certainty of engine reliability issues (some teams, Red Bull included, have voiced concern over engine reliability across the entire season) means there is a strong chance that the wrong driver could win the championship from external circumstances arising
from the double points scenario during the final race.  
 
It has not been a popular idea with the teams or most purists but for the upcoming F1 season the FIA’s dart will keep double top!

Pay As You Go, Go, Go – What It Costs To Be In The Driving Seat

18/12/2013

 
By Ed Valentine

It’s very hard to get into Formula 1 and it’s even harder to stay there. There are only 22 men in the world that can claim to be an F1 driver during any given season. However, the scarcity power is with the teams and not with the drivers as the business model for mid and lower grid teams has a pay as you go contract system. It’s a mechanism which is akin to an average footballer at an average Premier League team, say Scott Parker, having to find €5 million of sponsorship money to gain a place in the Fulham squad. It would certainly avoid a repeat of a Winston Bogarde situation but realistically would never happen in top flight football. It has been common practice in F1 for years. Our very own Eddie Jordan signed Michael Schumacher and gave him his F1 debut in 1991 over more experienced drivers because the German’s $150,000 in sponsorship money was too good an offer for the Irish team to turn down.
Picture
The drivers of the top 4-5 teams in the championship will generally command huge salaries as can be seen in the table beside. The top 9 drivers on the list will have had a large amount of bargaining power with their agents pushing to get the highest salaries possible before putting pen to paper. But for the drivers below there is a different approach entirely. The race seats at the mid to back of the grid will be auctioned off to the highest bidder i.e. the driver who can bring the most sponsorship money to the table. It isn’t a question of being quick enough for F1 it’s more about being rich enough or having the wealthiest sponsorship backing. Pastor Maldonado, who scored just 1 point in 2013, managed to bring $8 million in Venezuelan government oil sponsorship to the Williams F1 team (the driver receiving $1million of that as salary). Without that cash it would have been difficult for the team to keep its doors open.

Liquidity is becoming a problem that is racing its way through the grid at an alarming rate. As previously mentioned in an earlier article there are mechanisms in place to ensure no F1 will get into debt, however, to enable a stable liquidity flow a lower ranked team may opt to compromise on out and out speed by selling its seats for anything between $5-8 million rather than selecting the most talented available driver. The end result is that the overall product to fans, F1 being a spectator driven sport, is of a lower quality. It will create a talent bottle neck in about 5 years ’time when the most experienced drivers in F1 will have spent the large part of their careers as payers rather than payees who were not necessarily the best of their generation.

One solution is for teams at the back end to receive a parachute payment similar to the NFL draft which gives the lowest placed squad the first pick of emerging talent for the next season. If the FIA are looking to keep the grid populated and help finances then the bottom five F1 outfits could be given a prize fund which enables them to buy the best of new driver talent rather than selling a contract to the highest bidder.
 
Until this takes place a quick driver will be worth maybe a tenth of a second over a rival but a wealthy driver truly is worth his weight in gold.

If Overtaking Took Over...

3/12/2013

 
By Ed Valentine

It is interesting looking back at the Brazilian GP that attention has already been focused onto next year’s season. The 2014 rule adjustments promise to give the grid a shakeup as Formula 1 changes lanes somewhat with the introduction of less powerful engines and stricter fuel management. Much of the focus towards next year will be partly due to how this season panned out. Vettel took his 9th straight win in Sao Paolo and had the title wrapped up months ago.
 
In a recent post I demonstrated how other drivers, namely Alonso, were better overall performers and had points been awarded differently over recent seasons the outcome of those championships would have been rather different. The 2013 title fight, though not much of a scrap was made, could not have been less competitive so any alteration of weighting would have made little difference.

But if drivers were given an incentive (in the form of points) to make more overtaking manoeuvres the championship would have more chance of remaining an open contest. Formula 1 would certainly be less predictable. Races where the lead doesn’t change would be no more. If competitors were incentivised to overtake up until the chequered flag passes for the lead would occur more often and races would become less processional as drivers would look to maximise overtaking right up until the final corner. 

Attempts to boost overtaking have already been designed. The graph below highlights that overtaking has radically increased since 2010. The spike from 2011 when DRS, a system which aides overtaking, was introduced highlights how the entertainment factor through wheel to wheel competition needed to be addressed. If point scoring for overtaking was to be brought in this high frequency of passing and having cars with faster race pace than qualifying pace, like the Ferrari, the championship would be more of a contest as drivers would gain points for coming through the pack. 
 
This year the Abu  Dhabi, US and Brazilian GPs contained 66, 22 and 42 overtakes respectively yet they were all lights to flag victories for Vettel. The German led every lap of those races. Nobody had a look in. 
Picture
If the FIA are to stop the race for the championship becoming a race for 2nd place then more needs to be done to
reward on track overtaking. A possible solution could be, for example, 2 points being awarded for every car passed on track during the race after lap 1. Many perverse incentives may occur as team mates may swap places every other lap a bit like high speed ‘tag you’re it’. These could be policed and rules to deter such activity may be set. If driver’s are clever they would aim to gauge the optimum position in which to start the race as a driver choosing to qualify badly in order to be out of position at the start before moving through the field would add to the excitement. Perhaps the driver who set the fastest time on Saturday could have the first pick for grid position.
 
Alonso made 68 on track passes this year to Vettel’s 33 by virtue of starting in a worse grid slot. If 2 bonus points were awarded per pass the Spaniard would have amassed 70 extra points over Vettel. Such a predicament may cause the rival contender to choose to start in just as low a grid position and then we would have a race on our hands.
 
Formula 1 needs to adapt and reward drivers for creating excitement. Otherwise through boredom fans might pass by.

Overtaking statistics do not include: Position changes on the first lap, lapping of backmarkers, positions gained in the pits, positions gained through damage or punctures or mechanical breakdowns etc.

F1 Scoring Is Missing The Point

7/11/2013

 
By Ed Valentine
 
Formula 1 has received some negative flack over the years as some believe there is a lack of competition at the sharp end of the grid. With the Ferrari/Schumacher era of dominance during the early to mid 2000s long gone, many fans and critics thought that the championship battle would become a more open affair and that a number of drivers, albeit within the top three or four teams, would have an equal chance of taking the championship crown. This sadly has not been the case.
 
What is striking about a particular driver’s domination is that it usually causes a change in the points scoring system, as fans may be driven away, in an attempt to level the playing field. During the Schumacher era the points scoring system was altered to close the gap between first, second and third places. For most of the 1990s until 2003; 10 points were awarded to the winner with 6 going to second place. From 2003 until the end of 2009; 10 were award for a win but 8 points went the way of the second place finisher. The points allocation shifted back to add weight to the winner by awarding 25 for a win and 18 for second for the start of 2010. 
Picture
There is a high level of competitive balance if a competitor has the same or similar chance at winning as each of the other competitors. For Formula One, this means that all of the participating teams and drivers have an equal chance at winning a Grand Prix and the Championship. The opposite is therefore true if there is a lower level of competitive balance. Formula 1 is a technical sport and with 22 or so cars, engines, aero packages, gearboxes and drivers, the assumption of equal or even near equal chances to win has to be doubted. This would also detract from the spectacle as an “unlikely” winner would not have a surprise element given the chances would be equal among all of the drivers. 

The point’s allocations of the previous 20 seasons have created a number of anomalies as it appears to reward drivers who are in bursts of form more than it does those drivers who are the most consistent over the year. Last season over the course of 20 races, Alonso and Vettel saw 18 chequered flags. Remarkably, despite finishing in a better position on average, Alonso failed to lift the F1 crown. Alonso’s average finishing position was 3.28. Vettel's was slightly worse at 3.44 yet Vettel won the title by 3 points. In 2010 Alonso’s average was 5.5 while title winner Vettel had an average finish of 6.8. Both drivers had 5 wins. In 2009 Vettel had an average position of 10.4 (points were awarded to the top 8 drivers in 2009) yet finished 2nd in the standings. Webber who finished the season in 4th had an average position of 6.2. In 2007 Kimi Raikkonen clinched the championship at the last race by 1 point and although he won 6 races to Alonso’s 4 he managed to end the year with a 4.8 average to the Spaniard’s 4.0.

In which other sport would this occur? Perhaps in tennis a player, over a five set match, may win more games but lose due to how those games fall within each of the sets. This does not happen often and the scoring system has been consistent for decades. A parallel may be drawn to yhe Premier League where only once in the last 10 seasons has a team with a better goal difference finished runner up in the title race. It happened in 2008-09 when Liverpool had a +50 goal difference to Man Utd’s +44. In 2011-12 the title was decided on goal difference. Alonso, who himself has claimed he is the most consistent driver of the current crop, has been the victim of ignorance towards averages and the central tendency. Formula 1, after all, is a sport where the driver with the highest average speed wins the race.

Bernie Ecclestone has been pushing to bring in a “medals system” which would result in the driver who won the most races in a season lifting the championship. It’s a move which would generally see the title being decided three or four races from the end of the season thus rendering the final stint of the championship a non event. 21 times has the championship been clinched at the final race in 61 seasons with the most dramatic being in 2008 when it was wrapped up in the final quarter mile in Sao Paolo, Brazil.

The points distribution method helps ensure the championship can go down to the wire but, in terms of fairness, however we slice it the system needs to change its mode.

<<Previous

    Archives

    February 2023
    January 2023
    December 2022
    November 2022
    October 2022
    September 2022
    August 2022
    July 2022
    June 2022
    May 2022
    April 2022
    March 2022
    February 2022
    January 2022
    December 2021
    November 2021
    October 2021
    September 2021
    August 2021
    July 2021
    June 2021
    May 2021
    April 2021
    March 2021
    February 2021
    January 2021
    December 2020
    November 2020
    October 2020
    September 2020
    August 2020
    July 2020
    June 2020
    May 2020
    April 2020
    March 2020
    February 2020
    January 2020
    December 2019
    November 2019
    October 2019
    September 2019
    August 2019
    June 2019
    May 2019
    April 2019
    March 2019
    February 2019
    January 2019
    December 2018
    November 2018
    October 2018
    September 2018
    August 2018
    July 2018
    June 2018
    May 2018
    April 2018
    March 2018
    February 2018
    January 2018
    December 2017
    November 2017
    October 2017
    September 2017
    August 2017
    July 2017
    June 2017
    May 2017
    April 2017
    March 2017
    February 2017
    January 2017
    December 2016
    November 2016
    October 2016
    September 2016
    August 2016
    July 2016
    June 2016
    May 2016
    April 2016
    March 2016
    February 2016
    January 2016
    December 2015
    November 2015
    October 2015
    September 2015
    August 2015
    July 2015
    June 2015
    May 2015
    April 2015
    March 2015
    February 2015
    January 2015
    December 2014
    November 2014
    October 2014
    September 2014
    August 2014
    July 2014
    June 2014
    May 2014
    April 2014
    March 2014
    February 2014
    January 2014
    December 2013
    November 2013
    October 2013
    September 2013
    August 2013
    July 2013

    About

    This website was founded in July 2013.

    RSS Feed

    Categories

    All
    American Football
    Athletics
    Baseball
    Basketball
    Behavioural Economics
    Boxing
    Broadcasting
    Competitive Balance
    Cricket
    Cycling
    Darts
    David Butler
    Declan Jordan
    Drugs
    Ed Valentine
    Epl
    Esports
    Expenditure
    F1
    Fifa World Cup
    Finances
    Funding
    Gaa
    Gaelic Games
    Gambling
    Game Theory
    Gary Burns
    Geography
    Golf
    Greyhound Racing
    Guest Posts
    Horse Racing
    Impact Studies
    John Considine
    John Eakins
    League Of Ireland
    Location
    Media
    Mls
    Mma
    Olympics
    Participation
    Paul O'Sullivan
    Premier League
    Regulation
    Research
    Robbie Butler
    Rugby
    Simpsonomics
    Snooker
    Soccer
    Spatial Analysis
    Sporting Bodies
    Stephen Brosnan
    Swimming
    Taxation
    Teaching
    Technology
    Tennis
    Transfers
    Uefa
    Ufc
    World Cup
    Wwe

Related

The website is not formally affiliated to any institution and all of the entries represent the personal views and opinions of an individual contributor. The website operates on a not-for-profit basis. For this reason we decline all advertisement opportunities. 

Contact

To contact us email sportseconomics2013@gmail.com or find us on Twitter @SportEcon.