The Economics of Sport
  • Sports Economics
  • About
  • Workshop
  • Selected Publications
  • Book Reviews
  • A Primer on Gaelic Games
  • Upcoming Events
  • Media
  • Education
  • Resources & Links
  • Data

The 19/20 Premier League – Success Probabilities

31/8/2020

 
By David Butler

This is the fifth and final part in a series of short posts offering insights to different topics for the 19/20 Premier League season. Previously, I considered VAR, Expected Goals, Possession and Team Performances (see posts below).
Success probabilities based on bookmaker odds are the topic of this post.

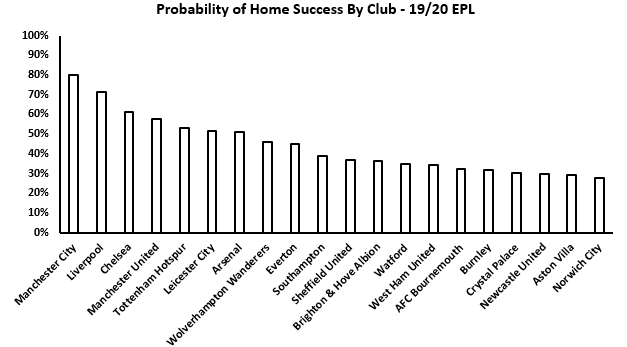
According to bookmaker odds (adjusted for the overround), the home team had a 44% chance of success on average last season. There was a 32% chance of an away win and 24% chance of a draw. These are means and success probabilities vary by club.

​The chart below shows the these average probabilities for each club in descending order from Manchester City (80% chance of a home win) to Norwich (27.5% chance of a home win). 
Picture

Lake Wobegon and Nineteen Eight-Four

26/8/2020

 
By John Considine
Over the last couple of weeks or so there has been plenty of media coverage of the predicted grades of students leaving second-level education in Scotland and England.  At times I wondered if I was in Lake Wobegon where all the children are above average.  It was revealed that the teachers grades for the class of 2020 were on average 12% higher than those achieved in the examinations by the class of 2019.  Does anyone think that the class of 2020 is on average 12% better than the class of 2019?

Attempts at moderating the grades were not well received and moderation was subsequently overturned.  I wonder how the teachers who returned relatively lower grades are feeling.  Possibly like players who try to stay on their feet, after being tackled/fouled in the penalty box, only to go unrewarded by a weak referee.  If we are in a similar position next year then expect those teachers to have learned their lesson.

It reminded me of another hard to believe 12% increase.  In 2011 we were informed of a 12.4% increase in Irish sporting participation between two editions of the Irish Sports Monitor.  The 2009 edition listed participation in sport at 33.5%.  The next edition of the Irish Sports Monitor was published in 2011.  Participation was listed at 45.9%.  There was also a whispered warning about collection methods.

That is a 12.4% increase over two years.  Yet on page 12 of the 2009 Irish Sports Monitor it said “participation rates in sport and exercise do not generally alter by more than around a single percentage point per year”.  At the time, it was my students who spotted the change.  It was part of a project on the government funding of sport.  I contacted the Irish Sports Council for clarification.  The clarification was like something one would get from an EU Commissioner accused of breaking Covid-19 guidelines.  I even invited my contact to talk to the class at a time of their choice.  Nothing doing!
Picture
A couple of years later, the next Irish Sports Monitor is published.  The 2011 figure is revised downwards to 44.8%.  There was probably a genuine reason for this.  That said, I can't get the following sentence, from Nineteen Eight-Four, out of my head.  "Winston's job was to rectify the original figures by making them agree with later ones."

I have written previously about the strange bobble in the figure in 2015 (here).  But let us move forward to 2019.  The figure from the 2019 Irish Sports Monitor is 46%.  It was 45.9% in 2011.  Accepting a margin of error, it seems we can believe the numbers between 2011 and 2019.  In the absence of a flu pandemic was a 12.4% increase in two years believable?  It is about as believable as saying that the class of 2020 is on average 12% better than the class of 2019.
Picture

The Frozen Six Nations

24/8/2020

 
By Robbie Butler

It is easy to forgot that the 2020 Six Nations is still on-going. The tournament, which started on the 1st of February 2020 has 4 remaining games. The first, Ireland versus Italy, will be held on the 24th of October. This will followed by the final round of fixture on the 31st of October, involving all 6 nations. 

The postponement of Ireland and Italy in Dublin was the first high profile sporting causality of Covid-19 on these islands. As the months have past some competitions around Europe have been cancelled, some postponed, and others successfully played behind closed doors. In some instances, completing the competition was essential for the season that will follow. Crowning a champion is important, but probably not as critical as promotion and relegation. Completing the Premier League was therefore much more important than the Champions League (Bayern Munich fans will obviously disagree). 

This is what makes the continuation of the Six Nations interesting. There is no relegation or promotion. It is not dissimilar to major US sports where entry is closely guarded and collective action of "owners" is viewed as very much positive for the sport as a whole. While promotion and relegation are sometimes mentioned in the context of the Six Nations, it is extremely unlikely this will ever happen. The same way it will never happen in the US. Crowning a champion and fulfilling the broadcasting agreements are probably what is driving the need to finish the competition.

The return of live international rugby is very much welcome. Let us hope that a return to more normal times at the Aviva, Stade de France, Twickenham, etc. is not too far away.

The 19/20 Premier League – Team Performances

21/8/2020

 
​By David Butler

This is the fourth and penultimate part in a series of short posts offering insights to different topics for the 19/20 Premier League season. Previously, I considered VAR, Expected Goals, and Possession (see posts below).

Here I consider team performances using Whoscored.com team ratings – I’m led to believe many of their statistics are derived from OPTA data. Whoscored claim that their ratings “are based on a unique, comprehensive statistical algorithm, calculated live during the game. There are over 200 raw statistics included in the calculation of a player'’s/team’'s rating, weighted according to their influence within the game. Every event of importance is taken into account, with a positive or negative effect on ratings weighted in relation to its area on the pitch and its outcome”

Which home team had the best performance this year in any given match? Whoscored rate Manchester City’s drubbing of Watford as the highest. The home team received a rating of 8.2. No surprises that the lowest rated home performance goes to Southampton for their showing against Leicester City (5.53). The opponents in each match received the highest/lowest away performance ratings.
.
Save Leicester’s amazing performance in Southampton (or Southampton’s shambolic collapse – whichever way you want to look at it),  Manchester City put in the next five highest away team performances against West Ham, Brighton, Aston Villa, Watford and Crystal Palace. The stats suggest that City were very entertaining on the road. 
​.
Finally, what if we considered the aggregate of team performances? Maybe this gives an insight to ‘match quality’. Interestingly, the biggest clubs don’t come out on top – Burnley’s one nil win at West Ham on the 8th of July does. West Ham were also involved in the second-best match, going by team ratings. Unfortunately for the Hammers, they lost that match too – this time at Anfield.  What about the lowest rated match? This was Bournemouth’s four one win against Leicester. There was plenty of goals but maybe not too much quality on show. Plenty of mistakes and misses actually if my memory serves me right.  

Asking for Empirical Evidence

19/8/2020

 
By John Considine
Picture
Yesterday the government announced a tightening of social restrictions in an effort to "halt the spread of the disease".  The measures relating to sport removed spectators at games and reduced the numbers allowed to train together.  In the hours following the announcement, the GAA called on the acting Chief Medical Officer (CMO) to provide the empirical evidence on which the decisions were based.  I'm guessing that the impending Storm Ellen won't dump enough water on Ireland to stop the authorities from kicking up dust.

The training numbers were restricted to 15 outdoors and 6 indoors.  Why is there a smaller number allowed to train together indoors?  That is not such a silly question to ask.  Consider the likely answer to that question and then consider that all GAA fields are outdoors and the minimum length of a GAA field is 130m and the minimum width is 80m.  Prior to yesterday, 200 people were allowed populate inside and outside the GAA field (although it appears that the Taoiseach did not know that this was the case, as suggested here).  Many are asking how we allow 50 people to attend indoor events such as cinema/theatre/worship/lectures but we do not allow 50 people to attend outdoor events.  Could outdoor attendance at sports events be limited to 50 people or to X% of fixed-seating capacity?

There is a danger with the GAA looking for the evidence.  Or even looking for decisions to be based on evidence.  There are other questions that could be asked.  Why are the games themselves allowed continue given that gaelic games are contact sports?  Why are 15-v-15 games are allowed continue while only 15 people are allowed to train together (usually more socially distant)?  But if forced, then most sports people prioritise games ahead of training and behind-closed-doors to no games. 

We should ask people to explain their decisions.  We should ask them for their evidence.  But we should also remember that there are limitations to our decision making.  Let me finish with a quote from The General Theory of Employment, Interest and Money.
​
"... human decisions affecting the future, whether personal or political or economic, cannot depend on strict mathematical expectations, since the basis for making such calculations does not exist; and that it is our innate urge to activity which makes the wheels go round, our rational selves choosing between the alternatives as best we are able, calculating where we can, but often falling back for our motives on whim or sentiment or chance."

Salary Caps And The English Football League

17/8/2020

 
By Robbie Butler

Since football almost everywhere has been forced to play behind closed doors many aspects of the game have come on the radar. One such area of concern has been player salaries. This is acutely true for lower football teams where match-day income, particularly gate receipts, are a main source of income. This income has disappeared and might not return for some time as it is unlikely supporters will be allowed to attend matches in the normal fashion in the near future.

In response to the erosion of many English Football League club's primary source of income, the 2nd, 3rd and 4th tiers of the professional game have proposed the introduction of a salary cap. Such a move is largely unprecedented in recent times (in 1901 the FA introduced a salary cap that would remain until 1963) and would mark a power shift, back towards club owners. This would break the trend of the past 50+ years where players have become more and more powerful. 

Salary caps are not unusual in other sports around the world. North American sports employ salary caps quite effectively. All of the major sports in the US, with the exception of Major League Baseball (MLB) use salary caps. MLB instead uses a luxury tax.

In theory, there are two main benefits derived from salary caps. The first is that it brings greater parity between teams or competitive balance. The second is that is encourages teams to live within their means and avoids costs spiraling out of control.

Of course, not everyone is happy. The Professional Footballers' Association (PFA) - the players union - have voiced their concern. Formed on 2nd December 1907, the PFA is in its own words "the world’s longest established professional sportsperson’s union".

The union has come a long way since the "retain and transfer" system which effectively tied players to clubs, not unlike baseball's reserve clause.  For example, in 1959, George Eastham refused to sign a new contract with his club, Newcastle United, and requested a transfer. This request was declined. The source of the problem was Eastham disputing whether the house the club had supplied him was habitable and the unsatisfactory secondary job that the club had arranged. Eastham refused to play for Newcastle United in the 1960-61 season. Unable to leave, the player went on strike in early 1960. However, in October 1960, Newcastle United finally agreed to transfer the player to Arsenal for £47,500. 

As Eastham later recounted:
 “Our contract could bind us to a club for life. Most people called it   the "slavery contract". We had virtually no rights at all. It was often the case that the guy on the terrace not only earned more than us – though there's nothing wrong with that – he had more freedom of movement than us. People in business or teaching were able to hand in their notice and move on. We weren't. That was wrong”. Rebels for the Cause (2004).

Backed by the PFA, Eastham brought proceedings against Newcastle United in the High Court. In the case, Eastham v. Newcastle United [1964] Ch. 413, the judge ruled partly in Eastham's favour and the retain and transfer system was never the same again. 

It will be interesting to see how the hard fought gains since 1963, which culminated in the European Bosman Ruling in 1995, will be impacted by any such salary cap. Might we be moving back in the direction of the owners?

The 19/20 Premier League – Possession & Points

13/8/2020

 
By David Butler

This is the third part in a series of posts offering insights to different topics for the 19/20 Premier League season. Previously, I considered VAR and Expected Goals (see posts below).

Here, I consider the  average possession and points won as they give a nice insight to strategy. The chart below plots the relationship between  a team’s average possession and their total points. 
Picture
As expected the more a team have the ball, the more points they earn. After all, if the opposition don’t have it they can’t score. Man City had the highest average possession rate this season (66.68%) but didn’t win the League. The champions Liverpool were not far behind however with a 63.33% average. These were the two stand out teams.

Interestingly, only one team in the bottom 5 for average possession was relegated - Watford. This gives a nice insight to strategy. Newcastle (38.59%), Burnley (41.43%) and Sheffield United  (42.94%) were in the bottom four teams for average possession yet managed to accrue relatively high points. For me, this speaks volumes on how Bruce, Dyche and Wilder set up their teams.

Norwich are somewhat of an outlier – they saw about as much of the ball as their opposition in any given Premier League match (49.48%). They couldn’t turn this into goals however, and for half of the time they didn’t have the ball they were usually pretty bad at keeping goals out.  

Scoring Just Before Half-Time

10/8/2020

 
By John Considine
Picture
A recent paper published in the Journal of Sports Economics suggests that there is a benefit to scoring just before the half-time break in soccer.  Their results are based on a statistical analysis of four seasons of data from the Top-5 European football leagues.  The authors note that their results are at odds with previous statistical studies on the same issue.  And, they suggest that the differences might be accounted for by the way the studies went about doing their evaluation.  Indeed.

What is meant by scoring "just before half-time" and how is it supposed to impact team performance?  I expected that scoring "just before half-time" would be defined and measured as the distance from half-time, e.g. t-1sec, t-2sec, and so on.  I expected the measurement to work backwards from half-time.  Not so.  It works forward from the start of the game.  It is defined as the 41st to 45th minute after kick-off.  Added time at the end of the first half is wrapped into that period.

What about the channels through which it is supposed to impact team performance?  Virtually all of the channels listed as potential explanations are psychological.  It is about what happens inside the body/brain of the players.  A statistical analysis of sports data with potential psychological explanations of correlations.  (We might wonder where is the economics but that only takes us into the murky area of defining economics.)

We might also wonder what psychologists might think about the approach.  One well-known and respected psychologist is Timothy Wilson.  In the second chapter of Redirect: Changing The Stories We Live By, Wilson has two subsections labelled "VIVA THE EXPERIMENTAL METHOD" and "STATISTICAL MAGIC?".  The question mark captures his caution about the way the statistical method can be used.  He says "multiple regression is the tool of the trade for many economists, sociologists, and psychologists.  In these researchers' defense, sometimes it is impossible, for practical or ethical reasons, to perform an experiment using random assignment to condition."  Not all caution the reader about the strength of their findings.

It is to the credit of Philippe Meier and his co-authors from the University of Zurich that their Journal of Sports Economics paper provides the reader with a clear outline of their methods, the limitations of their measurement, and the extent to which their results differ from previous work.  That is not always the case in the literature.  Increasingly readers are presented with "big data" and a range of more sophisticated statistical techniques with the presumption that these overcome any underlying issues about causation.

The 19/20 Premier League – Expected Goals

7/8/2020

 
By David Butler

This is the second part in a series of posts offering insights to different topics for the 19/20 Premier League season. Previously, I considered VAR (see post below).

Here I’ll consider expected goals in each of the 380 matches. While most have become familiar with Xg’s – it is even used on Match of the Day now – for those that are unacquainted with the concept this is a measure that evaluates a team’s efforts on goal relative to the difficulty of the chance created. Lots of information on a given shot (player positioning, distance from goal, angles, body-part used etc.) is plugged into a statistical model which, in turn, produces the xG stat. A high xG for a team generally transfers to more dangerous chance creation. It might be considered a measure of threat or maybe a means to capture the ‘entertainment value’ of a match.

The match with the highest Xg this season was Manchester City vs. Watford. The home team won 8-0. Unsurprisingly, this high Xg was largely caused by City’s excellent performance. Watford were actually involved in the three matches with the highest Xg’s. A neutral fan would have been well entertained if they followed the Hornets.

At the other end of the distribution is (boring, boring) Bournemouth. They were involved in the three the matches with the lowest Xg’s this season. They didn’t score in any of these three games and were beaten 1-0 on all occasions. The Cherries goals drying up is probably the main reason for their demise. Indeed Burnley’s’ 1-0 win at the Vitality stadium just before Christmas could be considered the least entertaining match of the season, although a goal was scored. Even at that Jay Rodriguez left it late (89th minute winner).

Galway Races and The Draw

4/8/2020

 
By Robbie Butler

The Galway Races went ahead under unusual circumstances last week. Normally a highlight of the Irish summer, and most attended race meeting of the year, the 7-day festival played out in front of empty stands. For the past number of years I have followed various trainers on this site - most recently Willie Mullins. Had anyone followed Mullins last week (using our normal rules) they would have made a considerable profit from the County Carlow based trainers' 10 winners. 

This post doesn't focusing on 'beating the bookies' but rather an interesting race dynamic that deserves some attention. For those unfamiliar with the Galway race course, the track is a relatively sharp, undulating, right-handed mile and a half where race position is key. This is especially so in sprints which can be as short as 7 furlongs. 

In these 7 furlong races the horse draw (stall) is crucial. The draw is randomly allocated to each horse prior to the race and can be anywhere from stall 1 up to the 16 or 17. The problem for those drawn "high" - roughly stall 10 or higher - is that horses meet a sharp bend after about 1 furlong or so in 7 furlong sprints. it is the equivalent to being drawn in lane 6,7 or 8 on a running track and meeting the bend after 50 meters. Horses drawn in stalls 1-5 have a decided advantage if they break well and meet the bend on the rail. 

The upshot of this is that it is very hard for horses with high draws to win sprint races at Galway. Of course, the odds should factor this in but I get the impression that they adjust less than they probably should. There may be an inefficiency here that could be of interest on the betting exchanges. The table below provides information on the average position of the first 4 horse in the 28 flat races that had 9 runners or more. 
Picture
Lower draws would appear to help. The figure to the right also plots the winning stall for each of the eleven 7 furlong races. This is a small sample but stalls 1, 3 and 4 make up more than 50% of the winners. 

When compared to races in excess of 1 mile 4 furlongs again it would appear that lower draws are a sizable advantage.
Picture

    Archives

    February 2023
    January 2023
    December 2022
    November 2022
    October 2022
    September 2022
    August 2022
    July 2022
    June 2022
    May 2022
    April 2022
    March 2022
    February 2022
    January 2022
    December 2021
    November 2021
    October 2021
    September 2021
    August 2021
    July 2021
    June 2021
    May 2021
    April 2021
    March 2021
    February 2021
    January 2021
    December 2020
    November 2020
    October 2020
    September 2020
    August 2020
    July 2020
    June 2020
    May 2020
    April 2020
    March 2020
    February 2020
    January 2020
    December 2019
    November 2019
    October 2019
    September 2019
    August 2019
    June 2019
    May 2019
    April 2019
    March 2019
    February 2019
    January 2019
    December 2018
    November 2018
    October 2018
    September 2018
    August 2018
    July 2018
    June 2018
    May 2018
    April 2018
    March 2018
    February 2018
    January 2018
    December 2017
    November 2017
    October 2017
    September 2017
    August 2017
    July 2017
    June 2017
    May 2017
    April 2017
    March 2017
    February 2017
    January 2017
    December 2016
    November 2016
    October 2016
    September 2016
    August 2016
    July 2016
    June 2016
    May 2016
    April 2016
    March 2016
    February 2016
    January 2016
    December 2015
    November 2015
    October 2015
    September 2015
    August 2015
    July 2015
    June 2015
    May 2015
    April 2015
    March 2015
    February 2015
    January 2015
    December 2014
    November 2014
    October 2014
    September 2014
    August 2014
    July 2014
    June 2014
    May 2014
    April 2014
    March 2014
    February 2014
    January 2014
    December 2013
    November 2013
    October 2013
    September 2013
    August 2013
    July 2013

    About

    This website was founded in July 2013.

    RSS Feed

    Categories

    All
    American Football
    Athletics
    Baseball
    Basketball
    Behavioural Economics
    Boxing
    Broadcasting
    Competitive Balance
    Cricket
    Cycling
    Darts
    David Butler
    Declan Jordan
    Drugs
    Ed Valentine
    Epl
    Esports
    Expenditure
    F1
    Fifa World Cup
    Finances
    Funding
    Gaa
    Gaelic Games
    Gambling
    Game Theory
    Gary Burns
    Geography
    Golf
    Greyhound Racing
    Guest Posts
    Horse Racing
    Impact Studies
    John Considine
    John Eakins
    League Of Ireland
    Location
    Media
    Mls
    Mma
    Olympics
    Participation
    Paul O'Sullivan
    Premier League
    Regulation
    Research
    Robbie Butler
    Rugby
    Simpsonomics
    Snooker
    Soccer
    Spatial Analysis
    Sporting Bodies
    Stephen Brosnan
    Swimming
    Taxation
    Teaching
    Technology
    Tennis
    Transfers
    Uefa
    Ufc
    World Cup
    Wwe

Related

The website is not formally affiliated to any institution and all of the entries represent the personal views and opinions of an individual contributor. The website operates on a not-for-profit basis. For this reason we decline all advertisement opportunities. 

Contact

To contact us email sportseconomics2013@gmail.com or find us on Twitter @SportEcon.