The Economics of Sport
  • Sports Economics
  • About
  • Workshop
  • Selected Publications
  • Book Reviews
  • A Primer on Gaelic Games
  • Upcoming Events
  • Media
  • Education
  • Resources & Links
  • Data

Age Effects in African Under Age Football

31/8/2016

 
by Declan Jordan
The news that broke recently that all but two of Nigeria's Under-17 first team failed age tests for the forthcoming African Cup of Nations was shocking, but not surprising. Nigeria have been remarkably successful in the last decade at U-17 level. Nigeria won the U-17 World Cup in the last two tournaments in 2013 and 2015. They were runners-up in 2009 (when they hosted the tournament) and won as well in 2007. They have won the competition 5 times in all.

However, there have been question marks about Nigerian players' true ages for many years now. Indeed there are strong suspicions that African football,and to a lesser extent other regions, have flouted the age rules for many years. In the 2013 tournament, 3 players from each of Morocco, Congo, and Nigeria were sent home from the U17 World Cup for failing the age test. In 2009 MRI bone scans were introduced to test players were the age they claimed to be.

It may not be surprising that countries would want to use older players, since there is a physical advantage for older players in underage tournaments. Indeed, there is a substantial literature on the 'relative age effect', a topic on which my colleagues on this blog have published research. FIFA rules dictate that a player is eligible for a competition if he or she was born in the designated calendar year, so for the U17 tournament in 2015 players must have been born on or after 1 January 1998 (17 years previously). This means players born earlier in the year (in January for example) can have up to 12 months age advantage (and associated physical advantage) - details on player eligibility is available on page 20 here. There is now substantial evidence that football squads are over-represented by players born in the early months of a calendar year relative to the general population.

What might be expected is that countries who are looking to enter players who are older than they actually are is that they would state an age earlier in the calendar year. For example, in this article it is reported that the Syrian squad for the U19 World Cup in 2012 included six players born January 1, 1993 and that the entire team had January birth dates. That approach seems to be a little bit obvious of course, so perhaps it would be better not to draw attention to your squad by spreading the month of birth out.

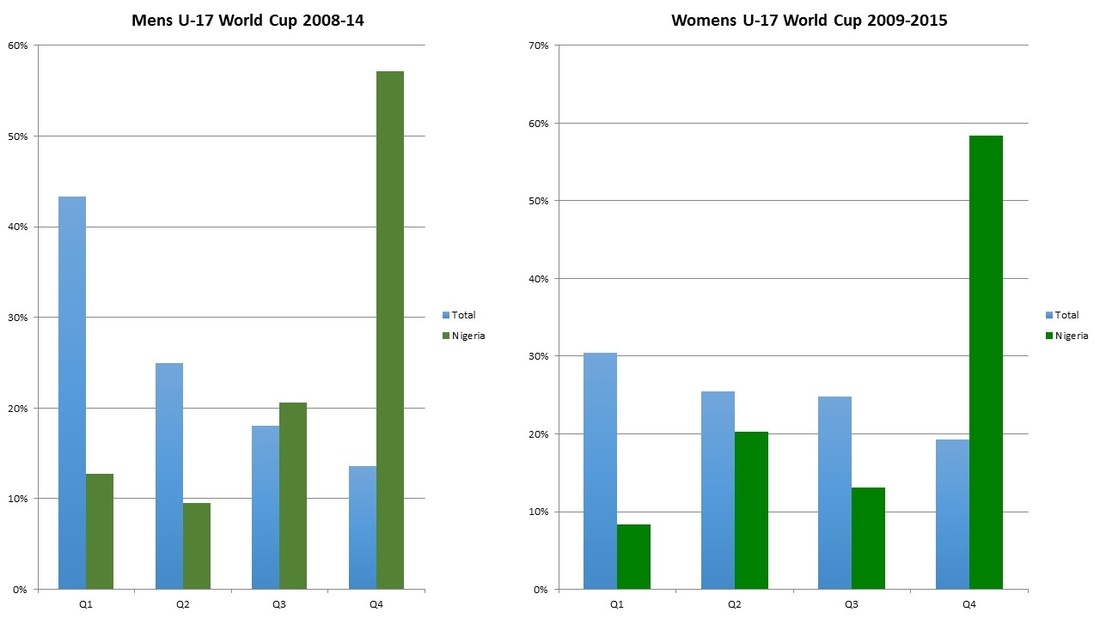
The graphs below show the profile of month of birth (by quarter) for four editions of Men's and Women's U-17 World Cup Finals from 2007 to 2014. There are 24 countries in the Men's World Cup and 16 in the Women's. It is noticeable that the age dispersion is greater for women, more players are born in the later quarters of the year (the difference is statistically significant). The graphs show quite a remarkable difference between the dispersion for Nigerian squads and other squads (excluding Nigeria). Nigeria appeared in all of the four Women's Finals and three of the four Men's Finals. The graphs show that Nigeria had a statistically different month of birth distribution than the average of the other countries.
Picture
Extending the analysis to look at regional differences in relative age effects, the tables below show the classification of players by the half of the year in which they were born (January to June or July to December) for each global region.
Picture
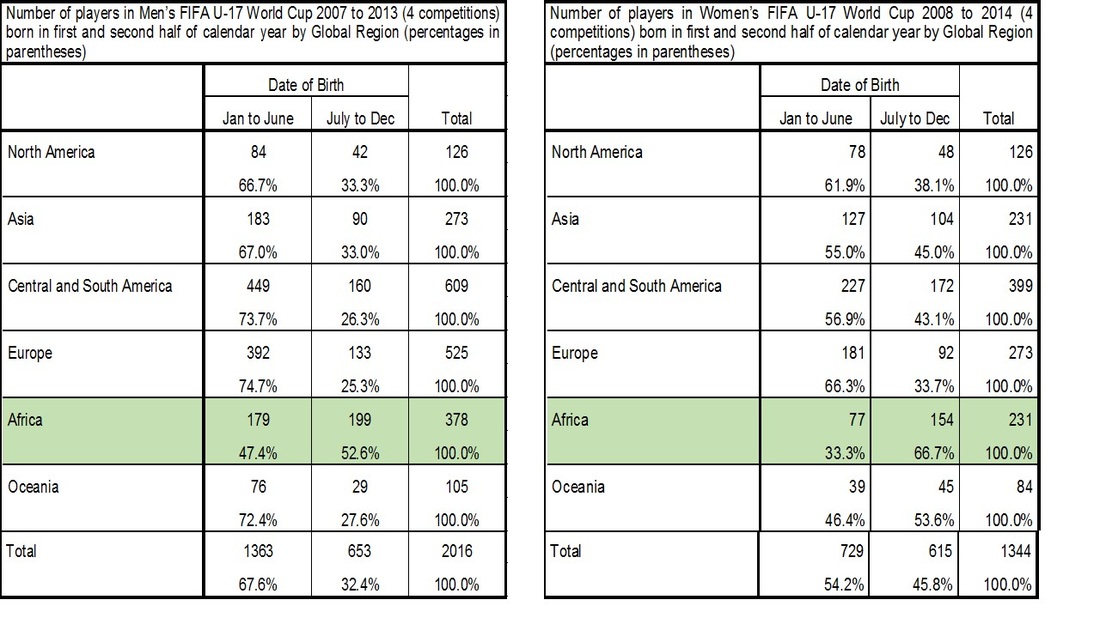
Africa stands out as the only continent that shows a greater proportion of players born in the second half of the calendar year (the only exception is Oceania for the Women's Finals). The proportion born in the second half of the year is higher for African countries in the Women's Finals. Again, the difference between regions for men and women is statistically significant. 

It is difficult to know the reasons for Africa's exceptional result. If age fraud is a substantial problem there then perhaps the ages being registered are designed to deflect attention by having much less January birthdates. It may be that the birthdate registered is less important where it is different than an actual birthdate. In the absence of age fraud, perhaps there is less physical difference between African athletes of less than a year's age difference, or perhaps African football has avoided the traps of other countries that tend to select more older players and thereby lose younger players to the game. These latter explanations though would likely result in a flat distribution (similar to the dispersion of months of birth in the general population) rather than having such a large proportion in the second half and final quarter of the calendar year.

Two Returning Features

26/8/2016

 
By David Butler

Two features are returning to Sporteconomics.org for the forthcoming season – our ‘beat the bookies’ and ‘follow the pundit’ section. Both can be accessed under the ‘More’ tab.

In the case of the former, Ed Valentine from OPTA thinks about using his information to beat the bookies on the football pitch. In a similar vein to the horse racing festivals over the years, Ed aims to win ‘fantasy’ money by selecting teams before every game week across the EPL, Serie A, Ligue 1, Bundesliga and La Liga and calculating the best strategy by which to go about placing bets on them. In contrast to last year, this season's 'beat the bookies' will not be constrained by betting rules or the teams that must be selected. Essentially, it is Ed (the analyst) Vs. Paddy (the bookie)! 
​
For the latter, I will provide regular updates regarding the success of pundits as they systematically predict Premier League scores – it’s not very often we see media organisations who pundits represent disclose the outcome of their performance (although they are getting slightly better). For the 2014/2015 and 2015/2016 season I recorded the predictions of Sky Sports pundit Paul Merson and BBC pundit Mark Lawrenson for English Premier League matches. The ‘Follow the Pundit!’ section will provides updates on the success of football these ‘experts’ again this year. The data gathered here is part of an ongoing running research project (with John Eakins and Robbie Butler) which concerns score predictions. The work is entitled ‘the mystics and the market’ and will be presented at the European Association of Sports Economics conference next week in Groningen.  

The Success of Team GB

24/8/2016

 
By Robbie Butler

With the Rio Olympic Games at an end, I thought it timely to consider the medals table. Unsurprisingly, Team USA retained top spot. However, the performance of Team GB is worth noting.

The graphics below present the number of medals won, and the total number of gold medals won by host countries during their Games and the Games four years later. Team GB bucked a recent trend and managed to win more medals in Rio than they did four years earlier at London 2012. 
Picture
Picture
This is quiet an achievement and can be largely explained by investment by Sport UK in Olympics athletes and the funding model adopted by the governing body.

Currently, more than £350 million is allocated to both Olympic and Paralympic sports. This is an increase of more than 10% on the London Games in 2012. UK Sport provides a breakdown of this allocation by sport here. It appears that the heavy investment in cycling, rowing and athletics all paid off, with eleven, five and seven medals won respectively. Other sports, that could possibly have done better given the level of investment were sailing, swimming and boxing. 

Given the strategy of Sport UK, under performing sports need to be careful. Some have had there funding cut, or eliminated entirely. Basketball, one of the most popular team sports in Great Britain, receives no funding from UK Sport. It does get roughly £10 million from Sport England but this does not go to fund Olympic pursuits. This is due to the perceived under performance of Team GB four years ago. Not surprisingly, Team GB didn't compete in Rio.

It's likely that athletics, cycling, equestrian and rowing will all receive increases in funding. Expect to see Team GB athletes dominating podium in these sports at Tokyo 2020. 

The Efficiency of Irish International Managers

22/8/2016

 
By David Butler

Many works in the sports economics literature have attempted to measure the efficiency of managers in light of the human capital available to them. Every football manager has a range of talent inputs at their disposable and the observed results is the consequential output. Of course, this is dependent on a range of factors, especially the quality of talent available to any given manager and the quality of opposition faced.

As part of research I am conducting with Oliver O’Brien and Pat Massey, we are trying to measure the efficiency of Irish international managers. Ireland is interesting to look at as our management structure switched from a panel of selectors to single manager in the 1969-70 season.

The graph below provides a snapshot of the research and displays the win ratios of permanent Republic of Ireland international managers (from before the second world war to present). The initial switch to a single manager didn’t yield positive results immediately but as time as gone on Republic of Ireland managers have become more successful.  

There are lots of factors coming together here however and it's highly unlikely we became more efficient purely due to managerial changes alone.  For instance, how important was Charlton’s exploitation of the granny rule? Also, as time has gone the game has become so much more professional. Coaching techniques and investment in infrastructure has definitely improved. We often hear old stories of Irish internationals getting on a boat to travel over for international matches just after finishing a club game – thankfully those days are long gone.

Picture

Some Olympic Insights

18/8/2016

0 Comments

 
By Robbie Butler

Based on the Medal Table at lunchtime (GMT) on Thursday (18th) I decided to have a look at the relationship between GDP per capita, population and medals won at the Summer Olympic Games in Rio, Brazil. 

Not unsurprisingly the United States (93), China (54), Great Britain (50), Russia (41), Japan (33), France (31), Germany (29), Australia (24), Italy (23) and South Korea (16) occupy the top ten places in the medals table. The ten are amongst the biggest economies on the planet, measured by GDP. Eight of the ten are in both top ten lists.

Below are two graphics to digest. The first considers the medals haul of the seventy-nine countries that have made the podium so far and GDP per capita. The second plots medals won and population. Those below the trend-line in each graph are outperforming the mean, based on either output per person or population. 
Picture
Picture
0 Comments

Leicester & Leipzig -  Challenging the Traditional Superpowers

17/8/2016

 
​​By Mark Fallon
​
Mark Fallon is a student of DCU and and has previosuly studied at ESB Reutlingen, Germany.

Last October, I spoke about the Red Bull Sports Marketing model and mentioned the rise of RB Leipzig - a team bought by the Austrian energy drinks company in 2009 when they were languishing in the 5th tier of German football. Red Bull  investors aspired that the Saxony based club  to be in the Bundesliga within 8 years. On the 8th May 2016, they were officially promoted to the Bundesliga - a year ahead of target. A day earlier, there were scarcely believable scenes in the King Power stadium in Leicester as Captain Wes Morgan was presented with the Premier League trophy for 2016 - a fact that is made all the more startlingly when the transfer bill and salaries of the Leicester’s is compared with that of their premier league counterparts. Again, upon promotion to the Premier League in 2014 - their Thai chairman aspired for the club to be a top 5 team within three years - less than two years later - they are the number 1 team in England.
 
Leicester went toe-to-toe with European superpowers and money rich clubs and blew them away with a work ethic, team ethic and tactical simplicity that excited the traditionalists and saw Leicester become every football fan’s - ‘second team’. RB Leipzig have grabbed the attention of the traditionalists also - but for the wrong reasons and there have often been the subject of boycotts and strikes as German football fans seek a club run by the fans (50+1 - the fans have voting rights in the running of the club). Such is the reluctance of the German Football Federation to allow for involvement of corporate parties in football - Red Bull had to tone down their logo in their stadium and also the RB - stands for Rasen Ball not Red Bull. Both Leicester and Leipzig are challenging the superpowers of the Manchester clubs and Chelsea and Bayern Munich or Dortmund in their respective countries.
 
The economic and social background to both clubs allow for this - yes, they have been heavily invested in by billionaire investors and have invested heavily in infrastructures and players - like the Manchester City’s  and Bayern Munich’s of this world. What they have not done however is wasted money and spent extortionate amounts of money on players who ultimately, so far at least, have delivered performances that match their value.
 
In comparing value of player, we will take a look at Leicester v Manchester City, two teams who attracted  investors from Asia and while the Manchester, are comparably bigger - they could learn a thing from their English rivals - let’s compare Raheem Sterling v Riyad Mahrez or NGolo Kante v Yaya Toure.
 
RB Leipzig, fit a German stereotype of investing in facilities and long-term benefits - they built an academy worth and have plans to expand on their current stadium. They are the only big football team in their region and that should attract more supporters and sponsors also. The question that can be asked is what is stopping RB Leipzig becoming like an Anzhi or a Malaga - two teams who invested heavily recently in return for success in football and both teams fell by the wayside rapidly when investors got fed-up with no short-term success per money invested. The reason why many believe this fate won’t be suffered by the Leipzig outfit is simple - the Red Bull Sport’s Marketing Model doesn’t allow for this and also the profile of their players v Malaga and Anzhi.
 
While both teams have a long way to go before proving themselves to be giants in domestic and European football - both provide us with two valuable economic lessons - the importance of seeking value for money and to plan long-term.

Shirtonomics 2016/2017

12/8/2016

 
By David Butler

As per usual, at the start of the Premier League season we have some 'fun' calculating the range of prices fans pay to get a footballer’s surname printed on the back of their shirt.

For the 2013/2014 and 2014/2015 season Jussi Jääskeläinen’ claimed top spot. The West Ham United stopper was the most expensive player due to the diaereses above his name. It cost a Hammer approximately £26 to get ‘Jääskeläinen-22’ printed on their replica shirt (making our simplified cost assumptions). Last season Bastian ‘Schweinsteiger-31', at 14 letters and double digits topped the list, costing £22.

Once again, we apply the same cost structure to all names - £4 per number and £1 per letter. All dots, hyphens, accents etc. are considered letters. The names are sourced from the Official Premier League website and only consider first team squads.

A Manchester United player tops the list once again this season, Cameron ‘Borthwick-Jackson–43', at 17 letters and double digits would cost approximately £25 and is the most expensive in the Premier League. That said, it's still somewhat off Jan 'Vennegoor of Hesslink-29', who remains the most expensive in Premier League history. So it looks like its going to be another expensive season for Manchester United fans. You'd be right in thinking 'Ibrahimović-9' doesn't come cheap either.  

In terms of a giveaway, while 3 lettered names such as Emre ‘Can’, Dael 'Fry' and Jordan ‘Ibe’ have double digit squad numbers, you could pick up Tottenham’s ‘Son – 7' for approximately £7 or Burnley’s Ben ‘Mee – 6'. Both join the list of Premier League bargains along with Ruel 'Fox-7', Rob 'Lee-7', and David 'May-4'! 

While shirtonomics is intended to be taken with a pinch of salt, merchandising, image rights and a clubs ability to market their stars has grown in importance over the years. Fans now seem to be as interested in what these stars do off the pitch as much as they do on it.  In my view, this will get increasingly significant going forward. From a psychological perspective it's also interesting to think about how fans, particularly children, identify with players, and subsequently clubs for a lifetime. 

Brexit And The Premier League

8/8/2016

 
By Robbie Butler

Before our summer break I wrote about the possible consequences to the English Premier League of Brexit (see here). Now that the outcome of the referendum has emerged, a number of things could happen, once the United Kingdom triggers Article 50 of the Lisbon Treaty and leaves the European Union.

The Bosman ruling will no longer apply. This ruling was passed by the European Court of Justice in November 1995. Under EC Treaty Article 45 (1) of the Treaty on the functioning of the European Union, all EU football players are permitted to move freely at the end of their contracts, with the provision that they are transferring from a club within one EU Association to a club within another EU Association. Clubs in the UK will no longer be subject to this ruling.

Of the top five leagues in Europe, the Premier League has imported the most EU players from outside it its own borders; more than 1 in 3 players during the 2015-2016 season. This compares to 1 in 5 in the Bundesliga, 1 in 7 in La Liga and just 1 in 14 in France’s Ligue 1. These players could now be treated like all non-EU signings by Premier League clubs.

The rules regarding the signings of non-EU players have been tightened in recent years by the Home Office with players generally (exceptions can be made on appeal) having to 1) played at least 75% of all competitive ‘A’ matches for their country, for which they were available for, over the two seasons prior to the proposed transfer and 2) be from a country that has achieved a minimum average position of 70th in the FIFA World Rankings for the two previous years.

Had these rules already been applied to EU players, the likes of Dimitri Payet, N'Golo Kanté and Anthony Martial would not have been permitted to play in England. Something similar to the “Three Foreigners Rule” may also re-emerge.

Irish players will need to continue to perform well on the international stage. The draw with Sweden and win over Italy should give the FIFA world ranking a big lift. However, this time two years ago the Republic of Ireland were ranked 70th in the world. While unlikely, a sustained decline in performances for a number of years could result in problems for Irish players playing in the Premier League, if the international team’s relative success doesn’t continue.  

Are Football Transfers Gone Insane?

4/8/2016

 
By Stephen Brosnan,

The 2016/17 Premier League season begins today. Most Premier League clubs are still actively searching for new players to add to their squads for the forthcoming season. Last week, Italian champions Juventus acquired the services of Gonzalo Higuaín from rivals Napoli for £75.3 million, the third highest transfer fee of all time. This transfer was facilitated by the world record transfer of Paul Pogba from Juventus to Manchester United. These figures have been labelled ‘crazy’ by Chelsea manager Antonio Conte while the Guardian’s Rob Smyth has claimed here that the “transfer fee of Gonzalo Higuaín leads us into theatre of the absurd”.

The rhetoric that transfer fees have gone insane has been present for many years. Pogba’s world record transfer back to Manchester United provides suitable grounds for further investigation. The table below provides information on Manchester United’s transfer activities from 2008-2016 including total transfer spending, the name of their marquee i.e. most expensive signing and the transfer fee spent on that player.
Picture
*Revenue figures sourced from Forbes list and adjusted by currency exchange rates on 1st May each year. Transfer figures sourced from transfermarkt.co.uk
Between 2008 and 2012, Sir Alex Ferguson was Manchester United manger and on average spent £39 million on transfers which accounted for 14% of total revenues. This was the lowest average transfer spend during the period as the manager had built a team over the years and transfers were generally to strengthen key areas. Following Ferguson’s retirement, David Moyes (£66 million), Louis Van Gaal (£145 million) and Jose Mourinho (£168 million) have on average spent considerably more on transfers. Furthermore, when we consider transfer spending relative to revenues the increases are still evident. During Ferguson’s last few years, United spent 14% of total revenues on transfers. In the years following Ferguson’s departures transfer spending has increased on average to 34% of revenues.

However, closer examination suggests transfer spending may not be yet be gone out of control. Although, Manchester United plan to break the world record with their approach for Pogba, the total transfer spend relative to revenues is still lower than that of Louis Van Gaal in 2014 when he took control of the team. Similarly, Pogba’s fee may not be as excessive as first appears, at least in relative terms. Pogba’s world record fee represents around 22.65% of United’s revenues which is the largest share of all marquee signings during the period. However, previous signings such as Angel Di Maria (19.55%) and even Berbatov (16.20%) represent significant investment relative to total revenue.

Given that football managers are likely to invest heavily in their earlier years to rebrand the team in their own image it is unsurprising that Manchester United are investing heavily in their squad. Furthermore, a key factor in the clubs ability to increase transfer spending power has been the increases in revenues. During the period, average annual increases in revenues were 8% per annum, increasing from £199.36 million in 2008 to £441 million in 2016. These revenues make Manchester United the third richest club in the world according to Forbes with their objective of achieving £500 million in revenue well in sight. Transfer spending at Manchester United has certainly increased over time. However, given the changes in management, underperformance of the team and significant increases in revenues these changes are not surprising and most certainly should not lead football into the ‘theatre of the absurd’.

Stephen Brosnan is a PhD candidate in the Department of Economics, University College Cork

Some Behavioural Insights to Mega Football Transfers

1/8/2016

 
By David Butler

The transfer of Paul Pobga to Manchester United for an apparent fee of £100 million (€118 million) has been making the headlines over the last few weeks. If it goes ahead it will be another watershed for football – the first £100 million pound player.
​
It has taken 37 seven years to go from the Trevor Francis £1 million move to Nottingham Forest to today’s £100 million figure (although I think technically the Francis move was worth £1.18m). I'm sure the theme of conversations in 1979 was the same as today - 'the game has gone nuts!'. By most accounts Francis didn't live up to the fee, suffering from a recurring injury during his time at Nottingham Forest.

Reading about Manchester United’s impending decision to part with the £100 million reminded me of a nice summary Richard Thaler has in his recent book Misbehaving of findings from the psychology of decision making that supports the idea that early picks in the NFL draft will be overvalued. The general ideas are more or less applicable to high end deals in football where transferred players fail to deliver relative to expectations. Here are four.

People are overconfident in their ability to distinguish between talent. To justify a £100 million fee a player should be extremely talented. Of course, objectively and accurately measuring talent, let alone potential, is very challenging. The stats do show that Pogba generally scores well, but perhaps not well enough to be worthy of the staggering fee. WhoScored.com ranks Pogba tenth in the list of player statistics behind the likes of Riyad Mahrez,  Henrikh Mkhitaryan and Angel Di Maria. The FIFA index, which adopts a 'wisdom of crowds' approach to measuring ability, has Pogba 23rd on their list. He holds the same rating as players such as Kevin De Bruyne, Sergio Busquets and Alexis Sanchez.

People make extreme forecasts. Elite players are statistical outliers. The problem is that those chasing the talent can overestimate the ability of ‘star’ performers. Scouts are perhaps too quick to define elite talent. Players like Cristiano Ronaldo and Gareth Bale are extremely rare. Is Pogba in the same bracket as these players who sold for £80m and £85m respectively not so long ago? Naive optimism can be a powerful force. 

Selective Acceptance. There is information embedded in Juventus agreeing to part company with Pogba for this fee. The act of acceptance should provide Manchester United some insights. Naturally, the Old Lady think that Pogba is worth £100m or less. A literature in economics now exists to show that people can overbid in two-party trades, suffering from the winner's curse. A quick glance at the increasingly accurate Transfermarkt.com, suggests that Manchester United would be overpaying by approximately £30m. 

People tend to believe that others think just like them. This is usually labelled the false consensus effect. In a simple sense, when a club nail their colours to the mast and publicly identify their target, it may be the case they think all other clubs share their views. Fearful of competitors, they may be more likely to give into a selling clubs demands. Although betting on the Pogba-Manchester United move is now closed, the threat of Real Madrid entering the race for Pogba's signature (whether realistic or not) may have inflated the fee.   

    Archives

    March 2023
    February 2023
    January 2023
    December 2022
    November 2022
    October 2022
    September 2022
    August 2022
    July 2022
    June 2022
    May 2022
    April 2022
    March 2022
    February 2022
    January 2022
    December 2021
    November 2021
    October 2021
    September 2021
    August 2021
    July 2021
    June 2021
    May 2021
    April 2021
    March 2021
    February 2021
    January 2021
    December 2020
    November 2020
    October 2020
    September 2020
    August 2020
    July 2020
    June 2020
    May 2020
    April 2020
    March 2020
    February 2020
    January 2020
    December 2019
    November 2019
    October 2019
    September 2019
    August 2019
    June 2019
    May 2019
    April 2019
    March 2019
    February 2019
    January 2019
    December 2018
    November 2018
    October 2018
    September 2018
    August 2018
    July 2018
    June 2018
    May 2018
    April 2018
    March 2018
    February 2018
    January 2018
    December 2017
    November 2017
    October 2017
    September 2017
    August 2017
    July 2017
    June 2017
    May 2017
    April 2017
    March 2017
    February 2017
    January 2017
    December 2016
    November 2016
    October 2016
    September 2016
    August 2016
    July 2016
    June 2016
    May 2016
    April 2016
    March 2016
    February 2016
    January 2016
    December 2015
    November 2015
    October 2015
    September 2015
    August 2015
    July 2015
    June 2015
    May 2015
    April 2015
    March 2015
    February 2015
    January 2015
    December 2014
    November 2014
    October 2014
    September 2014
    August 2014
    July 2014
    June 2014
    May 2014
    April 2014
    March 2014
    February 2014
    January 2014
    December 2013
    November 2013
    October 2013
    September 2013
    August 2013
    July 2013

    About

    This website was founded in July 2013.

    RSS Feed

    Categories

    All
    American Football
    Athletics
    Baseball
    Basketball
    Behavioural Economics
    Boxing
    Broadcasting
    Competitive Balance
    Cricket
    Cycling
    Darts
    David Butler
    Declan Jordan
    Drugs
    Ed Valentine
    Epl
    Esports
    Expenditure
    F1
    Fifa World Cup
    Finances
    Funding
    Gaa
    Gaelic Games
    Gambling
    Game Theory
    Gary Burns
    Geography
    Golf
    Greyhound Racing
    Guest Posts
    Horse Racing
    Impact Studies
    John Considine
    John Eakins
    League Of Ireland
    Location
    Media
    Mls
    Mma
    Olympics
    Participation
    Paul O'Sullivan
    Premier League
    Regulation
    Research
    Robbie Butler
    Rugby
    Simpsonomics
    Snooker
    Soccer
    Spatial Analysis
    Sporting Bodies
    Stephen Brosnan
    Swimming
    Taxation
    Teaching
    Technology
    Tennis
    Transfers
    Uefa
    Ufc
    World Cup
    Wwe

Related

The website is not formally affiliated to any institution and all of the entries represent the personal views and opinions of an individual contributor. The website operates on a not-for-profit basis. For this reason we decline all advertisement opportunities. 

Contact

To contact us email sportseconomics2013@gmail.com or find us on Twitter @SportEcon.