The Economics of Sport
  • Sports Economics
  • About
  • Workshop
  • Selected Publications
  • Book Reviews
  • A Primer on Gaelic Games
  • Upcoming Events
  • Media
  • Education
  • Resources & Links
  • Data

Adidas, Nike, and Soccer

30/6/2014

0 Comments

 
By John Considine
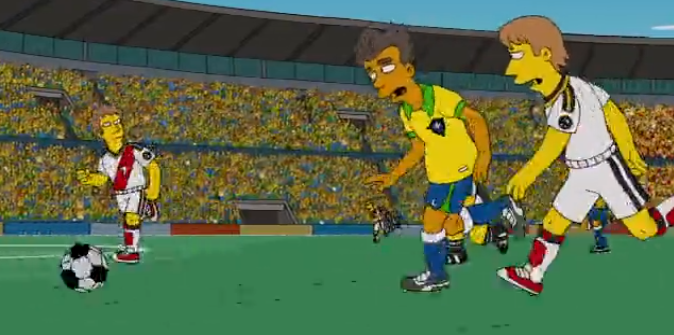
Brendan Greeley and Bloomberg have produced a documentary on the competition between Adidas and Nike for consumers of soccer sportswear.  The film is called Shootout: Can Nike beat Addidas in Soccer?  Greeley used his friend's sons to introduce a human face to the business side.  For example, he begins by bringing the kids two replica German goalkeeper's jerseys and ends the documentary by showing how the kids make an emotional investment in the game.  Fortunately for Greeley, his friendship, and the health of one of the boys, Greeley displays good hands himself in "saving" one of the kids from going over his shoulder and smashing, face first, into a footpath!
Picture
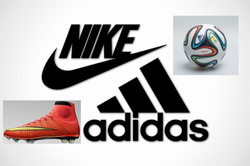
Nike entered the soccer market in 1994 when the USA hosted the World Cup.  Adidas made its dramatic entry 40 years earlier when its founder contributed to the German victory in Switzerland through the development of screw-in studs on the footwear (cleats to US readers; boots to European readers).  Nike has almost eliminated the 40 year headstart of Adidas.  Last year soccer sales were $2.4bn for Adidas and $1.9bn for Nike.

One of the reasons Adidas maintains its lead is that since 1970 it has sponsored FIFA.  They have just concluded a deal up to 2030 costing them $70m for each four year cycle.  This allows Adidas to put their name on the field and to produce the World Cup ball.  Addidas sold 13 million of the 2010 World Cup footballs and hope to sell even more of the 2014 version.

When it comes to team sponsorship in the Brazil World Cup, Nike hold a slight advantage.  Nike sponsor 10 teams including the hosts, whereas Addidas sponsor 9 teams.  An interesting snippet from the documentary is when Adidas reveal that the most popular national teams shirt by sales is Columbia.

While teams are sponsored as a group of individuals, players retain the rights over what footwear they wish to place on their feet.  This is illustrated by Luka Modric who carries the Nike logo on his Crotia shirt, the Addidas logo on his Real Madrid shirt, but regardless of the team he wears Nike footwear.  Players like Modric promote footwear from one of limited number of lines (or silos).  Heading up the silos are Ronaldo (Mercurial) and Messi (F50).  Greeley and the representatives of Nike and Adidas note that the World Cup performances of Ronaldo and Messi will not fully determine the commercial success of the footwear.  This is because of the range of soccer competitions in which they play and the way technology allows their performances to be seen by their fans.  To illustrate the point, Greeley explains how one of the most successful soccer brands, Zlatan Ibrahimovic, is not even playing in the World Cup.  It means that the battle between Nike and Addidas will continue even after the final in Brazil.

0 Comments

Local Economy  & The Irish Open

28/6/2014

 
Picture
By Robbie Butler

Playbooks and Checkbooks is the title of the 2009 book by sports economist Stefan Szymanski. In the book Szymanski considers the impact of sport on our lives and asks whether the sports business generally shares its gains with the citizens supporting it.

One of the more interesting chapters is called “Sports and the Public Purse”. The author examines what is known as the “sporting money illusion” – the theory that sporting events bring large amounts of income into a host city, country or region. Szymanski goes on to illustrate how this is not the case with the use of examples at the national level.

Here’s a micro example. I managed to get to two days of the Irish Open at Fota Island Resort recently. Many people might have had the view that Cork, and indeed Ireland, benefits economically from this event. Is this so?

It all depends on where people come from.

By far the majority of people at the event were from Cork itself. Their decision to attend the event does almost nothing for the local economy, expect possibly increase the velocity of money in circulation. This is obviously debatable. A resident of Cork (spending money in Fota at the event) is simply substituting their consumption. e.g. cinema is quieter, restaurants less full, city centre bars not as busy.

Irish residents not from Cork, and attending the event, do boost the local economy. Money spent in Fota or the surrounding area would probably not have been spent in Cork hence the city and/or county are better off. As a result, one can argue that the event has large local economy benefits. On the flip side however other counties lose out, be it Dublin, Kerry, etc. Furthermore, these Irish residents bring no net gain to the Irish economy. GDP is no bigger.

The only benefit to the Irish economy comes from international visitors. I can tell you these were few and far between at the Irish Open. However, the income they spend is a win-win from both Cork and Ireland. Hotel rooms, restaurants, bars, etc. all benefit from their presence and the money is additional to what would have been spent had the Irish Open not been here.

So next time some tells you how much an event is worth to the local economy, consider if it is does anything at the national level. More often than not people mistake local benefit with a substitution effect.

The World Cup on RTE

27/6/2014

 
By David Butler

Over June and July RTE, Ireland's national television and radio broadcaster, will beam images from World Cup 2014 in Brazil to T.V sets throughout the Irish state. For many sports enthusiasts this will bring great satisfaction. For the non-football fan however, what appears to be wall to wall football coverage, can test one's mental endurance.

At the start of the Premier League last  year I calculated how much football could be watched early in the season. Below is the math and some RTE entertainment comparisons to put into context the extent of World Cup coverage on RTE relative to a years worth of other T.V entertainment.

A dye in the wool football fan can view 5040 minutes of football action on RTE over the month (5 group games across the eight groups, as the last two kick off together, and 16 post group ties). This figure is a minimum and doesn't take into account opening/closing ceremonies, added time, extra time, highlight shows, the musings of any pundit or the superb Après Match.

To put this number (5040) in perspective, the 2012 season of the Australian soap Home and Away aired by RTE lasted 4950 minutes, that's 225 episodes that ran for 22 minutes each. In terms of just the 90 minutes of football, if one was to watch the entire World Cup on RTE it would be similar to watching just over an entire season of Home and Away in one month.

Season 51 of the Late Late Show, Ireland's Premier National talk show, lasted 4440 minutes, that's 37 episodes lasting 120 minutes each. Again, spending this time with Ryan Tubridy is not far off the extent of World Cup footage on RTE. 

In terms of other popular drama and entertainment shows on RTE, watching the entire World Cup would equate to viewing about 229 episodes of The Big Bang Theory, about 8 seasons of Celebratory Masterchef and would be close to seeing Dermot and his team renovate nearly 100 houses in Room to Improve!

Of course, the World Cup only happens every 4 years, so perhaps we should only think of a quarter of this viewing time or alternatively we could appreciate that soap fans just smooth their consumption and shouldn't be too frustrated. For me however these stats (especially the Home and Away one!) put into perspective what those who have no preference for football have to endure for June and July of 2014.

Picture

World Cup Break

12/6/2014

 
The blog will be on a break for the next two weeks as the contributors watch game after game, after game, after game, from the FIFA World Cup.  The next post will be on June 27th.

The Economist & Soccer in The U.S.A

12/6/2014

 
By David Butler

The Economist newspaper carries a range of thought provoking articles concerning the ‘beautiful game – ugly business’ this week that can be accessed here, here and is most thoroughly featured here. In the last of these three articles, a briefing called ‘A Game of Two Halves’ many claims are made – some of which I agree with, others which I do not. Luckily for me we can actually collect data to see whether one claim (I doubted) is correct.

Suggesting that the soccer in the U.S is growing in status the newspaper says that:

“According to Forbes magazine, the average MLS franchise is now worth $103m, up more than 175% over the past five years. The league had 13 clubs in 2007; next year it will have 21, including a new club in New York. The improved MLS has lured America’s best players, like Mr Dempsey and Michael Bradley, back from the European leagues. There are ten players from MLS teams in this year’s American squad; there were just four in 2010.” (pg.24 - European Print Edition)

It is fair to make inference from citing the Forbes report, arguable (opinion) that messrs Dempsey and Bradley returned to the U.S  due to the ‘lure of the MLS’ but inaccurate to draw inference on the MLS’s popularity using the metric of home based players in the American squad. It is here that the newspaper is selective with the evidence – why not include the number of American based players in the 1990, 1994, 1998, 2002 and 2006 squads also? Surely if the number of American based players in their squad was a proximate measure for soccers status as a sport in the U.S the number of home based players in these earlier World Cups would have also been low?

The table and chart below suggests otherwise. If we collect more data and look at U.S squads in World Cups since 1990 (the last time the U.S played in a World Cup before then was 1950), with the exception of 1994, when ironically the competition was hosted in the U.S, there has actually been a downward trend in the number of American based players in the squad.

While not arguing against the point that soccer in the U.S is growing in status, using metrics such as the number of home based players in the U.S squad is not a good measure to gauge the development of the beautiful game stateside. 
Picture

WASPs and Cricket

11/6/2014

1 Comment

 
Picture
By John Eakins

Those of you who are fans of cricket and particularly the ODI (One Day  International) and Twenty 20 limited overs versions may have noticed a new feature introduced by Sky Sports in their cricket coverage. Known as WASP or the Winning and Score Predictor, this statistical tool acts as a very simple way of tracking the outcome of the match. In essence it has two features, firstly predicting the total score of the team batting first and secondly predicting the chances of winning for the team batting second. The latter is given in terms of a percentage, so for example if the WASP equals 20%, then the team batting second has a 20% chance of winning at that point in the match.
 
I’m sure many of you are probably saying “so what?”, but Cricket is a game where, because of the way the scoring works, assessing who is winning at a point in the match can be very subjective. What is particularly interesting about the WASP (and what can add to the intrigue of the match) is that its value is recalculated ball by ball. So if a team batting second hits a six, the WASP percentage will increase whereas if the team loses a wicket, the WASP percentage will decrease. And as is often the case with run chases in cricket, a team’s chances of winning can fluctuate throughout the innings and potentially go from the very low to the very high (and vice versa) within a few balls.  

The other interesting feature about WASP is that it was developed by two economists at the University of Canterbury, Dr. Scott Brooker and Dr. Seamus Hogan. Brooker carried out the research as part of his PhD studies under the supervision of Dr. Hogan. A working paper on the subject can be found here. A less technical description of the underlying methodology and a set of frequently asked questions about WASP can be found here and here on a set of blog posts by Seamus Hogan. In these posts he makes the point that WASP is not a predictor of who is likely to win the game but rather a predictor of who is winning at a particular point during the match. He gives an example of a match involving Australia and Ireland. If Ireland bat second and get off to a great start, posting a lot of runs in the first couple of overs and not losing any wickets, the WASP score is likely to show them to be winning at that time. Most cricket observers (and bookmakers!) would still however have Australia as their favourites given their past performance. 
 
And this is essentially how WASP works. It takes data from past cricket matches and predicts who is winning if the two teams are playing on an average basis, that is, playing based on the average performance of a top-eight batting team against a top-eight bowling/fielding team. It doesn’t take into account the relative strengths or current form of the teams and players. So it’s not perfect but it does make for interesting viewing especially in tracking the progress of the WASP as the game progresses and in the final few overs of a close game when WASP values can change dramatically.

1 Comment

The Simpsons, FIFA & Match-Fixing

10/6/2014

0 Comments

 
By Robbie Butler

A number of weeks back we did a selection of sports economics and Simpsons pieces to coincide with the launch of Homer Economicus: The Simpsons and Economics. Last week’s Sunday Times report on the alleged corruption surrounding Qatar’s successful 2022 World Cup bid gives us more ammunition. The newspaper claims that large sums of money were passed between those behind the Qatar bid and FIFA representatives with voting privileges. At the centre of the allegations is former FIFA's executive committee member Mohamed bin Hammam. The Qatari national was supposedly a key figure in securing the 2022 World Cup. However, the Sunday Times reports that leaked email documents prove bin Hammam paid members of other nations' Football Associations prior to the 2022 FIFA World Cup bid. FIFA’s main sponsors (such as adidas and Sony) are now publically calling for an investigation into the matter. 

This corruption story comes hot on the heels of another. A recent international friendly between Scotland and Nigeria at Fulham’s Craven Cottage was supposedly targeted by match-fixers. These allegations of fraud in the “beautiful game’ were so serious that the Scottish Football Association contacted the National Crime Agency to investigate the matter.
PictureHomer with the Executive Vice President of the WFF
In March of this year, Fox aired You Don't Have to Live Like a Referee¸ the 16th episode of the 25th season of The Simpsons. The plot goes as follows. Following Lisa’s success in a school ‘hero’ competition, a speech she gives during the event goes viral, the result of which is Homer being asked to referee games during the World Cup in Brazil by the Executive Vice President of the fictitious World Football Federation (WFF). The VP satirically says to Homer “Mr. Simpson, please help us. The rot is everywhere. In fact, I see that eh, I myself am about to be arrested for corruption”, before being led away in handcuffs.

Following an excellent refereeing performance in an opening round match between Brazil and Luxembourg, Homer becomes the target of match-fixers. He is greeted by men who offer him a briefcase full of cash. Homer refuses the bribe and vows to be an honest referee despite the protests of the match-fixers. However, upon hearing that he is in fact not Lisa’s ‘hero’, he becomes depressed and decides to drink his problems away. Devastated by Lisa’s ‘betrayal’ he decides to accept a bride on the World Cup final between Brazil and Germany. Homer is offered $1 million so that Brazil will win the World Cup. Upon overhearing this conversation Lisa begs Homer not to take the bribe.  

During the game, a Brazilian by the name of El Divo dribbles into the penalty area before diving. Homer true to his morals however, does not award the penalty. Germany go on to win the match 2-0 and lift the World Cup.
While most of us strongly doubt the actual World Cup final will be the victim of match fixing, this Simpsons episode is a timely reminder of the dangers posed by match-fixers. The buildup to Brazil has been marred by street protests, unfinished stadia and alleged corruption at the highest level of the game. Above all things let’s hope the football is clean. Afterall that’s why we watch.
0 Comments

The Cork City Marathon

10/6/2014

0 Comments

 
PictureAlex O’Shea set a new world record time of of 3hrs 41mins 10secs
By Robbie Butler

On the June back holiday weekend I yet again endeavoured to complete a leg of the Cork City Marathon relay. This has become somewhat of an annual event in our School and with the help of four colleagues (including fellow sporteconomics.org contributors Declan Jordan and John Eakins) we set about running through the streets of Cork city. 

Reconstituted in 2007 (the race was run from 1982 – 1986), the marathon is one of the best spectacles you will see throughout the year on the banks of the River Lee. The sense of community spirit is palpable with competitors and spectators alike encouraging those that seek to complete the course, be it 26.2m (full marathon), 13.1 miles (half marathon) or 5+ miles (relay). What’s more, the race brings together all sorts of athletes, from those seeking to win the races, to those just happy to complete a leg of the course, even firemen attempting to break world records! 
 
It was during my 5.2miles of the race that my mind began to wander and I started to think about the the race from a public health perspective. Surely no other event in the Cork calendar has more of a positive impact on both physical and mental health. Athletes training for both full and half marathons are advised to start training around the New Year. By the time the June bank holiday arrives they have spent many hours, running hundreds of kilometres of both city and rural Ireland (in most cases!). Us relay runners however spend much less time out and about but still need to train in the weeks before the race. The cost associated with hosting the race is minimal. Most of the infrastructure is in place already. Some hosting costs (barriers, extra Gardí, etc.) are required but most is covered mainly by the cost of entry into the race. 

€737,000,000 was allocated to Mental Health Services in Ireland under Vote 39 of the 2014 Revised Estimates (Health Service Executive). I doubt any of this allocation goes towards planning or staging the Cork City marathon. Despite this, the race is surely one of the best value for money initiatives in the region at promoting and maintaining mental health. The good news too is that the race is growing in popularity. The table below presents data on the reconstituted race since 2007. Given relay teams and repeat competitors it’s very hard to know exactly how many individuals have run in the race since 2007 but one can estimate that approximately 50,000 entrants have run through the street of Cork city.  

Picture
The great news is that the race is becoming increasingly popular. The half marathon looks like a great addition to race day and could surpass 2,000 entries next year. As for us, our team 'Random Walk' completed the race in 3hrs 57mins 19secs (210th of 617). That's 16mins plus slower than a man running it on his own in full fire-fighter gear (including steel toe-capped boots!!). We need to train much harder for next year.
0 Comments

Mike the Gardener

9/6/2014

0 Comments

 
By John Considine
Yesterday, June 8th, marked the fourteenth anniversary of one of the more infamous meetings in competition (antitrust) law.  On that day, some of the key players in the replica shirt business had a short but eventful meeting.  The meeting forms part of the facts in an Office of Fair Trading investigation (here).  The meeting has become famous because of the alleged interaction between Dave Whelan (of JJB & Wigan Athletic fame) and Mike Ashley (of Sports Soccer & Newcastle United fame).  The meeting was arranged to dampen the price war in the sale of replica soccer shirts.  Dave Whelan arrived at the meeting by helicopter.  On disembarking, he got the meeting off to a bad start when he apparently thought that Mike Ashley was the gardener (see paragraph 188 of the OFT Decision).  Things did not get any better when during the meeting Whelan was alleged to have said to Ashley, "there's a club you know in the north, son, and you're not part of it".  Two months later, Mike Ashley decided to blow the whistle on the price-fixing cartel and, therefore, sparked the OFT investigation.
Picture
It seems that in the months prior to the infamous June 8th meeting, Sports Soccer's strategy of discounting replica kit was causing some unrest amongst the retailers.  Paragraphs 157 and 158 details how JJB complained to Umbro (the manufacturer of the replica kit) about such practices and threaten to withdraw orders unless Umbro sorted it out.  Umbro was also coming under pressure from Manchester United to deal with the issue (paragraph 172).

Of particular concern in May/June 2000 was the retail price of the England shirt.  In March, Sports Soccer were selling the shirt at £28.  This was over £10 less than most high-street retailers.  In his witness statement, Mr. Chris Ronnie of Umbro explained how, at a meeting in April, agreement was reached with Sports Soccer to retail the England shirt at its recommended retail price of £39.99.  Sports Soccer continued to discount the England replica shorts and socks.  Mr Ronnie spoke to Mike Ashley in an attempt to get him to stop this discounting.  Initially, Ashley refused. Then Mr Ronnie stopped a delivery to Sports Soccer.  After this delivery was stopped, Sports Soccer sold socks and shorts at the recommended retail price.

Is it any wonder that Mike Ashley was motivated to blow the whistle on the price-fixing?

On June 20th, England were eliminated from the Euro 2000 tournament.  The following day Sports Soccer discounted the England replica shirt to £20.  David Butler has written on this blog about the dissatisfaction surrounding the price of the England shirt for this year's World Cup (here).  If England are eliminated from this year's competition then similar, or greater, discounting will follow.

0 Comments

4 World Cup Tips

7/6/2014

 
By David Butler

With the World Cup starting next Thursday I’m sure plenty are filling out those prediction forms at work and school.  It may not be much help but here’s some quick advice based on the statistics of questions people are often asked to answer.

1. Qualifying: In terms of qualifying for the last 16 it's not always plain sailing for the top two teams in a group. If we a use (and trust) the FIFA rankings to categorise teams,  from 'the real pot C and D' teams in groups  over the last 4 world cups (since it became a 32 team competition),  14% of the 128 teams on the lower end of the relative rankings progress to the last 16. The advice: Mostly include favourites to qualfiy from the group but choose 4-5 teams that are not expected to qualify from the group.

2. Goals Scored: There was an average of 156 goals scored over the last 4 World Cups.  France 98’ saw the most goals ever scored in a World Cup at 171. This has reduced since to 161,147, and 145 respectively. There has been an average of 2.44 goals scored per game over the last 4 competitions.  The advice: use the average as a benchmark and perhaps guess a maximum of 12 goals either side. 

3. Golden Boot: There maybe another case of the cursed prolific goalscorer here. In the 19 World Cups to date only  25% of the top goal scorers have played for the champions (Schiavio – joint for Italy in 1934, Ademir for Brazil in 1950, Kempes for Agentina in 1978 and Ronaldo for Brazil in 2002). Just looking again at the last 4 world cups the top goal scorers have all played the maximum 7 games (Suker-Croatia 1998, Ronaldo-Brazil 2002, Klose-Germany 2006 & Mueller-Germany 2010) The advice: Choose an attacking player you believe will get to the end of the competition (third place play-off or final). He does not necessarily have to be in the winning team.

4. Winner: As Robbie Butler has suggested “the average age of the winning team since 1994 has been 27.75 years. Brazil’s most capped 18 will be aged 27.56 years.” Also only 1 in 5 World Cups have been won by nations outside of the host continent so the advice would be to stick with the bookies favourites, given that Brazil tick these two boxes of age and geography.... Their not bad footballers either..!

If these don’t help you may need to make friends with a mystic octopus or alternatively familiarise yourself with Stephen Hawking’s World Cup math! 
<<Previous

    Archives

    March 2023
    February 2023
    January 2023
    December 2022
    November 2022
    October 2022
    September 2022
    August 2022
    July 2022
    June 2022
    May 2022
    April 2022
    March 2022
    February 2022
    January 2022
    December 2021
    November 2021
    October 2021
    September 2021
    August 2021
    July 2021
    June 2021
    May 2021
    April 2021
    March 2021
    February 2021
    January 2021
    December 2020
    November 2020
    October 2020
    September 2020
    August 2020
    July 2020
    June 2020
    May 2020
    April 2020
    March 2020
    February 2020
    January 2020
    December 2019
    November 2019
    October 2019
    September 2019
    August 2019
    June 2019
    May 2019
    April 2019
    March 2019
    February 2019
    January 2019
    December 2018
    November 2018
    October 2018
    September 2018
    August 2018
    July 2018
    June 2018
    May 2018
    April 2018
    March 2018
    February 2018
    January 2018
    December 2017
    November 2017
    October 2017
    September 2017
    August 2017
    July 2017
    June 2017
    May 2017
    April 2017
    March 2017
    February 2017
    January 2017
    December 2016
    November 2016
    October 2016
    September 2016
    August 2016
    July 2016
    June 2016
    May 2016
    April 2016
    March 2016
    February 2016
    January 2016
    December 2015
    November 2015
    October 2015
    September 2015
    August 2015
    July 2015
    June 2015
    May 2015
    April 2015
    March 2015
    February 2015
    January 2015
    December 2014
    November 2014
    October 2014
    September 2014
    August 2014
    July 2014
    June 2014
    May 2014
    April 2014
    March 2014
    February 2014
    January 2014
    December 2013
    November 2013
    October 2013
    September 2013
    August 2013
    July 2013

    About

    This website was founded in July 2013.

    RSS Feed

    Categories

    All
    American Football
    Athletics
    Baseball
    Basketball
    Behavioural Economics
    Boxing
    Broadcasting
    Competitive Balance
    Cricket
    Cycling
    Darts
    David Butler
    Declan Jordan
    Drugs
    Ed Valentine
    Epl
    Esports
    Expenditure
    F1
    Fifa World Cup
    Finances
    Funding
    Gaa
    Gaelic Games
    Gambling
    Game Theory
    Gary Burns
    Geography
    Golf
    Greyhound Racing
    Guest Posts
    Horse Racing
    Impact Studies
    John Considine
    John Eakins
    League Of Ireland
    Location
    Media
    Mls
    Mma
    Olympics
    Participation
    Paul O'Sullivan
    Premier League
    Regulation
    Research
    Robbie Butler
    Rugby
    Simpsonomics
    Snooker
    Soccer
    Spatial Analysis
    Sporting Bodies
    Stephen Brosnan
    Swimming
    Taxation
    Teaching
    Technology
    Tennis
    Transfers
    Uefa
    Ufc
    World Cup
    Wwe

Related

The website is not formally affiliated to any institution and all of the entries represent the personal views and opinions of an individual contributor. The website operates on a not-for-profit basis. For this reason we decline all advertisement opportunities. 

Contact

To contact us email sportseconomics2013@gmail.com or find us on Twitter @SportEcon.