The Economics of Sport
  • Sports Economics
  • About
  • Workshop
  • Media
  • Selected Publications
  • Book Reviews
  • A Primer on Gaelic Games
  • Upcoming Events
  • Education
  • Resources & Links
  • Data

Upcoming Event

30/9/2014

0 Comments

 
Picture
By David Butler & Robbie Butler

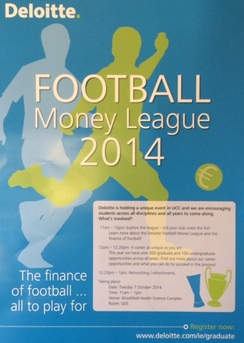
On Tuesday 7th of October 2014 Austin Houlihan, Senior Consultant in the Sports Business Group of Deloitte will give a talk on football finance in Brookfield Health Science Complex, Room G05 from 11.00 to 12.00.

Austin is better known as the project manager of the Deloitte Football Money League and author of the Deloitte Annual Review of Football Finance. 

The event promises to be an excellent chance for those interested in sport, economics, finance or a blend of all three to get to know the industry better.


0 Comments

Price Discrimination & Tottenham Hotspur

29/9/2014

 
By David Butler

The sports industry provides economists with great examples of non-uniform pricing. Previously I considered this in light of the price of the England Shirt for the 2014 World Cup.

Theoretically, non-uniform pricing occurs when a monopoly or price setting firms with market power adjusts the price of a product based on information they hold on consumer demand. By setting one price a firm can lose out and incur what economists refer to as a deadweight loss,. This  is an economically inefficient scenario as a set of consumers can be made better off while not making others worse off. So by using infomation on demand and changing prices (or by having some form of non-linear pricing stratregy) for a set of customers a firm can increase its revenue. Economists generally favour non-uniform pricing as the inefficiencies usually associated with monopolies can be lowered and the welfare of consumers can be raised. The most common type of non-uniform pricing is price discrimination. Essentially, this practice involves charging different prices to different customers for the same product.

When it comes to entering sport stadiums the complexity of price discrimination is remarkable. We’re used to seeing different but simple price structures for Children, Students, Adults and OAPS for many products and services but when it comes to the sports matches the strategy clubs apply are sophisticated to say the least.  

I've taken Tottenham Hotspur's Premier League prices as an example - I’m sure its very similar for other elite clubs throughout sport. Strictly speaking the club have a monopoly on their product as I can’t see Tottenham live anywhere else. While one could substitute to Arsenal, Chelsea or Liverpool etc. their monopoly rights are usually conferred to them by the passion and ideology of the supporters.  

Below is the price structure. Firstly, there are 14 different types of seats you can access at White Hart Lane depending on your age (under 18 or over 65) and your preference for a view of the product. The better the view, the more you pay. Secondly there is three different types of ‘match categories’ that price discriminate in terms of the quality of the opposition. Just like your seat, there is a positive relationship between opposition quality and the price you pay.  Having prices range from 17.00 to 81.00 pounds over a season squeezes consumer surplus and White Hart Lane is generally sold-out.
Picture
Tottenham Hotspur - Premier League Prices 2014/2015
The interesting thing is that if costs allow it firms may have an incentive to make their products imperfect. if you ever wondered why clubs have ‘bad views’ in their stadium, economics may hold the answer. They may be intentionally 'bad' relative to others so clubs can price discriminate. This is what’s called ‘product sabotage’ and happens in many industries. As Tim Harford explains here the best way to make a slow printer is to make a fast one and put a chip in to slow it down! Food for thought for Tottenham Hotspur as they look to build a new stadium.

The trade effects of the FIFA World Cup

29/9/2014

0 Comments

 
by Declan Jordan
Picture
There is a sizeable literature on the economic impacts of major sporting events. Robbie Butler has shown in previous posts such as here and here that the evidence suggests that hosting major sports events, such as the World Cup and the Olympics, rarely pay for themselves financially.

There is an interesting contribution to the literature on the economic effects of hosting major events in the latest issue of Kyklos. An article by two Turkish economists, Veysel Avsar and Umut Unal, looks at the effects on trade between host and participating countries at FIFA World Cups. The article can be accessed here, though there is open access earlier version on SSRN here.

The paper finds strong evidence for a trading effect of the World Cup using bilateral trade data for 196 countries between 1950 and 2006. Pointing to the showcase effect of hosting the World Cup and the opportunities it provides for developing networks and trade channels, the paper finds that the World Cup significantly increases exports from participant countries to host countries and that trade is higher for host participant pairs compared to other country pairs. The authors find that the effects are decreasing over time. A personal view is that this may reflect the diminishing importance of showcase effects as the cost of information and communication diminishes in an increasingly digital society.

The paper is an interesting contribution to the literature and points to economic effects that may be under-appreciated or overlooked in the studies of big event impact analysis.

0 Comments

The Premier League, National Talent & 'Elite Clubs'

27/9/2014


By David Butler

This is the final instalment on an issue I previously wrote about here and here that considers the nationalities of footballers in European Leagues. It's probably worth reading the first of these entries to put this piece in context.The scoop so far is that the Premier League has the lowest amount of Non-EU footballers when compared to the other big European leagues but does however have far more players from the EU that are not home grown.

The argument could be made however that home grown talent does get an opportunity in the Premier League but not with elite Clubs. Looking at the Premier League, Leicester City has the most English players on the books, followed by West Ham and Crystal Palace, none of whom would be considered elite. So does this argument stack up and are the elite clubs the source of the problem?

To answer this I defined an elite club as one having qualified for a European competition for the 2014/2015  season.Table 1 below distinguishes elite and non-elite clubs across the ‘Big 5’ European Leagues.  While there is smaller samples for the elite clubs, the results are considered as a percentage of the total and are as follows:

La Liga: There is very little difference between elite and non-elite in Spain. Indeed the elite clubs have about 4% less players coming from non-EU countries when compared to the non-elite.

Bundesliga: Once again there is very little in the difference. The elite clubs have marginally less national players
and marginally more Non-EU players.

Premier League: Unsurprisingly, the non-elite clubs have 12% more national born players than the elite. The elite have just over 5% more non-EU players than the non-elite clubs. Further evidence perhaps that the elite in England are seeking out the best players from inside the EU.

Seria A: The elite clubs have far fewer national born players (over 18%) than the non-elite. Elite clubs also have 8% more players from Non-EU countries.

Lique 1: In terms of national players both elite and non-elite have a similar squad composition. Like La Liga, more players in elite teams come from inside the EU than from Non-EU countries.

If the data for the 'Big 5' Leagues is aggregated for both elite and non-elite have approximately a 70/30 nationality split. That is, regardless of whether or not you are an elite European club (as defined by your qualification for the Champions League or Europa League) 7 out of 10 of your players come from the EU. Elite clubs do however have approximately 7.5% fewer national players however when compared to the non-elite.

All in all, it doesn't seem to be the case that just elite teams are the ones importing non-EU talent to take the place of national born players.

Picture
Table 1

A Prediction for Kilkenny Versus Tipperary

26/9/2014

0 Comments

 
By John Considine
Tomorrow Kilkenny and Tipperary face-off in a replay of the All-Ireland hurling final.  It is very difficult to predict who will emerge victorious.  Most of us will provide a range of reasons why we believe one or other of the teams will be successful.  After the event we can often convince ourselves that we saw something coming.  However, those journalists who commit their predictions to print don’t have that escape route.
 
One such journalist is Emmet Ryan who writes a column called “The Spread” that features every week in The Sunday Business Post.  The column examines the betting associated with various sporting events.  Emmet puts his head on the block each week by providing the reader with a suggested bet.  Unfortunately for those following his GAA advice, his success rate for the latter stages of the All-Ireland series in hurling and football has not been good.
 
Emmet suggested punters go for a Kilkenny win in the hurling final at odds of 4/5.  The sides ended level.  Last week he advocated the selection of Donegal at 8/11.  Kerry won and the bet went down.  Except for the Dublin –Donegal football semi-final, he had little success at the semi-finals stage (I don’t have a record of his prediction for the Dublin-Donegal game).  In the hurling semi-finals he suggested the punters should take Limerick at 5/2 and Cork at evens.  Kilkenny and Tipperary triumphed.  In the drawn football game between Kerry and Mayo, Emmet opted for a Mayo win at 10/11.
 
It is to Emmet’s credit that one can read his columns after the event and believe the result should have gone the way he predicted.
 
I performed little better in my prediction for the drawn Kilkenny-Tipperary game.  My prediction was made with approximately 60 minutes of the 70 minutes elapsed.  With Kilkenny 4 points ahead of Tipperary, I turned to my nephew and said “put the house on a Tipperary win”.  I was convinced it was inevitable.  Fortunately, no money was wagered or lost.
 
My prediction for tomorrow’s game has to do with the attendance.  The table below shows that the replays of 2012 and 2013 attracted more spectators than the drawn games (although smaller TV audiences).  In 2012 the replay was on a Sunday.  Last year the replay was a Saturday evening game - just like tomorrow.  One of the reasons for the greater numbers at the replays is the decision of the GAA to reduce ticket prices for the replays.  This limited evidence suggests the attendance tomorrow will be greater than it was three weeks ago.  I'm not so sure.  Prior to the drawn game there were stories of tickets being returned to Croke Park (see how tickets are distributed for sale here). The availability of tickets in the surrounds of Croke Park three weeks ago suggests the demand for another Kilkenny-Tipperary game was down on previous years.  A cracking drawn game may restore the desire of the fans.  However, I'm predicting a decline in the numbers attending tomorrow.

Picture
0 Comments

The Trend In Ryder Cup Points

25/9/2014

 
By Robbie Butler

Today marks the eve of one of my favourite events in sport; the Ryder Cup. While I would not consider myself a regular viewer of golf on TV (except for the Majors) my fascination with the Ryder Cup goes back to 1991 and ‘that putt’ by Bernhard Langer. Defeat at Kiawah Island in South Carolina that year sparked my interest in the event and I couldn't wait for the next bruise-up between the two teams.

1993 was no different. Team USA proved too strong in the single pairings and ran out 15-13 winners at the Belfry. However, this was the last time the USA tasted victory on European soil. In the 8 Ryder Cups that have followed, Team USA has managed to win just two (1999 and 2008). In fact, since Europe's defeat at the Belfry, the team has enjoyed somewhat of a golden era which included crushing defeats of their American counterparts at Oak Hill, NY in 2004 and our very own K Club in County Kildare in 2006, both by a margin of points 18.5 to 9.5.

The data suggests Europe is on the up also. The graphs below plots the number of points each team has won since the competition became USA versus Europe in 1979. The first graph included Europe’s run away wins in both 2004 and 2006. The second graph excludes them (for purposes of the trend). 
Picture
Picture
Regardless of the graph, Europe’s points are trending upwards; the USA downwards. Since 1979 the USA has won a total of 216 points, with a mean of 14.4 points per tournament. Europe has won a slightly less 204.5 points, with a mean of 13.63. 

Remember 14 points are all that is required to retain this Ryder Cup. Let’s hope the 2014 European team can continue the upward trend and push that average even closer to the magic number 14.

Further Points: Nationality and Workplace in Football

24/9/2014

 
By David Butler

Last week I showed that the Premier League has the lowest amount of Non-EU footballers when compared to the other big European leagues – Serie A, Lique 1, Bundesliga and La Liga. The take home message was that it's not the arrival of non-EU players but the arrival of those from inside the EU that is the greatest impediment to young English talent getting an opportunity to play in the Premier League.

Here are more details on the topic based on a dataset of 2,751 footballers across the five European leagues.

1. The Premier League has over double the number of footballers (231) from the EU but not from England when compared to the other big four of Italy (107), Germany (102), Spain (57) and France (55).

2. The worst ‘offenders’ for having Non-EU talent on the books are primarily in Italy. The top clubs in the overall list are Inter Milan with 61.5% of Non-EU players and joint second Verona and Lazio at 52%.

3. The only club out of the 98 to have no Non-EU talent is Athletic Bilbao in Spain who have 25 Spanish players out of a 26 man squad. This club is known internationally for its 'cantera' policy of bringing through Basque players.

4. In terms of not having national talent on the books, Chelsea are bottom of the list of the 98 clubs, followed by Arsenal in second last position. Premier League clubs make up 4 of the bottom 5, with Swansea and Manchester City being 4th and 5th last respectively.

5. Just looking at the Premier League, Leicester City has the most English players on the books, followed by West Ham and Crystal Palace. 

As a final note on this issue I will breakdown the data for elite clubs (playing in European competitions) versus the rest. A caveat on the issue is the argument that young talent is getting an opportunity in smaller Premier League clubs but not the big ones.

Where Eagles Dare - Clean Sheets Helped To Bed In Palace

23/9/2014


By Ed Valentine

What would you say is the most memorable defensive performance in football history? The 2010 Champions League semi final second leg between José Mourinho’s Inter and Barcelona is a famous example as the Nerazzurri maintained strict defensive discipline and sacrificed possession to win 3-2 on aggregate. Or what about Jan ‘The Man Who Stopped England’ Tomaszewski of Poland who denied England a place at the 1974 World Cup with a sensational display of goal keeping? Liverpool fans may champion the reds’ defensive efforts, specifically those of Bruce Grobbelaar, for their performance during ‘that night’ against Roma in 1984.

There are countless other examples and though each is just as memorable as the next it’s likely to be a one off 90 minute display. A sustained season long demonstration of defensive strength is a different proposition entirely. Last season the stand out performers in the EPL were Crystal Palace.

The 2013-14 campaign saw 232 clean sheets kept among the 20 Premier League sides which worked out at about .61 per game or roughly two in every three matches. What is striking is that clean sheets have a different value for each team. Liverpool won every time their opponents failed to score while Swansea’s clean sheets* were more or less redundant as they were not involved in a single 1-0 win and had just one goalless draw. This puts a time specific emphasis on when teams get points from clean sheets e.g at 1-0 being more valuable than at 4-0.

* This does not take into account other factors or dynamics that occurred in specific matches and is not a 100% reliable metric.

Picture
Palace’s ability to keep their opponents at bay during goalless draws and 1-0 leads kept them in the Premier League. No other team put together more 1-0 wins which is perhaps the stat that got them out of trouble. This was in part due to Tony Pulis employing a defensive minded 4-4-1-1 formation in a number of key matches with Mile Jedinak making 133 tackles and 139 interceptions across the season. Nobody in the Premier League made more successful tackles or interceptions during the campaign. Average blocks, clearances and interceptions per game went from 54 pre-Pulis to 64 during the Welshman’s reign while they also managed to score first in 42.1% of their games which put them firmly in the mid table. It will be interesting to see how the Eagles measure up this season under a different managerial regime.

Despite keeping 12 clean sheets Norwich found themselves in the bottom three. Relegation under these circumstances demonstrates that they did not score enough in key matches throughout the season. Although West Brom, who avoided relegation by finishing one place and three points ahead of The Canaries, kept five less clean sheets they did manage to win 1-0 at Carrow Road which further highlights the time specific importance of keeping opponents at bay – this was the result, arguably, that kept the Baggies in the Premier League.

Abu Dhabi’s billions may virtually guarantee a Premier League challenge but at the foot of the table clean sheets can help managers rest easy.

All data courtesy of Opta.

Contact Injuries: Scrums, Tackles and Body-Checking

22/9/2014

0 Comments

 
By John Considine
Picture
In June the British Journal of Sports Medicine (BJSM) published a paper on the cost-effectiveness of removing body checking from youth ice hockey.  The paper by Sarah Lacny and colleagues compared the injuries, and associated costs, of two Canadian regions.  Quebec banned body-checking in ice-hockey (11-12 years) three decades ago whereas Alberta only change in line with national changes in recent years.  Not surprisingly, the authors found that there were less injuries and costs in Quebec than in Alberta.  These are important findings for a country where "sports injuries accounts for 66% of youth injuries".

Possibly less important, but nonetheless interesting, is the difference brought about by professionalization in rugby union.  Another 2014 BJSM paper examines the injuries to the shoulders of French Rugby Union players for 2008-2013.  The paper presents a fascinating range of comparisons.  For example, professional rugby players that suffer a shoulder injury during a tackle with an opponent differ from non-professionals.  In professional rugby it is the tackler that is likely to suffer whereas it is the tackled player that suffers more injuries outside the professional game.  Yohan Bohn (Racing-Metro 92) and his co-authors show that the incidence and severity of shoulder injuries increases with age.  The relative importance of shoulder injuries also vary with gender.

In terms of positions on the rugby team, the positions most likely to suffer shoulder injuries are third row (back row) forwards, front row forwards, and centres.  The presentation of the injuries by positions is slightly misleading because there are three front row forwards, three back row forwards, but only two centres.  Therefore, it is not surprising to find that the positions with the lowest incidence of injuries have only one player - full back, scrum-half, and fly half.  It is a pity the injuries were not listed by player number/position for all fifteen players.  This is done for front-row forwards and it shows that players wearing number 1 have the highest shoulder incidence among front row forwards.  Next up is the player wearing number 3 and then the player carrying number 2.

The player carrying number 2 is the hooker.  Number 1 is known as a loose-head prop and number 3 is known as a tight-head prop.  As the players lock heads, the hooker and tight-head prop have an opponents head to either side.  The loose-head prop is bound by only one other player.

At scrum time the hooker is positioned in the middle of the three front row forwards as they collide with the opposition.  It seems this position protects the hooker from injury at scrum time according to a third BJSM paper.  Alison Taylor, Simon Kemp, Grant Trewartha and Keith Strokes examined scrum injury risk in English professional rugby.  The hooker sustained 15% of the reported scrum injuries.  However, the average for the other two front row forwards was 36.5% each.  This is a massive 88% of reported scrum injuries falling on 3 of the 8 players involved in the scrum.  The most interesting fact of all is the coincidence between injury, player position and whether the scrum collapsed or not.  Almost 91% of the injuries to loose-head prop forwards were associated with collapsed scrums.  By contrast, 62.5% of injuries to tight-head props, and 83.3% of injuries to hookers, occurred when the scrum did not collapse.  As to the reason for this difference, the authors call for more research.  It is a pity they did not speculate on the reasons.

0 Comments

RTE Radio One Interview

22/9/2014

 
Robbie Butler was an invited guest on the Marian Finucane Show on RTE Radio One. Robbie discussed the potential economic benefits of Ireland’s successful application to host games during the Euro 2020 Finals and the recent FIFA commissioned report into World Cup 2018 and 2022 bid corruption.

His contributions can be heard here and start 1 hour 17 minutes into the show.
<<Previous

    Archives

    December 2022
    November 2022
    October 2022
    September 2022
    August 2022
    July 2022
    June 2022
    May 2022
    April 2022
    March 2022
    February 2022
    January 2022
    December 2021
    November 2021
    October 2021
    September 2021
    August 2021
    July 2021
    June 2021
    May 2021
    April 2021
    March 2021
    February 2021
    January 2021
    December 2020
    November 2020
    October 2020
    September 2020
    August 2020
    July 2020
    June 2020
    May 2020
    April 2020
    March 2020
    February 2020
    January 2020
    December 2019
    November 2019
    October 2019
    September 2019
    August 2019
    June 2019
    May 2019
    April 2019
    March 2019
    February 2019
    January 2019
    December 2018
    November 2018
    October 2018
    September 2018
    August 2018
    July 2018
    June 2018
    May 2018
    April 2018
    March 2018
    February 2018
    January 2018
    December 2017
    November 2017
    October 2017
    September 2017
    August 2017
    July 2017
    June 2017
    May 2017
    April 2017
    March 2017
    February 2017
    January 2017
    December 2016
    November 2016
    October 2016
    September 2016
    August 2016
    July 2016
    June 2016
    May 2016
    April 2016
    March 2016
    February 2016
    January 2016
    December 2015
    November 2015
    October 2015
    September 2015
    August 2015
    July 2015
    June 2015
    May 2015
    April 2015
    March 2015
    February 2015
    January 2015
    December 2014
    November 2014
    October 2014
    September 2014
    August 2014
    July 2014
    June 2014
    May 2014
    April 2014
    March 2014
    February 2014
    January 2014
    December 2013
    November 2013
    October 2013
    September 2013
    August 2013
    July 2013

    About

    This website was founded in July 2013.

    RSS Feed

    Categories

    All
    American Football
    Athletics
    Baseball
    Basketball
    Behavioural Economics
    Boxing
    Broadcasting
    Competitive Balance
    Cricket
    Cycling
    Darts
    David Butler
    Declan Jordan
    Drugs
    Ed Valentine
    Epl
    Esports
    Expenditure
    F1
    Fifa World Cup
    Finances
    Funding
    Gaa
    Gaelic Games
    Gambling
    Game Theory
    Gary Burns
    Geography
    Golf
    Greyhound Racing
    Guest Posts
    Horse Racing
    Impact Studies
    John Considine
    John Eakins
    League Of Ireland
    Location
    Media
    Mls
    Mma
    Olympics
    Participation
    Paul O'Sullivan
    Premier League
    Regulation
    Research
    Robbie Butler
    Rugby
    Simpsonomics
    Snooker
    Soccer
    Spatial Analysis
    Sporting Bodies
    Stephen Brosnan
    Swimming
    Taxation
    Teaching
    Technology
    Tennis
    Transfers
    Uefa
    Ufc
    World Cup
    Wwe

Related

The website is not formally affiliated to any institution and all of the entries represent the personal views and opinions of an individual contributor. The website operates on a not-for-profit basis. For this reason we decline all advertisement opportunities. 

Contact

To contact us email sportseconomics2013@gmail.com or find us on Twitter @SportEcon.