By Robbie Butler
Yesterday UEFA announced the 13 cities that will host the 2020 European Championship Finals. In a break from tradition, over a dozen different countries will share the hosting of the event on the 60th anniversary of the first staging of the competition.
Thankfully for the FAI and Irish football supporters, Dublin was included on the list of cities and will host 3 Group games and 1 Round of 16 knockout match. FAI CEO John Delaney was quick to point out that Ireland’s technical bid was ranked 3rd highest among the 19 entrants, with only Germany and England scoring higher.
Speaking on RTE Radio One, Delaney went on to add that the bid will be worth “tens of millions” to the Irish economy. Later in day, I heard the CEO speak again but he correctly caveated his thoughts on the economic benefits by pointing out that Ireland Inc. will probably do better if Ireland are not playing in Euro 2020 matches located here.
Gina Quinn of the Dublin Chamber of Commerce had similar thoughts estimating that the tournament could be worth between €50m-€100m to the city “depending on which teams are drawn to play in Dublin”.
One thing is for sure, Dublin is the big winner. Even if Ireland do play in the Aviva, businesses in the capital will benefit. Of course, Dubliners attending the games will add little or nothing to the local economy (they are there anyway!) but everyone else will inject money into the local economy, even the non-Dublin Irish.
This is almost identical to the Garth Brooks soap opera during the summer. Many speculated that the cancellation of the concerts had cost Ireland Inc. millions in lost consumption, tax revenue employment, etc. Dublin certainly lost out. But the Irish economy only lost that money that was coming from abroad. While this is no doubt sizable, this group was very much in the minority. The Irish simply did something else with the refund they received from Ticketmaster. No doubt Galway (the races were on that week) was a big hidden winner.
The Irish economy will benefit most from these four games if Ireland is not involved in the matches. Spain, France, Germany and England would be great teams to have located here as they have a massive support base. No doubt Irish people will (and should) attend the matches but access to tickets will be more difficult. The result being, an influx of foreign money into the economy.
As for me, I’d take Ireland in every game at the Aviva and forgo the money. For those of us lucky enough to remember places like Stuggart and Genoa, you’ll know there are some things that money can’t buy.
|
0 Comments
By David Butler This week the chairman of the Football Association in England, Greg Dyke, outlined new proposals that are intended to restrict the number of non-EU footballers playing in England from next season. Details on the proposal can be read here. Hopefully the evidence presented in this article can convince the FA to reconsider the proposal. Mr Dyke is quoted by Sky Sports as saying “We hope the result is something like 50 per cent less players from outside the EU will come and play here and the aim, of course, is that we hope that some of those slots in the squads will go to younger English players”. Given this disclosure, it is fair to say the proposal is designed to provide more opportunities for young English talent. As I will explain, the problem is that Non-EU footballers are not the primary cause of young British talent failing to get an opportunity in the Premier League. In relative terms the Premier League has the lowest amount of Non-EU footballers when compared to the other big European leagues – Serie A, Lique 1, Bundesliga and La Liga. Table 1 below shows the statistics for the distribution of EU and Non-EU born footballers across these leagues as a percentage of the total footballers in each league for the current season. I accessed nationality data for 2,751 footballers from the international sports website Goal.com. 29% of sample in the 5 leagues held nationalities outside of EU states while footballers that held the nationality of the country they worked in made up 50% of the sample. 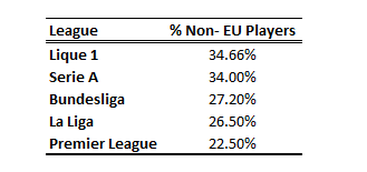 Table 1 This first table above shows that as a percentage of total footballers in a league, the Premier League at 22.5%, has the fewest Non-EU players or ‘imports’. The crux of the problem for the FA is unfortuntely something they cannot prevent. This is not the arrival of non-EU players but the arrival of those from inside the EU. As Table 2 and 3 below show, the Premier League has the highest percentage of players born in the EU when compared to the other Big 4 leagues (as would be expected in light of table 1) but the lowest percentage of national born footballers playing in the league. The arrival of European talent to the shores of England happens more often than it does in Spain, Germany, Italy or France. 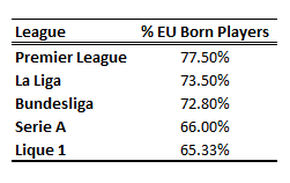 Table 2 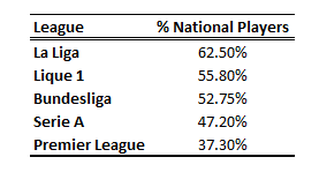 Table 3 The FA should be aware that preventing Non-EU players from coming to England will not solve the problem of young English footballers failing to get an opportunity in the Premier League.  By Robbie Butler
In a recent post David Butler looked at the impact of rule changes on football. One such rule change he considered was the “back pass rule”. The Guardian provide an excellent overview of the rule change and quote Jonathan Wilson’s The Outsider: A History of the Goalkeeper who said "A general rethink about the laws of the game had been promoted by the negativity of the 1990 World Cup and, in particular one passage of play in the group match between the Republic of Ireland and Egypt in which the Irish keeper Packie Bonner held the ball for almost six minutes without releasing it." Following 'negative' tactics at Euro 1992, FIFA changed the rules of the game and forbid goalkeepers from picking up deliberately back passes. According to The Guardian, the game was subsequently changed forever. The rule change which banned the back pass was introduced so that there would be less time-wasting, more attacking play and ultimately more goals. I've collected some data to see if this is so. A word of warning, this data covers just two seasons and more research is required to see if this holds up. The table to the left presents data on the number of goals in six of the seven top European leagues in the last year of the old rule (1992) and the first year of the new back pass rule (1993). The German Bundesliga is omitted as the league changed from 20 to 18 teams in 1993. The results are very interesting. All six divisions show an increase in the number of goals scored despite the fact the number of games remained constant. In the case of Seria A (Italy), a notoriously defensive league, 163 more goals were scored in the season after the rule change was introduced. The institutional change appears to have worked. More research required… By John Considine  If I did not force myself away from the television then I could watch hours of coverage of the major cycling tours. I can't fully explain the attraction. Maybe it is the scenery, the blur of colour, or the fact that I became hooked when Irishmen like Sean Kelly and Stephen Roche were at the top of the sport. Whatever the reason, there are some days that provide compelling viewing. Last Saturday was one such day. The Vuelta a Espana entered its second last stage. In all probability the winner would be determined on the Saturday. Sunday's final stage was a relatively harmless time trial - although the crash of Nairo Quintana a week earlier in another time trial meant anything could happen.
The last 12km of the race featured a gruelling category one climb. As the race arrived at this point the top five riders in general classification were at the front. It was now or never for each to improve their position. Each rider wanted to improve their position but going to the front risked doing the work for those they were seeking to overhaul. Fifth placed Fabio Aru did not seem in a position to attack and third placed, Alejandro Valverde, is not a noted mountain top finisher. Fourth placed Joaquim Rodriguez was the first to mount a serious attack. However, he was hauled back and passed. Then it was the turn of second placed Chris Froome to make his bid for glory. Froome attacked and race leader Alberto Contador tucked in behind him. Then as the finish approached, Contador left Froome in his wake and went on to win the stage (and effectively the Vuelta). The top 5 in general classification finished in that order on the climb to Puerto de Ancares. It was fascinating to see the rider decide when they needed to attack the position of the man in front of them on general classification. And, it was equally fascinating to see the rider being attacked see off the challenge before attempting a similar strategy against the rider ahead of him. An interesting aside on the incentives faced by cyclists arose from the Stage-20 commentary provided by Sean Kelly on EuroSport. Kelly and his co-commentator were discussing how cyclists tend to get back on their bikes as quickly as possible after a fall. I was surprised that Kelly compared this approach to that of footballers. It is slightly disappointing to find people from one sport complaining about those in another sport. I was disappointed that one of the sports people I most admire was taking such a line. My faith was restored in Kelly's very next sentence when he pointed out that cyclists get back on their bikes because there is little to be gained by staying on the ground. It was clear that Kelly was not complaining about footballers. Instead he was pointing out how both cyclists and footballer react to the incentives they face. By Robbie Butler England’s recent performance at the World Cup in Brazil led many to question whether an influx of foreign talent into the English Premier League was killing the national team. In early 2013 I collected data on the percentage of indigenous players playing in the top 3 European Leagues and the percentage of local players that played in Europe during the 2012-2013 season. The data is below.
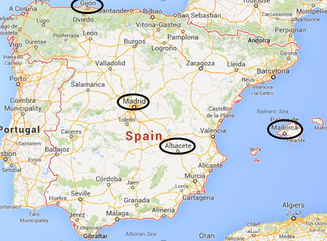
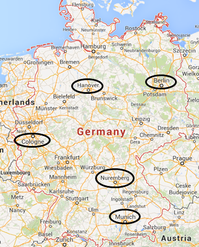
Not surprisingly, England had the lowest number of home nationals playing in its domestic league (36.7%). In the top flight in both Spain and Germany more than half of all players are from the home country. This then follows on into European competition with just over 5.3% of English players playing in the Champions League, compared to 8.7% Spanish and 8.8% Germans. Adding in the Europa League does nothing to change the ranking. Maybe this is the answer to England’s problem and maybe not. Here’s another hypothesis to ponder. The World Cup involves an awful lot of travel, first to the hosting country and then trips every few days to different locations. Teams need to be adept playing in many different environments and stadiums. Since the reconstruction of Wembly all English home matches have been played at the stadium. This is not true of Germany or Spain. For example, during the qualifying campaign, both Spain and Germany played their home matches in nine different stadiums (see maps below). No venue was used twice. The players had to get used to playing in different locations and in front of different people.
There’s a lot to be said for this approach. Firstly, the away team is more likely than not, going into a ‘new environment’. Even if they have played Germany or Spain in the recent past, it’s probably a different stadium. Secondly, players get used to travelling to different locations to play international matches. Thirdly, various parts of the country get to see the national side in action, possibly leading to a more representative fan base, as many sections of the population get to see their team in action.
Of course, this might all be rubbish too. I need to look at data for England during the redevelopment of Wembly? Something to ponder though.... By David Butler Not having the luxury of BT sports resulted in a trip to the local pub to watch the Arsenal vs. Manchester City match last weekend. The local barstooler was once again a source of inspiration as gents either side of the bar made claims of how Alex Ferguson’s Manchester United sides thrived after Christmas. I’ve heard this claim, or very similar ones, being made many times before and have always doubted their validity. So, is it the case that Fergie’s sides performed better in the new calendar year of a season when compared to the August to December period? If we look at it on a season by season basis the answer is no. In fact as the table below shows since the start of the Premier League (I can only access data from 1992 rather than the start of the Ferguson reign in 1986) Manchester United collected more points on average before January 1st (11 seasons) rather than after it (10 seasons). The years where they collected more points on average after the new year are marked in yellow. If we look at the mean points in total the differences are insignificant. From 1992 to 2013 Fergie managed 425 Premier League matches from August until December, accumulating 904 points. On average that's 2.13 points per match. In the New Year Fergie has managed 391 matches in the Premier League, accumulating 848 points, an average of 2.17 per match. So was it the case that Santa inspired Fergie’s Manchester United to improve their Premier League performance? The answer is no - given their finishing position they were pretty good all year round! The idea that United 'come good' in the new year appears to be another one for the myth list. 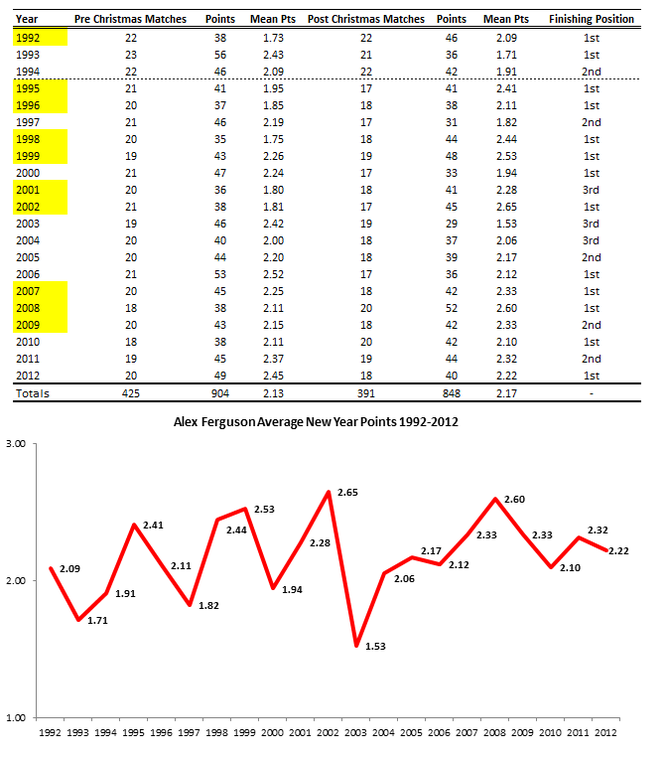
By John Considine Reflecting the slowdown in the Irish economy, sponsorship of Irish horse racing by industry declined dramatically between 2007 and 2010. The Horse Racing Ireland factbook shows that the 2010 figure for race sponsorship by all industries is down almost 60% on the 2007 figure. The collapse in sponsorship by the construction sector is more dramatic with the 2010 figure showing a 95% decline on its 2007 amount. The construction industry contribution peaked at 13.3% of the total sponsorship in 2005 but it has been below 1% for both 2012 and 2013. Exchequer tax revenue over the same 2007-2010 period also showed a dramatic decline with the 2010 figure down 33% on the 2007 figure of over €47bn. It also seems that the contribution of the construction/property sector to the Exchequer showed an even greater decline. One of the sources of Exchequer tax revenue is Stamps (a charge for "stamping" official documentation). In 2007 the vast majority of tax revenue under this heading arose from property conveyancing. As the demand for property declined so to did stamp duty (although not all property transfers are subject to the tax). Exchequer tax revenue from stamps dropped by 70% between 2007 and 2010. It would be nice to believe that the recovery of race sponsorship in 2012 and 2013 is due to a turnaround in the economic fortunes of the Irish economy. Unfortunately this may not be the case as the majority of the increase comes from media sponsorship. Media sponsorship was €107,250 in 2011. It jumped to €737,494 in 2012 and was €736,438 in 2013. A note on the 2012 amount says it contains SIS sponsorship. The improvement may be smaller than it looks in the chart below but it is heading in the right direction. 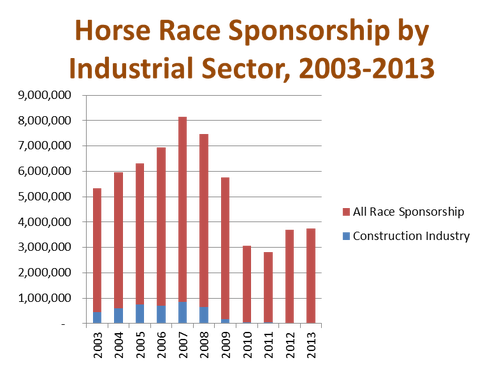
By Robbie Butler Here’s something fans of the League of Ireland should find interesting. Nearly 10 years ago a classmate of mine during my time as a masters student at University College Cork decided to investigate the impact of rule changes on the number of goals per teams and the number of goals per game in the League of Ireland since the 1921-1922 season. This work is an extension of his original inquiry. Below are two interesting graphs. The first charts the average number of goals per team during every completed League of Ireland season to date (1921-2013). Generally speaking the number of goals per team has tended to bob around the 40 goal mark over the course of nearly 100 years. There are infrequent instances of the average dropping below 30 goals or rising above 50. Interestingly, the lowest reported average since 1948 is recorded during the 1985-1986 season. This was the first season a second division was introduced to the league, resulting in both promotion and relegation. The rule change led to a sharp drop in the number of goals per team in the top division (an average of just 28.17 per team during that season) and appears to have reduced the amount of attacking play. In fact, the 1985-1986 season is the only campaign from 1948-1949 to the present that the average number of goals per team in the league fell below 30. 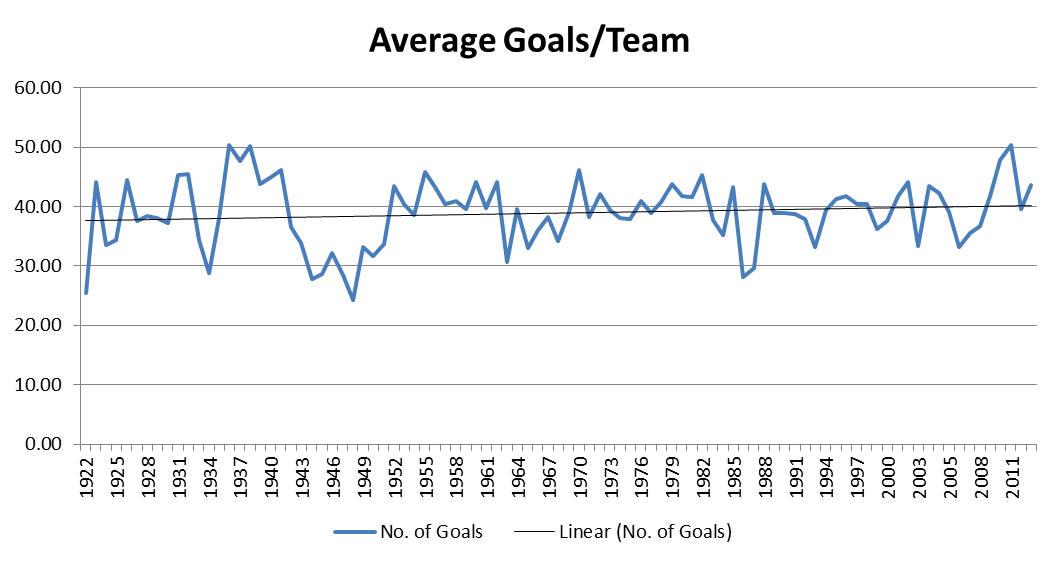
The second graph is slightly more worrying. This illustrates the average number of goals per season in the League of Ireland since 1921. The trend is very much downward. In the early days of the league, averages of more than 6 goals per game are reported. Since the 1981-1982 season, this average has not risen above 3 goals per game. It’s worth pointing out that the 1981-1982 season was the same year the League of Ireland trialed a system of 3 points for a win (as opposed to the normal 2 points). This was abandoned at the start of the 1982-1983. The goal per season average continues to decline until the end of the 1992-1993 season. However, since the 1993-1994 campaign the average has levelled off and is in fact experiencing a slightly upward trend. Why? Maybe it's because 3 points for a win was reinstated in the 1993-1994 season and has remained ever since. 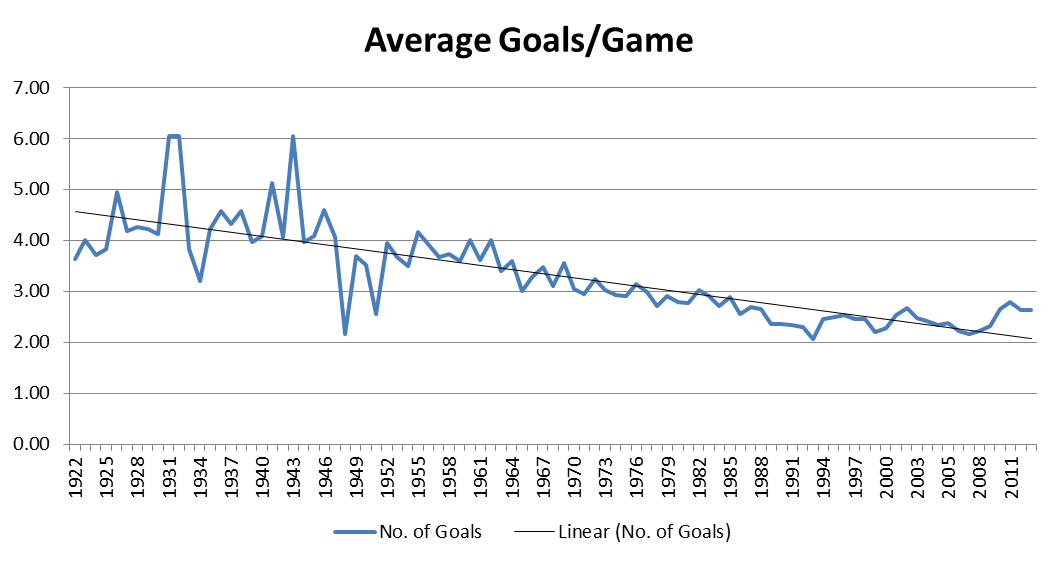
 By Robbie Butler As a Waterford man living in Cork one cannot be but impressed at the attitude Leesiders have towards their sports teams. Each spring Cork fans are probably the only ones in the country with realistic hopes that they can win both the Senior All-Ireland Football and Hurling Championships. Their annual stroll in the ladies football equivalent is twinned with a fighting chance in the camogie (women’s hurling) championship, meaning that in any given year all four titles do have an outside chance of coming to the Rebel County. League of Ireland fans will know Cork City aren’t doing too badly either. This season has probably been the best since the title winning season of 2005, with the Rebels just behind leaders Dundalk as the title race reaches its conclusion. While the soccer team is probably viewed as somewhat of a lesser brand when compared to the hurlers (especially in the city), here’s something to think about.  This year the Cork Senior Hurlers played five Championship games; two against Waterford, one against Clare, the Munster Final against Limerick and the All-Ireland Senior Hurling Semi-final against Tipperary. In total, 171,581 spectators saw them in action.
Assuming Cork bring 60% of the fans to each game (based on the fact they probably have a bigger fan base than most of the counties they played this year) this means just under 103,000 people supported Cork at their five championship games this summer. If we assumed a 50/50 split in the crowd, this number falls to 85,791. Fans of League of Ireland will know the supporter split at domestic games is far more unbalanced. I would estimate at the average game 90% of those attending are supporting the home team. Using this base, we can assume that just over 46,000 fans have supported Cork City in Turners Cross this season. That's a ratio of just above 1:2 in favour of the hurlers. Given the elite nature of inter-county senior hurling, the limited number of games the Cork Senior Hurlers play and the value placed on the Munster Senior Hurling Title and All-Ireland Senior Hurling title by Irish society, Cork City are doing very well to keep the ratio so close. It’s unlikely we will ever see 1:1 unless Cork City qualify for the group stages of the UEFA Champions League but we might be waiting a little while for that to happen. By John Considine  Yesterday was a significant day in Irish sport. The international soccer team played the first game of the 2016 European Championships against Georgia while Kilkenny and Tipperary played in the All-Ireland hurling final. The eleven Irish soccer players that started the game carried a range of squad numbers on their back, e.g. Stephen Ward wore the number 17. The fifteen players that started on each of the hurling teams had numbers 1-15, although not all of the players started in the positions their numbers indicated.
One of the keys to understanding the significance of the numbers the players wear is the duration of the "contract" between the player and the team. All three teams are representative teams. The Irish players represent their country while the hurlers represent their respective counties. Yesterday, they were in the team/squad for that particular game. It is unlikely that the team/squad composition for the next soccer international or the replay of the All-Ireland hurling final will be the same. The numbers are placed on the shirts to faciliate identification of the players by the referee, the spectators at the game, those watching on television, and those commentators who are relaying the game to those not in attendance. The sporting organisations also leverage the numbering by selling match programmes that list the player numbers for spectators - this is a relatively larger source of revenue for the GAA given its stage of commercial development. Unlike the situation in the GAA, the shirts of each soccer player also carried that player's name. For an international soccer international, like yesterday's game against Georgia, the prime reason is to facilitate identification of the player so that particular player can be separated from his colleagues. However, when these soccer players return to their clubs the name on the shirt helps with another form of identification that is important commercially. The replica kit market is based on the consumer identifying with the team and the player. Imagine a parent trying to convince their Liverpool supporting kid that another red shirt (Manchester United) suits them just as well. Very few economists would suggest that Liverpool and Manchester United shirt are in the same market (and the UK competition authorities agree - see previous post here). The kid might also identify with a particular player. Again the parent would struggle getting the kid to accept the number 24 (with or without Joe Allen's surname) if the kid wants the number 8 jersey of Steven Gerrard. The squad numbers assigned to the Irish players allowed the Irish manager to name his team closer to the start of the game than might otherwise be the case (as did the rule governing the naming of teams). In an interview on Saturday, Martin O'Neill explained how it was not his practice to name the team too early. Where a team is announced early then it might hand a strategic advantage to the opposition. Where it is believed the opposition obtain the team unofficially then it could be seen as breaching the rules (see Cardiff's complaint against Crystal Palace here). Assigning numbers to players in the GAA is becoming more strategic/tactical. Yesterday, all the players did not lineout in the positions their numbers would indicate. The teams were also announced closer to game-day than would have been the case 20 years ago. In recent years Kilkenny announce their team on the Friday before the game (as most people know Kilkenny do strategy/tactics but they differ from most in that they don't make a big deal of it). The fact that the players did carry numbers 1-15 probably reflects the fact that history matters. Kilkenny and Tipperary are two of the top three hurling counties in terms of All-Ireland success. It is harder to justify changing something that is working. For successful counties a change might be interpreted as fear of the opposition. In two weeks time Kerry play Donegal in the All-Ireland football final. Kerry are the most successful football county. They will probably line out 1-15 (although they have been less likely to do so recently). Donegal are more likely to have a number from outside 1-15 starting the game. Donegal have 2 All-Ireland title whereas Kerry have 36. The second title was secured a couple of years ago under a manager well versed in strategic and tactical innovation. That manager is still in charge. We have less than two weeks to see what happens. |
Archives
March 2024
About
This website was founded in July 2013. Categories
All
|


 RSS Feed