The Economics of Sport
  • Sports Economics
  • About
  • Workshop
  • Selected Publications
  • Book Reviews
  • A Primer on Gaelic Games
  • Upcoming Events
  • Media
  • Education
  • Resources & Links
  • Data

Declining Sport Viewership for Millennials?

30/11/2016

 
By David Butler

Live sports broadcasting is often thought of as resistant to traditional competitive pressures usually seen on the TV platform. A recent survey may have cast some doubts on this view. The London based analyst firm Ampere conducted a 32,000-person survey across Europe and the US revealing that this resistance to competition may be demographic specific. In particular, younger viewers (identified as millennials, usually 18-24) appear to have a lower identification with sport when compared to older age groups. Those aged 35-44 identify the most with the statement ‘I love sport’.

The hunch is that the range of free online content may be enticing millennials away from watching live sport. The argument goes that the allure of Facebook, Twitter, Reddit and YouTube to name but a few is changing the preferences of millennials when it comes for consuming media. In a nutshell, they may be substituting away from consuming live sports and engaging with other forms of media, in particular social media. The question is whether this a worry for companies like Sky and BT going forward as these firms often rely on subscriptions for revenue.

Perhaps these trends reflect a wider pattern in technological development – millennials are maybe more familiar with ‘screens’ outside of the traditional television. The challenge for Sky and BT may be more so about getting onto the tablets and phones of young consumers, a domain where it is often quick and easy to get ‘free’ content. Many are not used to paying for media content on these screens.

I think major broadcasting companies have already identified this problem and the ‘switch to streaming’ seems already underway. Indicative of this is the almost instant access to live goals on smart phones via Sky Sports subscriptions. I think this form of almost instant access is only going one way with the progression of online technologies. Creative destruction often knows no bounds. Match of the Day maybe the victim, maybe we will look back and think how we had to ‘wait’ until 10.30 to see the goals…
Champions League Returns

28/11/2016

0 Comments

 
By Robbie Butler

Those familiar with this website will know regular blog contributor Ed Valentine is for the past season and a half attempting to “beat the bookies”. This year Ed’s strategy has changed from one where the number of teams open to him was limited, to one where he can pick any winner.

We have spoken at length about this and I am still not convinced it is possible to “pick winners”. Ed is attempting, with some degree of success, to prove me wrong. I am more of the view that a systematic approach to “beating the bookies” could yield success.

I was struck during the week that seven of the sixteen Champions League Week 5 games end in draws. This included five of the eight games on Wednesday. Those familiar with sports betting will know the “draw” outcome is rarely favourite.

So far 80 Champions’ League group games have been played. The home win, away win, draw distribution reads 30:25:25. This is different to most other football leagues, where home teams are found to win between 40% and 50% of the time.

I decided to see if a pure strategy could yield a positive outcome. A pure strategy is one where you don’t deviate from your chosen course of action – in this case backing all draws.

Using data from Odds Portal, we can know the average odds of 15 bookmakers on the 80 Champions League matches played to date.

A pure draw-strategy, where €1 was placed on all 80 games would have yield a net return of €25.16. A pure away-win strategy would have yielded a net return of €17.65. A pure home strategy yields a net loss of €20.83. 
0 Comments

The Hennessy Gold Cup - Attendance & Bookies

23/11/2016

 
By David Butler

The Hennessy Gold Cup takes place at Newbury this weekend. The race, which was transferred to Newbury in 1960, usually attracts a big crowd to Berkshire. The relationship with the Hennessy brand and the Gold Cup is enduring one. Last year the total purse for the race was £200,000 with the winner scooping £113,900.

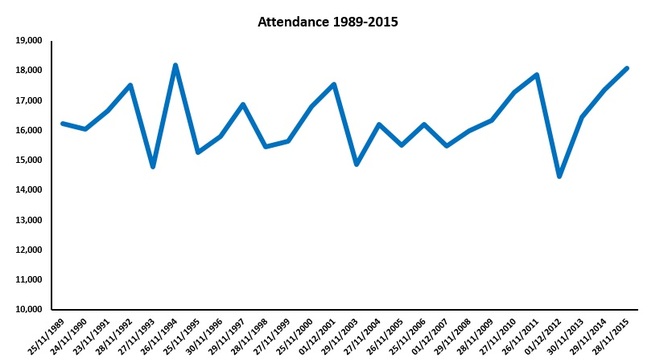
It seems that the attendance of racegoers to the November meeting holds just as an enduring relationship. The attendance trend below reveals that last year’s Hennessy Gold Cup recorded the largest attendance to date, 18,083. The average attendance at the event is over 16,000 (from 1989-2015) and appears to have grown during the most recent recessionary period in the UK.
Picture
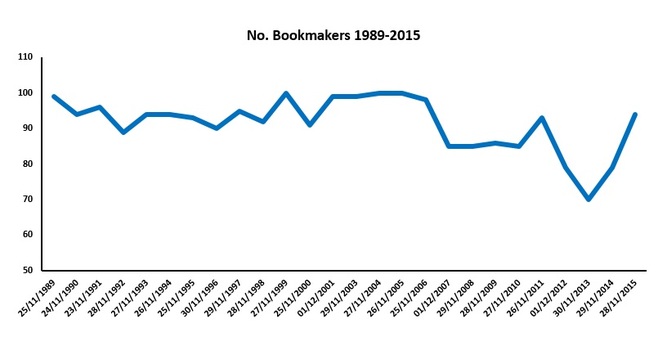
The impact of the Great Recession can perhaps be seen when we consider supply side variables such as the bookmakers on course. Maybe this is also a proxy of economic activity on course and the strength of the market.

​The graph below displays the trend in the number of bookmakers on course for The Hennessy Gold Cup. While interpreting the number of bookies on course as a proxy for the economic impact is problematic, primarily due to the advent of online gambling, last year the number almost returned to the levels prior to the Great Recession. A noteworthy fall occurred in 2007.
Picture

Comments on Irish Footballers, the Evolution of the Premier League & the Irish International Football Setup.

21/11/2016

 
David Butler

Yesterday I had a general chat with Darren Frehill and Damien O'Meara on RTE’s Sunday Sport programme (starting at approx. 3.14) about the impact of the globalising labour markets (for Irish footballers) and inter-generational career trajectories (for Irish footballers). In addition, we spoke about Ireland’s Rugby World Cup bid.

On the former issue one question that arose was whether there are now less Irish players playing in the first tier of English football due to the internationalisation of the competition and the increasingly competitive labour market.

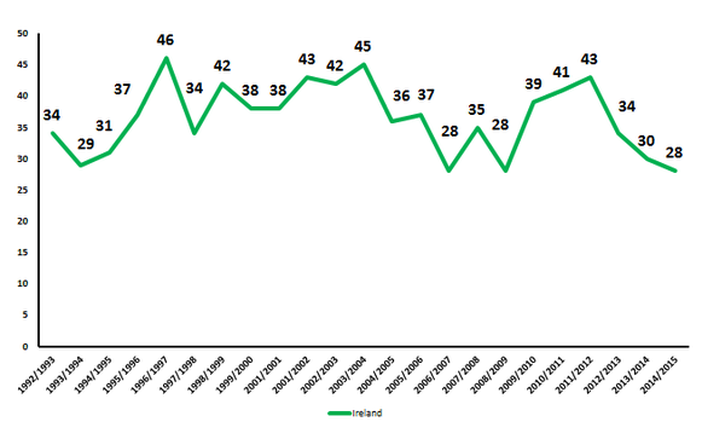
The points and charts below reveal some of the key information from 1992/1993 to 2014/2015 for Irish players in the Premier League.
  • The most Irish players to be contracted to Premier League clubs in any one season was 46 in 1996/1997. The joint lowest amount was 28 (Fig 1.)
  • The trend in the number of Irish in the Premier League is cyclical, spiking in the mid 90's, early 00's and early 10's.
  • Since 1970 the pool of Irish International players has grown from approximately 34 in 1970 to 72 in 2015. This has increased the number of ‘top tier’ players absolutely, but not proportionally, since approximately 1985.
  • The clubs these players are contracted to have altered, with far more Irish players now contracted to traditionally lower ranked clubs and generally participating in more loan moves during their career.
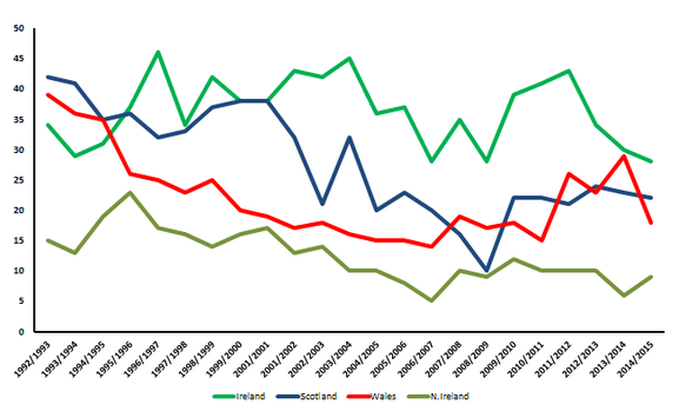
  • Irish talent is still preferred to that of other British Isles countries. For the vast majority of the Premier League, there has been more Irish players in the Premier League when compared to Scots, Welsh and Northern Irish. Scotland and Wales both saw a downward trend in their numbers since 1992/1993. This has reversed since 2008/2009 for Scottish players and since 2010/2011 for the Welsh (Fig 2.)
Picture
Fig 1. The number of Irish players in the EPL by season 1992-2015
In terms of the international team and the selection of domestically based players, the number of League of Ireland footballers in the international setup has fallen from 14 in 1970 (approx. 40% of the squad) to the inclusion of 5 or fewer since 1990. The key turning point was seen during the reign of Eoin Hand, where the international team switched to be one where most call-ups were born in the UK. Perhaps, the major psychological shift could even be traced earlier when the Manchester-born Shay Brennan was the first non-domestically born player to be called into the Irish squad in 1965.

Under the control of John Giles and Liam Tuohy the  international team was largely compiled of Dublin born players. Eoin Hand changed this. Jack Charlton then became famous for actively courting and recruiting UK-born Irish by exploiting the ‘granny rule’ and making us more competitive internationally.  As they say, the rest is history.
Picture
Fig 2. EPL Imports from the British Isles 1992-2015

Thoughts on Ireland 2023

19/11/2016

0 Comments

 
By Robbie Butler

Ireland’s 2023 Rugby World Cup bid took another step forward recently when the list of venues were revealed by those behind the bid. From the event a number of new pieces of information emerged. Two I had heard already. The first is the suggestion that this tournament could be worth more than €800m to the economy. The second, more than 445,000 visitors are expected to travel to the island.

There are many reasons to host the 2023 Rugby World Cup. The belief that this island can make money from the event should not be one of them.

Mega-sporting events like this should not be viewed as investments. They are primarily consumption products. I am in favour of Ireland’s bid because of the consumption benefits. Our bid should be framed in this context.

One has to go back to the Summer Olympics in 1984 to find a mega-sporting event that turned a profit. Due to riots, terrorism, budget overruns and boycotts in the sixteen years leading up to 1984, Los Angeles was the only city prepared to host the Summer Olympic Games. As a result, the bargaining power lay with the city. Favourable terms were negotiated with the IOC, including a commitment to cover any losses incurred by the city from hosting the event. Los Angeles made a $215 million profit, the first since 1932, and the only profit since.

Many cities have promised to be a “Los Angeles” since. None have succeeded. The power has shifted to the organisers. In Ireland’s case, the IRFU is battling with France and South Africa. Advantage World Rugby.

We are told that an Irish 2023 Rugby World Cup would be a commercial success. It will be. But for who? The answer is primarily World Rugby. The organisation follow a similar approach to FIFA’s Football World Cup and collect most of the revenue from the tournament. While the football equivalent is bigger, the comparisons are useful.

FIFA’s expenses at the most recent tournament in Brazil were in excess of $2.2 billion. This included a payment of $453 million to the local organizing committee and a $100 million "legacy" payment to Brazil after the tournament. Broadcasting revenue alone was worth $2.4 billion. Including merchandising, sponsorship and licensing, FIFA made a profit of $2.6 billion on the tournament.

Brazil spent just under $15 billion on the World Cup. It’s likely the loss to the taxpayer was in excess of $10 billion.
Maybe the taxpayer is happy to do this. The likely cost of the rugby equivalent is much lower. I for one am more than happy to pay for the Rugby World Cup. It will be the largest sporting event ever to be held on this island.  

Research has shown the positive externalities associated with hosting. For example the jump in happiness from playing the 48 matches on this island, if monetised, could run into billions of euros. This is especially true of a developed economy like Ireland.

But what about the estimated €800 million in economic activity and 445,000 tourist arrivals? Won’t they pay for the party?

The problem with these figures is they only tell one side of the story. We are repeatedly told what the tournament is worth, not what it will cost. If Ireland’s bid is successful the country will owe World Rugby somewhere in the region of £120 million for the privilege of hosting. This is before any capital works or temporary overlay are addressed.

Ex ante estimations measuring “economic activity” and “tourists” often do not take into account crowding out and substitution effects.

The most recent Rugby World Cups are worth considering. In September and October 2011 Statistics New Zealand collected data on World Cup arrivals. Visitors were asked to fill out an 'arrival card'. One such category was “RWC visitor”. Just over 242,500 visitors arrived in total. Of these, 127,600 arrived for the World Cup. Does this mean the tournament attracted an additional 127,600 to New Zealand? No. What is important is the net increase in arrivals.

Fast-forward to September and October 2012. 197,524 international visitors travelled to New Zealand when no tournament was being held. While the tournament did increase tourist arrivals, it was somewhere in the region of 45,000 extra.

An ex post study of the 2015 tournament England, still only provides an “estimate” of international tourist arrivals. A figure of 406,000 is offered. A number well below pre-tournament forecasts. I suspect the net increase in tourist arrivals to England is far lower.

Given the nature of Ireland’s data on tourist arrivals, it’s hard to know exactly how many visitors arrive per month. A moving average since 2014 of 700,000 per month probably isn’t too far off. If Ireland does manage to attract hundreds of thousands of sports tourists, how many of these will displace the 700,000 per month that would have travelled here anyway?

Data from last year’s World Cup in England tells us that those travelling from overseas bought 774,000 tickets out of almost 2.5 million. The remaining tickets were purchased by “local fans” and “domestic visitors”. This means more than seven out of ten fans at the tournament were English. They add nothing to the economy. They simply substituted their income from one purchase to another.

There are many reasons to host the Rugby World Cup. Development of the game of rugby at all levels. Increased community empowerment. Increased cooperation and goodwill between both sides of this island. The emergence of sporting role models for our young. The promotion of health benefits.
​
The belief that this island can make money from the event should not be one.
0 Comments

The Slowing Pace of Baseball?

16/11/2016

0 Comments

 
By Robbie Butler

The growth of the modern sports competition is inherently linked to the rise in sports broadcasting. Today, there are nearly 100 dedicated sports channels available on European satellite television. As these have grown in number, so too have the bargaining power of sports organisers. This has resulted in broadcasting revenue becoming the most important source of income for sports team owners. Two give just two examples, the Premier League broadcasting rights for the seasons 2016-2019 sold for £4 billion. The rights for the Summer Olympics sold for an almost identical amount.

Broadcasters have had an untold impact on the sports we watch. The changes include an exponential increase in the revenue generated by clubs, dramatic increases in player pay and changes in the structure and rules of the games themselves. It is to the third point I now focus. 

David Butler previously wrote about the changing face of tennis, snooker and cricket, and the emergence of short forms of each of the sports. There is a belief that the extended nature of the traditional forms of these sports e.g. five day test in cricket, is not attractive to viewers who instead seek more 'exciting' or 'instant winner' contests.

Recently, a students in a sports economics module I am delivering brought a YouTube clip, explaining similar problems facing baseball to my attention. The four-and-a-half minute video can be seen here.

It starts by saying that the average game time for baseball in the US reached an all-time high in 2015 of 3 hours and 8 minutes. However, both hits and runs are down. Organisers are attempting to change the rules to overcome this problem. The issues facing the sport may be deeper. For example, American football games are both longer and have more dead time, yet its popularity eclipses that of its MLB counterparts. 

The video is certainly worth a watch. 
0 Comments

The Changing Landscape of Irish International Football

11/11/2016

 
By David Butler

The inclusion of Daryl Horgan and Andy Boyle in the 28-man squad for the Ireland Austria qualifier is a big boost for the reputation of Dundalk and the League of Ireland. Although this is not the first time domestically based talent has been called up the senior squad, LOI call-ups are few and far between in recent times.  

It’s plain to see that the dynamics of Irish international football have shifted substantially over the past twenty-five years. This is maybe best seen in the changing career paths and career trajectories of our international footballers. No longer are our internationals contracted to a variety of elite Premier League teams such as Manchester United, Liverpool or Tottenham for a significant period. The historical 'straightforward' career path of Irish players, which saw them transferred to an elite club and spend the lion's share of their career there, seems to be a thing of the past.  

It’s not too difficult to make comparisons to the operation of other labour market operations in general in light of globalisation processes. With an internationalised Premier League, competition has never been as intense. No longer will it suffice to be the best striker in the British Isles to play for Manchester United or Liverpool.

Different models seem to be opening up outside of the traditional ‘move and make it’ ideal associated with the likes of Roy Keane, Niall Quinn, Kevin Moran, Ronnie Whelan etc. By scanning the current squad, most Irish born and raised players seem to follow one of the following career paths outside of the older model. Their careers usually have at least one of the following four features.

  1. They move to Britain and take multiple loan moves, usually to lower league clubs.
  2. They move to an elite British club and then drop divisions or move to a traditionally lower ranked Premier League club at an early stage in their career.
  3. They enter a lower league and remain in lower leagues for their career (often making multiple moves).
  4. They make the international squad from the LOI.

Horgan and Boyle are two of very few players that have made the international setup solely from playing LOI football. Another interesting pathway also may also be expanding. There seems to be growth in players coming back to play in the League of Ireland and then having another shot at British Leagues later in their career (after failure at a young age in Britain). Recent examples of players reigniting a career in England from the LOI include Daryl Murphy and Richie Towell. Rumours of a return to England for Cork’s Sean Maguire are also surfacing.

What will be the implications of the alternative career paths and different routes to the senior international setup? In particular, will our squad become older, if Irish based talent is returning to Britain later in their careers or breaking through at a later stage after much perseverance? Time will tell.

Olympic Bidders

7/11/2016

 
By Robbie Butler

​The 13th of September 2017 might seem quite far away today. For most of us this date is insignificant right now but for the cities of Budapest, Paris and Los Angeles it will be the day they find out whether their bid to host the 2024 Summer Olympic Games has been successful.

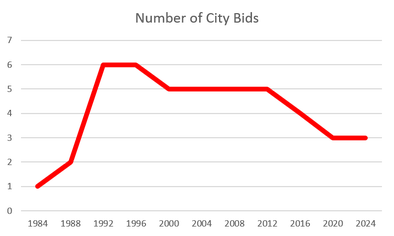
For the 2nd time running, the contest is a three-city race. This is down to the unselected bids of Berlin, Boston and Washington DC and the recent withdrawal of Rome. The reduced field is something that might concern the IOC. The last time Los Angeles "bid" they had no competition. The 1984 Games were hosted by the California city and proved to be an economic success, turning a profit of in excess of $200 million. This is the last time the Games made a net profit.  

This good press encouraged other cities to bid in the decades that followed. A win-win for the IOC. However, the cost of hosting the Games, as demonstrated by Athens, Beijing, London and most recently Rio, are forcing some to have a rethink. 
Picture
Following a peak for the 1992 and 1996 Games, the number of bidding cities has declined.

With it, bargaining power is moving towards those bidding, and away from the IOC. Whilst not the same as 1984, those hoping to win the rights are probably better placed than before.

The IOC will do all they can to ensure that this recent decline doesn't become the norm or, worst still, decline further.

Ironically, it may be that the cost of hosting the Games, now somewhere in the region of $12 to $15 billion, is putting off would-be applicants. Should the 2028 or 2032 Games see only one bidder, its likely the cost of hosting these Games will fall accordingly.  

Recent Trends in Exchequer Expenditure on Sport

4/11/2016

 
By John Considine
The first post to this website/blog, back in July 2013, presented a description of Irish Exchequer expenditure on sport for the period 2002-2011 (here).  In the meantime, different elements of that expenditure have been examined.  Forty months on from that first post, it is time to again look at overall Exchequer expenditure on sport.  This time I will look at the period 2011-2015.  These years happen to coincide with the period of the Fine Gael - Labour coalition government and, therefore, can be used to assess the priority attributed to sport by that government.

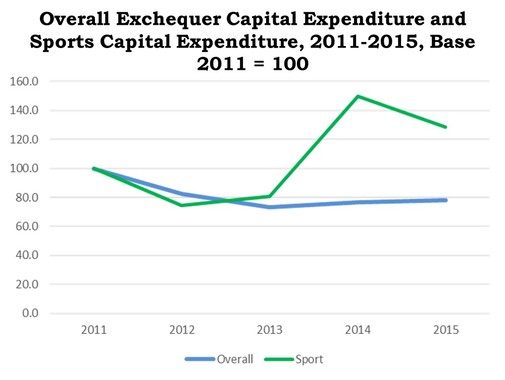
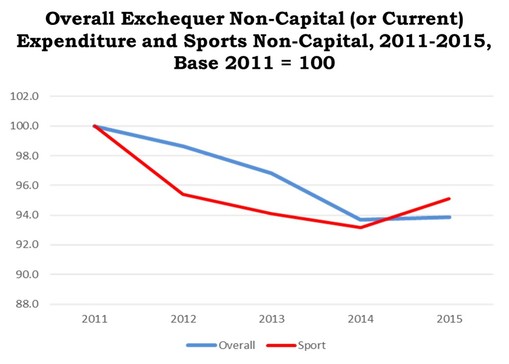
For the period 2011-15 approximately 7% of all gross Exchequer expenditure was capital expenditure and the remaining 93% was for non-capital expenditure (also called current expenditure).  Transfer payments and Wages/Salaries making up the majority of this expenditure.  Sport is different.  Approximately 43% of expenditure on sport for the period was capital expenditure.  Therefore, when we compare expenditure on sport for the period with that of overall Exchequer expenditure, it is better to separate capital and non-capital expenditure.  The next two pictures show the change over 2011 for capital expenditure and non-capital expenditure.

When it comes to capital expenditure, changes in sport are not dissimilar to overall expenditure for 2012 and 2013.  However, there is a dramatic increase in sports capital expenditure in 2014.  Sports capital expenditure increases from 80% of its 2011 level to over 140%.  The restoration of the sports capital grants to clubs accounts for much of the change.  The rest of the change arises from a capital allocation to Sport Ireland (previously known as the Irish Sports Council).
Picture
The changes in non-capital expenditure are far less dramatic as can be seen by the scale on the left-hand side of the graph below (compared to the scale on the graph above).  It is fair to say that non-capital sports expenditure follows overall non-capital expenditure pretty closely.  The 2015 change of about 2% arises from money being spent on measures funded by dormant bank accounts.
Picture
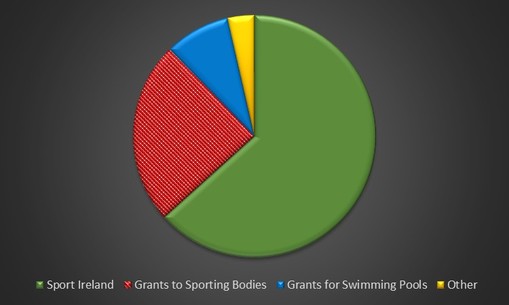
For the period 2011-2015 the vast majority of sports expenditure went on two items, namely, Sport Ireland and Grants to Sporting Bodies.  Over 85% goes to these two items of expenditure.  The pie-chart below illustrates the situation.
Picture
It would seem that sport capital expenditure was important for the Fine Gael - Labour coalition.  Not a bad thing for sports people.  However, some of the sports capital allocations at the end of the regime seemed less than ideal (here).

Irish Sports Monitor Report 2016

1/11/2016

 
By Robbie Butler

Last week, the Minister of State for Tourism and Sport, Patrick O'Donovan launched the 6th Irish Sports Monitor Report. The report commissioned by Sport Ireland and written by Ipsos MRBI covers the period April 2015 to April 2016.

According to the findings, nearly half of the Irish population, aged 16 and over, engage regularly in "sport". The most popular activities including personal exercise (13.7%), running (8.2%), swimming (8%), cycling (5.5%) and soccer (4.8%). 

Other findings from the report are summarised on the Sport Ireland website and can be found here. Among the more interest are the following: 
  • Gaelic football remains the most popular form of sporting event.
  • Team sports such as Gaelic football, soccer and hurling/camogie having the largest numbers of volunteers.
  • Soccer, Gaelic football and swimming are the most common sports played with children.
  • Mothers are more likely to say that they participate in more sport since having children.
  • Just over 12% of the adult population are sedentary i.e. take part in no regular sport, recreational walking, walking for transport or cycling for transport.

    Archives

    February 2023
    January 2023
    December 2022
    November 2022
    October 2022
    September 2022
    August 2022
    July 2022
    June 2022
    May 2022
    April 2022
    March 2022
    February 2022
    January 2022
    December 2021
    November 2021
    October 2021
    September 2021
    August 2021
    July 2021
    June 2021
    May 2021
    April 2021
    March 2021
    February 2021
    January 2021
    December 2020
    November 2020
    October 2020
    September 2020
    August 2020
    July 2020
    June 2020
    May 2020
    April 2020
    March 2020
    February 2020
    January 2020
    December 2019
    November 2019
    October 2019
    September 2019
    August 2019
    June 2019
    May 2019
    April 2019
    March 2019
    February 2019
    January 2019
    December 2018
    November 2018
    October 2018
    September 2018
    August 2018
    July 2018
    June 2018
    May 2018
    April 2018
    March 2018
    February 2018
    January 2018
    December 2017
    November 2017
    October 2017
    September 2017
    August 2017
    July 2017
    June 2017
    May 2017
    April 2017
    March 2017
    February 2017
    January 2017
    December 2016
    November 2016
    October 2016
    September 2016
    August 2016
    July 2016
    June 2016
    May 2016
    April 2016
    March 2016
    February 2016
    January 2016
    December 2015
    November 2015
    October 2015
    September 2015
    August 2015
    July 2015
    June 2015
    May 2015
    April 2015
    March 2015
    February 2015
    January 2015
    December 2014
    November 2014
    October 2014
    September 2014
    August 2014
    July 2014
    June 2014
    May 2014
    April 2014
    March 2014
    February 2014
    January 2014
    December 2013
    November 2013
    October 2013
    September 2013
    August 2013
    July 2013

    About

    This website was founded in July 2013.

    RSS Feed

    Categories

    All
    American Football
    Athletics
    Baseball
    Basketball
    Behavioural Economics
    Boxing
    Broadcasting
    Competitive Balance
    Cricket
    Cycling
    Darts
    David Butler
    Declan Jordan
    Drugs
    Ed Valentine
    Epl
    Esports
    Expenditure
    F1
    Fifa World Cup
    Finances
    Funding
    Gaa
    Gaelic Games
    Gambling
    Game Theory
    Gary Burns
    Geography
    Golf
    Greyhound Racing
    Guest Posts
    Horse Racing
    Impact Studies
    John Considine
    John Eakins
    League Of Ireland
    Location
    Media
    Mls
    Mma
    Olympics
    Participation
    Paul O'Sullivan
    Premier League
    Regulation
    Research
    Robbie Butler
    Rugby
    Simpsonomics
    Snooker
    Soccer
    Spatial Analysis
    Sporting Bodies
    Stephen Brosnan
    Swimming
    Taxation
    Teaching
    Technology
    Tennis
    Transfers
    Uefa
    Ufc
    World Cup
    Wwe

Related

The website is not formally affiliated to any institution and all of the entries represent the personal views and opinions of an individual contributor. The website operates on a not-for-profit basis. For this reason we decline all advertisement opportunities. 

Contact

To contact us email sportseconomics2013@gmail.com or find us on Twitter @SportEcon.