The Economics of Sport
  • Sports Economics
  • About
  • Workshop
  • Selected Publications
  • Book Reviews
  • A Primer on Gaelic Games
  • Upcoming Events
  • Media
  • Education
  • Resources & Links
  • Data

EPL 2015/2016 Some Facts, FiguresĀ and Trends

30/3/2016

 
By David Butler

Taking account of extended squads, approximately 611 footballers are registered with Premier League clubs this season. This figure takes account of several individuals hovering between the first team and reserves.


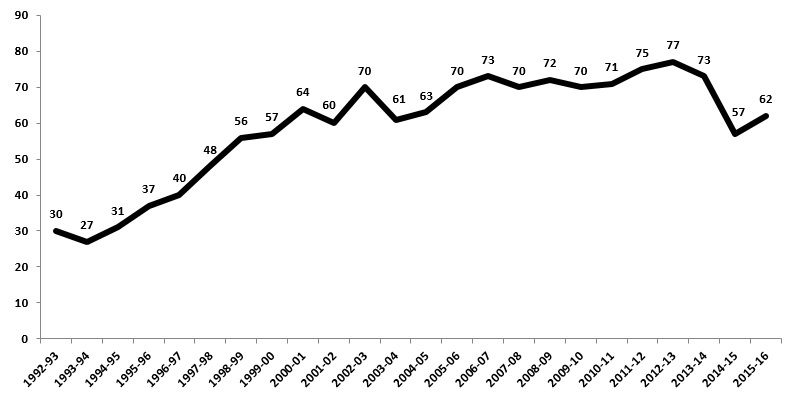
62 nationalities were represented, two of which were new to the Premier League (Burkina Faso born Bertrand Traoré of Chelsea and Lithuania's Marius Adamonis who plays with Bournemouth). The graph below shows the total number of nationalities participating in the Premier League since the 1992-1993 season.
Picture
Approximately 40% of the 611 players this season are English. Approximately 50% are from the British Isles. Outside of the 40% English players, a further 36% of Premier League stars are from the EU. The remaining 24% are non-EU nationals. This nationality distribution has remained relatively stable since 2010/2011. The '4-4-2' structure so to speak, 40% English, 40% Other EU (French, Spanish, Irish etc.) and 20% Non-EU (African, South American etc.)

The most represented European nationalities outside of the British Isles come from western Europe and are France (37 players), Spain (32 players) and Belgium (18 players).

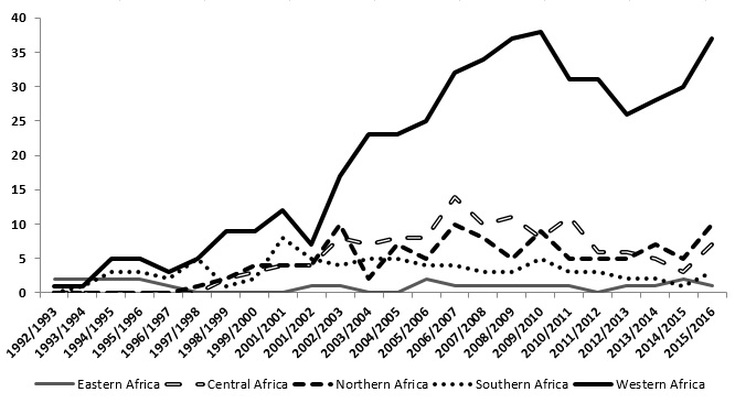
Western African countries such as Cote d'Ivoire and Senegal exported the most players to the Premier League this season from the African continent. With the exception of a few early years, this has always been the case. The graph below shows the number of African players playing in the Premier League by region since the 1992/1993 season. The first decade of the 21st century witnessed year-on-year increases in the number of Western African players on the books with EPL clubs. This season the number of Western African players reached 37, nearly as high as its peak in the 2009-2010 season (38 players).
Picture

The external costs of gambling and why Ireland's unhealthy relationship with the horse industries need to end

25/3/2016

0 Comments

 
by Declan Jordan
A recent discussion on Newstalk’s Talking Points with Sarah Carey addressed the difficult issue of gambling addiction. It is very difficult to assess the scale of gambling addiction in Ireland (and elsewhere), particularly with the advent of online gambling websites and mobile phone apps. Gambling is a particularly invidious form of addiction. As pointed out in the radio discussion, gambling addiction is a silent and hidden disease – there is no smell on the breath or puncture marks in the skin to give it away. Addicts may believe that a way out of their problems is to ‘double down’ so that more gambling becomes the ‘solution’. It is unlikely that any alcoholic or drug addict believes that a way to solve their addiction problem is to drink more. Gambling is also a difficult addiction to address because it is not a substance introduced to a body, but rather is bound up with an individual's self-worth and need to be right.
 
As a society Ireland is coming to terms with its damaging drink culture. There is more education about the dangers of alcohol and there is an opening up about the problems of gambling addiction, with several high profile sportspeople now talking about how they suffered from their gambling problem.
 
This is not the case with gambling, and if anything we are normalizing gambling as an activity, just as we did (and to an extent still do) with binge drinking. The saturation coverage on all media of the Cheltenham festival is a perfect example. However, it is clear now that betting has infiltrated many parts of our national discourse with coverage of the recent election often showing the odds on different election outcomes and potential Taoisigh. Football on television has become an opportunity to bet as the game progresses with odds flashed on screen continuously during, for example, Sky Sports coverage. Of course, once you have a mobile phone then it is so easy to put down a stake.
 
Of course there are many (probably a majority of punters) who can control their gambling, just as there are a majority who can control their drinking. There is no way a prohibition on gambling makes any sense. Indeed there are many strong vested interests who would have a stake (pun intended) in keeping the gambling industry as strong as possible. The Irish government levies a 1% tax on bets (which in the last budget was extended to online betting). The take from this tax is paltry however.
Despite the enormous growth in gambling in Ireland which sees around €4.2bn punted each year, the betting tax is yielding just €27m per year – roughly the same as it did in 1984.
Even this small amount is used to prop up the bloodstock and racing industries – irrespective of whether the bet being taxed was placed on horse racing or not. It’s fairly clear there are very strong vested interests at play here – and the popularity of horse racing in Ireland means the government continues to forego what could be a very profitable source of tax revenue. The ring-fencing of revenue from this tax for the horse racing and bloodstock industries also makes little sense. The value of bloodstock industry itself was estimated at €0.9bn in 2010. The industry receives approximately €11m from the betting tax (or approximately 1% of the industry value). Does this very successful industry require state support?
 
This boils to little more than a question of priorities however, until the issue of gambling addiction is considered. Whatever the scale of gambling addiction in Ireland, there can be no doubt that the gambling industry, and the sport of horse racing that relies on gambling to exist, have negative social external effects. The effects are more significant also because they are so highly concentrated, in that the damage done to individuals and families are catastrophic. An issue raised in the discussion on Newstalk was the lack of investment in gambling addiction support in Ireland. Potential solutions were in short supply, though it is clear that a large part of the solution must be internalizing the external costs of gambling. That means dramatically increasing the betting tax. There can be little justification for VAT rates of 21% and a betting tax rate of 1%. This could be paid by bookmakers (as is currently the case) or by punters. This could be supplemented by a levy on bookmakers’ profits. And instead of ring-fencing the income for investment in an industry that hardly needs such investment, the proceeds could instead by invested in gambling addiction counseling and other mental health supports.
0 Comments

Yo-yoing in the National Hurling League

23/3/2016

 
By John Eakins

The final round of games in the 2016 National Hurling League were played last weekend. The quarter finals are scheduled to be played in two weeks times as well as the relegation playoff which will determine which team will play in Division 1B next year (either Galway or Cork).  The winning/losing of the relegation game is generally seen to be of great significance to each team as the winner stays in the higher quality and more competitive 1A division whilst the loser plays in the lower quality and less competitive 1B division. And playing higher quality and more competitive matches is better preparation for the championship in the summer.  
 
So the story goes. There are a couple of interesting aspects to this however. Since the league was restructured in two divisions of six teams (Division 1A and 1B) in 2012, each team that has been relegated from 1A to 1B has immediately i.e. the following year, being promoted back to 1A. The table below outlines the teams involved:
Picture
So what does this tell us? Firstly it is clear that there is gulf in quality between teams in Division 1A and 1B. The relegated team is guaranteed 3 to 4 wins and promotion is usually determined by one match. This match is normally against Limerick as they have been the team which fights it out with the relegated team for the promotion spot. Does being relegated and playing in Division 1B affect a team’s championship prospects? It doesn’t appear to be the case. In 2013, Dublin won the Leinster championship. In 2014, Cork won the Munster championship. In 2015, Waterford went on to win the National League and progressed to the All-Ireland semi-finals. 

So perhaps been relegated is not such a bad thing. As long as you ensure you outperform the one and only nearest rival in Division 1B. That is the one caveat to this analysis. If you do lose this game and stay in Division 1B for more than one season it may become progressively more difficult to get out of it.

Relative Age Effects: A Quick Glance

21/3/2016

0 Comments

 
By Robbie Butler

On the Tuesday the 1st of March and Thursday 3rd of March 2016 the Republic of Ireland Under-17 team played their Swiss counterparts in two friendly matches in the Waterford Regional Sports Centre. A team sheet was produced for the games which provide a list of players representing each country. Nineteen Irish players are list, alongside twenty Swiss. The list includes the date of birth of each player. I present this data below for both countries by month-of-birth and by quarter. 
Picture
Picture
Here are some interesting points to note:
  • Of the thirty-nine players selected for either country, just four were born after the 6th of August 1999.
  • Just six of those selected were born in the second half of the calendar year. This means almost 85% of those on the squad lists were born between the 1st of January 1999 and 30th of June 1999.
  • January alone accounts for ten of the thirty-nine players (25.6%).
  • In total, twenty-one players (53.8%) are born in Q1 (January to March). 
0 Comments

The Cheltenham Challenge Day 4 Review

19/3/2016

 
By Robbie Butler

Another five selections went to post on the final day, of which Ruby Walsh rode four. Results as follows:

Time          Horse                          Finished         Return
1.30pm      Footpad                        3rd                  €2.25
2.10pm      Dicosimo                       Fell                 €0.00
2.50pm      Long Dog                      Pulled up        €0.00
3.30pm      Djackadam                    2nd                 €2.13
4.50pm      Childrens List                17th                €0.00

Total return: €4.38. Loss on the day of €5.62.

For the week:
Stake €46. Return: €44.71. Loss: €1.29

Again, following Ruby Walsh ridden horses only on Day 4 would have seen a stake of €8, a return of €4.38. A loss of €3.62 on the day. 

Ruby for the week:
Stake €36. Return: €44.71. Profit €8.71 for the week. That's a 24% return from following the Irish champion jockey.In fact, Ruby was the only Mullins' jockey to finish in the winning or placed positions. Next year we'll just have to follow Ruby!

The Cheltenham Challenge Day 3 Review

18/3/2016

 
By Robbie Butler

A very good day for Willie Mullins on day three. Five selections went to post, of which Ruby Walsh rode four. Results as follows:

Time          Horse                          Finished         Return
1.30pm      Black Hercules             1st                   €7.00
2.50pm      Vautour                         1st                  €4.00
4.10pm      Ballycasey                    5th                  €3.50
4.50pm      Limini                            1st                  €0.00
5.30pm      Sambremont                 8th                 €0.00

Total return: €14.50. Profit on the day of €4.50.

For the week to date: Profit of €4.33

Again, following Ruby Walsh ridden horses only on Day 3 would have seen a stake of €8.00 and a return of €14.50. A profit of €6.50 and €12.33 for the week to date.

The Cheltenham Challenge Day 2 Review

17/3/2016

 
By Robbie Butler

Seven horses represented the champion Irish trainer, Willie Mullins, in our experiment on Day 2. Details below:

Time          Horse                          Finished         Return
1.30pm      Yorkhill                          1st                  €8.00
2.10pm      Roi Des Francs             6th                  €0.00
2.50pm      Blood Cotil                    Pulled up         €0.00
3.30pm      Un De Sceaux              2nd                  €0.00
4.10pm      Uncle Junior                 10th                 €0.00
4.50pm      Voix Du Reve                Fell                 €0.00
5.30pm      Barcadys                       3rd                 €5.00

Total return: €13. Loss on the day of €1.

For the week to date: -€0.17

Again just following Ruby Walsh ridden horses only would have seen a stake of €12.00 and a return of €13. A profit of €1 and €5.83 for the week to date.

The Cheltenham Challenge Day 1 Review

16/3/2016

 
By Robbie Butler

Six horses represented the champion Irish trainer, Willie Mullins, in our experiment yesterday. Details below:

Time          Horse                          Finished         Return
1.30pm      Min                                2nd                 €0.00
2.10pm      Douvan                         1st                   €2.50
3.30pm      Annie Power                 1st                   €7.00
4.10pm      Vroom Vroom Mag       1st                   €3.33
4.50pm      Pont Alexandre             Pulled up        €0.00
5.30pm      McKinley                       Fell                 €0.00

Total return: €12.83. Profit of €0.83 on day one.

Following Ruby Walsh ridden horses only would have seen a stake of €8.00 and a return of €12.83. A profit of €4.83.

Roll on Day 2.

The 2016 Cheltenham Challenge

14/3/2016

0 Comments

 
By Robbie Butler

It's the eve of the greatest racing festival on earth which means it's that time again. During the course of the next five days we are going to attempt to systematically beat the market. 

This will be our eighth attempt at challenging the Efficient Market Hypothesis and over the course of the next five days we will place 27 imaginary wagers to see if it is possible to beat the bookies.


The scorecard reads 4-3 to the market. We have successful beat it in 2010, 2011 and 2013. The last two years have been disappointing. Prior to last year, a selection was made on which our hopes rest. Last year, with the help of Fiona Mullins, we followed the favourite to see if we could beat the market this way. We failed.

This year we are going to continue with the Mullins influence and follow the great Carlow trainer. In 2003 the Champion trainer brought eight horse to the Cheltenham Festival. In 2015 he had eight winners! Such is Mullins' rise that this year he will saddle sixty horses over the four day meeting. We can't back all sixty. Instead we will follow the horse he saddles with Ruby Walsh on board.

If Mullins has a runner or runners and Ruby isn't riding in the race (e.g. amateur jockey races), we'll revert to his shortest starting price horse.

We will place a €2 win bet in each race if the horse is less than 4-1, and €1 each-way bet if the horse is 4-1 or greater. As always, daily updates to follow.
0 Comments

Productivity and Transfer Value

11/3/2016

 
By Robbie Butler

With the 2015-2016 Premier League entering the final two months, a clearer picture is now starting to emerge of each club's performance. Incredibly, Leicester City (5000-1 shots at the start of the season) continue to lead the race for the title and the market now prices them as short as 11-10 to lift the Premier League trophy. As late as Christmas 2015, finishing in the top four would still probably have been viewed by many as an over-achievement for the Foxes.

While Leicester have far exceeded expectations they are not alone. West Ham United are very much in the hunt for Champions League qualification. In fact, had it not been for Leicester's remarkable season, it is likely West Ham would be getting far more attention for their excellent performance to date. Other clubs to exceed expectations this season probably include Tottenham and Stoke City. 

At the other end of the spectrum, the big underachievers include the likes of Newcastle United, Everton, Aston Villa and Manchester United. All of these clubs probably thought they would be better off at this point in the season. However, no under-performance has been quite as dramatic as Chelsea. The current champions will do well to reach 7th place, the joint worst performance by a defending EPL champion (Blackburn 1995-1996, and Manchester United 2013-2014).

So how might we explain these performances?

One way is to consider the summer 2015 Transfer Window and assess how productive were each club signings. The key to this measure is capturing the relationship between productivity and transfer fee. Generally in economics, productivity is used as a measure of performance. When it comes to footballers the official Fantasy Premier League can help us out.

I previously wrote about the site here and here. Each week players are assigned a performance value based on that round of fixtures. Points are awarded for goal scored, assists, clean sheets, saves, etc. Points are deduced for goals conceded, cautions and red cards. The weighting of each is based on the players position (e.g. defenders are awarded more points for scoring than strikers). On balance, it appears attacking players find it easier to accumulate points, and this is one small quirk in this analysis. However, a closer look at seventy-four observations for which transfer fee data is available during summer 2015 provides some interesting results. The number of fantasy football points is measured on the X-axis while the transfer fee, in millions of pounds sterling, is measured on the Y-axis.
Picture
Sources: http://fantasy.premierleague.com/ and http://www.dailymail.co.uk/sport/football/article-3097272/Premier-League-transfer-window-Club-club-guide-2015-summer-moves.html
The trend line is of interest. Based on these observations, players above this line have either under-performed or were over-valued (note the observations do not control for long-term injuries).

Some of the best buys in the Summer 2015 window include Dimitri Payet, Petr Cech, Toby Alderweireld, Georginio Wijnaldum, Virgil van Dijk, and Robert Huth (who has scored 105 points and cost just £3 million). West Ham's resurgence can be explained by the excellent performance of not just Payet but also Michail Antonio (93 points), N'Golo Kante (82 points) and Angelo Ogbonna (64 points) who all appear below the trend line, and cost just £7 million, £5.6 million and £8.5 million respectively. 

At the other end, the over-valued/under-performing stars include Chelsea's Baba Rahmen (£21 million and 15 points) and both Manchester United signings Memphis Depay and Morgan Schneiderlin. Both cost £25 million and have accumulated an identical number of Fantasy Premier League points (53). Aston Villa's Idrissa Gueye has also amassed 53 but cost just £9 million pounds last summer. 

Manchester City unsurprisingly paid the most for any player. However, the £52 million the club spent on Kevin De Bruyne looks out of line when compared to Robert Huth's 105 points and £3 million fee. Other expensive purchases include Rahmen Sterling, Anthony Martial and Christian Benteke. Firmino, while currently over-priced is moving closer to Payet and more good performances might see the Brazilian become relatively good "value-for-money" before the end of the season. 
<<Previous

    Archives

    March 2023
    February 2023
    January 2023
    December 2022
    November 2022
    October 2022
    September 2022
    August 2022
    July 2022
    June 2022
    May 2022
    April 2022
    March 2022
    February 2022
    January 2022
    December 2021
    November 2021
    October 2021
    September 2021
    August 2021
    July 2021
    June 2021
    May 2021
    April 2021
    March 2021
    February 2021
    January 2021
    December 2020
    November 2020
    October 2020
    September 2020
    August 2020
    July 2020
    June 2020
    May 2020
    April 2020
    March 2020
    February 2020
    January 2020
    December 2019
    November 2019
    October 2019
    September 2019
    August 2019
    June 2019
    May 2019
    April 2019
    March 2019
    February 2019
    January 2019
    December 2018
    November 2018
    October 2018
    September 2018
    August 2018
    July 2018
    June 2018
    May 2018
    April 2018
    March 2018
    February 2018
    January 2018
    December 2017
    November 2017
    October 2017
    September 2017
    August 2017
    July 2017
    June 2017
    May 2017
    April 2017
    March 2017
    February 2017
    January 2017
    December 2016
    November 2016
    October 2016
    September 2016
    August 2016
    July 2016
    June 2016
    May 2016
    April 2016
    March 2016
    February 2016
    January 2016
    December 2015
    November 2015
    October 2015
    September 2015
    August 2015
    July 2015
    June 2015
    May 2015
    April 2015
    March 2015
    February 2015
    January 2015
    December 2014
    November 2014
    October 2014
    September 2014
    August 2014
    July 2014
    June 2014
    May 2014
    April 2014
    March 2014
    February 2014
    January 2014
    December 2013
    November 2013
    October 2013
    September 2013
    August 2013
    July 2013

    About

    This website was founded in July 2013.

    RSS Feed

    Categories

    All
    American Football
    Athletics
    Baseball
    Basketball
    Behavioural Economics
    Boxing
    Broadcasting
    Competitive Balance
    Cricket
    Cycling
    Darts
    David Butler
    Declan Jordan
    Drugs
    Ed Valentine
    Epl
    Esports
    Expenditure
    F1
    Fifa World Cup
    Finances
    Funding
    Gaa
    Gaelic Games
    Gambling
    Game Theory
    Gary Burns
    Geography
    Golf
    Greyhound Racing
    Guest Posts
    Horse Racing
    Impact Studies
    John Considine
    John Eakins
    League Of Ireland
    Location
    Media
    Mls
    Mma
    Olympics
    Participation
    Paul O'Sullivan
    Premier League
    Regulation
    Research
    Robbie Butler
    Rugby
    Simpsonomics
    Snooker
    Soccer
    Spatial Analysis
    Sporting Bodies
    Stephen Brosnan
    Swimming
    Taxation
    Teaching
    Technology
    Tennis
    Transfers
    Uefa
    Ufc
    World Cup
    Wwe

Related

The website is not formally affiliated to any institution and all of the entries represent the personal views and opinions of an individual contributor. The website operates on a not-for-profit basis. For this reason we decline all advertisement opportunities. 

Contact

To contact us email sportseconomics2013@gmail.com or find us on Twitter @SportEcon.