I gave a short lecture to senior cycle secondary school students (high school) on the Economics of Sport yesterday. The talk focussed on prize money distributions across sports. The event took place in University College Cork and my slides from the talk can be viewed below.
|
By David Butler I gave a short lecture to senior cycle secondary school students (high school) on the Economics of Sport yesterday. The talk focussed on prize money distributions across sports. The event took place in University College Cork and my slides from the talk can be viewed below. By David Butler
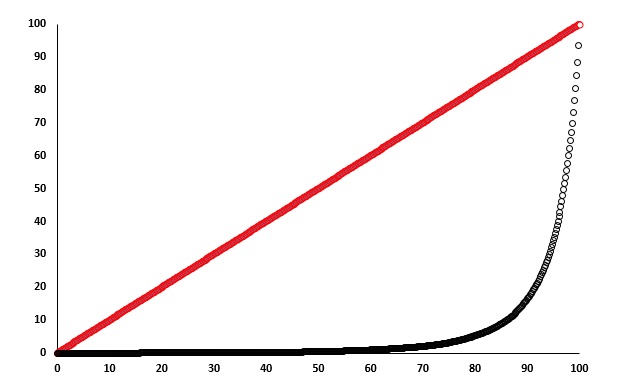
Last week I presented some data relating to prize money allocations in golf and horse racing. As a corollary, below is a Lorenz curve showing the distribution of prize money for 534 professional snooker players competing in 57 international tournaments over 23 years from 1992-2014. In Economics the Lorenz curve is a graphical illustration of an income distribution. This curve originated from the works of Economist Max Lorenz in 1905. The red line in the graph below is called the line of equality. The bowed line beneath is the Lorenz curve. The difference between both lines gives an indication of how unequal the distribution of winnings in snooker have been. The top 20% of snooker players over 23 years have claimed £65,339,628. That’s 95% of the entire earnings. England's Ronnie O Sullivan is the highest earner. He’s won 6.5% of the total prize money available. The Scots, John Higgins and Stephen Hendry are 2nd and 3rd while Wales’ Mark Williams is 4th in the list. The highest ranked Irishman is Ken Doherty in 13th position. There are only 3 players from outside the British Isles in the top 30 earners; Neil Robertson (Australia, 6th), Ding Junhui (China, 8th) and Marco Fu (Hong Kong, 17th). For the more technically inclined, one can specify the degree of inequality in prize money by calculating what’s called a Gini coefficient. This is a measure of dispersion and is the ratio of the area between the red line (perfect equality) and the Lorenz curve, to the area between the black line and the line of perfect inequality. The higher the Gini coefficient (0-1), the more unequal the distribution is. For international snooker the Gini coefficient is 0.88 indicating a high degree of inequality in prize money allocations in professional snooker. |
Archives
June 2024
About
This website was founded in July 2013. Categories
All
|

 RSS Feed