Examining the period since 2012 also allows us to assess the period of Fine Gael led administrations. The distribution of Exchequer sports expenditure by line item (Vote 31) is illustrated in the pie chart below.
By John Considine Austerity in the UK is coming to an end. At least that is what the UK Chancellor of the Exchequer told those listening to his Budget Speech. It has probably ended in Ireland a few years ago (although you will find a few rare birds who claim there was no austerity, a few more who will claim it remains, and one or two others who will insist the term is meaningless). If one is to judge by non-capital Exchequer expenditure on sport then the "recovery" has been in progress since about 2013. Since 2012 non-capital sports expenditure has increased marginally as a proportion of overall non-capital expenditure. Examining the period since 2012 also allows us to assess the period of Fine Gael led administrations. The distribution of Exchequer sports expenditure by line item (Vote 31) is illustrated in the pie chart below. 
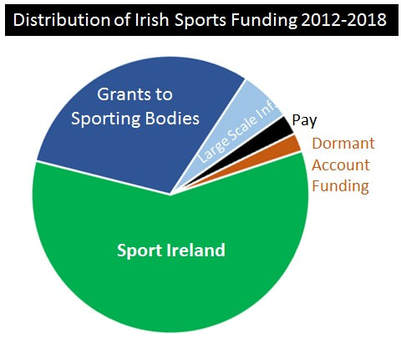
The Exchequer expenditure on Sport Ireland accounts for just under 60% of the total for the period 2012-18. (Broadly speaking one could add the Dormant Account Funding to this figure as this funding shows up in the accounts of Sport Ireland.) The vast majority of expenditure on Sport Ireland is classified as non-capital. Turning to the how Sport Ireland uses this money, we see that the biggest item of expenditure in the Sport Ireland accounts is the grants. Effectively, the government outsources the task of managing this non-capital expenditure to Sport Ireland. A screen shot of some of the relevant grants is provided below (these are from the latest Annual Accounts on the Sport Ireland website). 
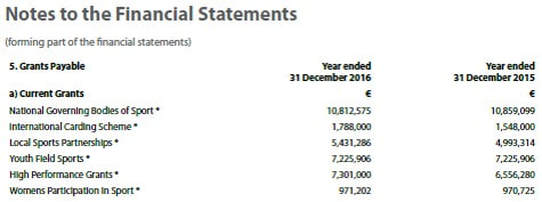
Outside of pay, the remaining items in the pie chart are capital grants administered by the Department of Transport, Tourism and Sport. The political bias in these allocations has provided the basis for plenty of discussion in a variety of places (including on this blog, e.g. here). By their nature, capital grants allow the decision maker greater influence. It also opens up the opportunity for credit-claiming. This is more difficult for non-capital grants. As the screenshot above shows, non-capital grants are reoccurring and changes are usually incremental. Less room for credit-claiming.
By John Eakins
The new NBA basketball season has just started with the main headline attraction being the move of LeBron James from the Cleveland Cavaliers to the LA Lakers and whether he will revive the once famed basketball franchise. While his move is likely to generate more interest and higher TV viewing figures, this hasn’t stopped the NBA experimenting with a new revenue generating streaming model. As reported here, here and here, the NBA is giving the option to fans to stream the final quarter of any game for a nominal once off fee – reported to be $1.99 in most of the stories above. From my reading, the option only appears once the 3rd quarter buzzer sounds rather than purchasing it before the match starts. It also appears to be just a streaming option at the moment (rather than purchasing it through your TV operator) and is appealing primarily to digital users which, as some of articles state above, is a growing market for basketball fans, especially younger ones. Interestingly, the articles also suggest that NBA are also looking at some stage in the future to allow fans purchase the live stream of a match at the start of any quarter with different prices points attached. A great example of price differentiation by a monopolist if there was ever one. It will be interesting to see whether this is successful or not. In some ways it’s a no-brainer for the NBA. The actual costs of implementing such a feature are probably small – the fact that they stream the full game already would suggest that it should be quite easy to introduce a separate final quarter streaming service. In economics talk, the marginal revenue of such a service would outweigh the marginal cost. Basketball is also a game which suits such a new revenue strategy given that it’s divided into four quarters and in most games the outcome is still up for grabs coming into the final quarter. It also appeals to the behavioural concept of instant gratification, which some of my colleagues on this blog have written about before. Why waste time watching the whole match when you can catch the shorter and potentially more important part for a cheaper price. I have to admit, when watching recorded American Football highlights (another sport that this revenue model could be applied to), I myself sometimes forward to the final quarter. Could this model be applied to other sports? One could offer to purchase the 2nd half of football matches or rugby matches, the last 10 overs of a cricket match, the last round of a golf major, the last 2 games in a tennis set or perhaps just purchase the tiebreaker if there is one. The options would appear to be endless and given how streaming is becoming more prevalent as a means of broadcasting sports events, I wouldn’t be surprised if there were more examples of this offered in other sports in the near future. However I can’t see it replace the traditional TV viewing experience just yet. There is still something appealing in watching how a match unfolds from start to finish from the comfort of your armchair on a big television screen. By David Butler
After a long season many League of Ireland fans deserve a pat on the back for following their club the length and breadth of the country. In my opinion, away trips are a far different experience from attending a home match and although the chances of a loss go up, nothing seems better than a win on the road in front of a big home crowd. Travelling to away games is a commitment and carries costs in terms of money and time. Some fans may think they have it harder than others so the chart below shows the total kilometres travelled by a fan who went to all away fixtures in this year’s LOI as measured from each clubs home stadium to the visiting ground. The numbers are only one-way, so in reality you can double the totals! Unsurprisingly, the Derry City fans have to travel the farthest. To put their 5,228 kilometres in perspective, that would be about the same as leaving the Brandywell and travelling to Georgia (Tblisi is 5055km away according to Google Maps). Cork City fans have the equivalent total distance to cover as a one-way trip to Ankara, Turkey. Waterford fans have the third longest distance to travel. Their total travel over the season would equate to leaving the RSC and heading to Moscow. One the opposite end, fans of Dublin clubs can take advantage of the fact that many rivals are on their doorstep. Rovers, Pats and Bohs have each other all nearby and have short trips to the north and south for Dundalk and Bray respectively. In some sense it’s good that there significant travel distances – this is a sign that the spatial structure of the league is balanced. A concern for many small leagues, and something we suffered from in the past, was the emergence of a ‘tramway league’. At the moment having Derry, Sligo, Waterford, Cork and Limerick present is a good thing for the league. Perhaps all that is missing to have a strong regional-capital balance is a competitive team based in Galway. ![]() By Robbie Butler The United States Grand Prix was held yesterday. Many had anticipated a Lewis Hamilton victory which would have secured the British drivers' 5th Formula One World Drivers' Championship (WDC). This was not to be as Ferrari's Kimi Räikkönen finished in first place, with Hamilton nearly three seconds behind in 3rd place. Regardless of Ferrari's success, this has delayed the inevitable, and with Hamilton 70 points ahead in the race for the WDC, he is likely to be crowned next weekend in Mexico City. Success for Hamilton will mean his 4th title in five years, and represent a five-in-a-row for Mercedes in the World Constructors' Championship (WCC). Such dominance is nothing new to Formula One. Since 2000 just eight men have won the WDC. Including the 2018 Championship, and assuming Hamilton wins the title, it will mean three drivers (Hamilton, Vettel and Schumacher) will have won 14 of the past 19 WDC. The WCC is even more concentrated. Again since 2000, just six teams have won this title, and 15 of the 19 are shared by three constructors (Ferrari (6), Red Bull (4) and Mercedes (5 including this year). Whether this is good for the sport is an open question. In 2010, rule changes were implemented into the scoring. Although the sport has a long history of altering the scoring system, there was a radical move to award the winner of each race 25 points. This had traditionally been 10 points or less. It could be argued that this rule change has reduced competitive balance. Is this the case? I don't believe so. The figure above presents one measure of competitive balance, a concentration ratio, of the top two drivers in the WDC standing each year since 2005. It is hard to argue that rule changes to the scoring system in 2010 are responsibility for a reduction in competition. The sport was at its most competitive (since 2005) the year before the rule change, three of the seasons that followed have been less concentrated than the WDC's in 2005, 2006 and 2007. The trend is suggesting a movement away from more competitive races but this may not be a consequence of the points scoring changes. The new owners may want to consider the level of competitive balance. Sports fans generally start to become disinterested in events that become noncompetitive. However, the answer to this problem might require more than just changing the points scoring within races. By John Considine ![]() Michael Lewis has written his fair share of popular books that have economic themes. The Undoing Project: A Friendship that Changed Our Minds seems to suggest that we got a bit carried away with the potential for late 20th century economics. One could possibly say the same about his perspective on financial markets in his earlier book The Big Short: Inside the Doomsday Machine. But what about Moneyball: The Art of Winning an Unfair Game? I've read the book and seen the movie but I was never sure about it's verdict on economics. While someone with a degree in economics might have helped the Oakland A's, the underlying message was surely not that different to The Undoing Project or The Big Short. Individual decisions, and the outcome of the decisions of many individuals, is not always perfect or efficient. If the player market was perfect then Billy Beane would not have been able to identify undervalued players. In Moneyball we were presented with scouts who were blinded by the ways they had traditionally rated players, e.g. great wheels. It is not dissimilar to the theory-induced-blindness of "mainstream" economists in The Undoing Project. As I say, I'm not sure about the perspective on economics presented in Moneyball. There is a scene towards the end of the movie where Billy Beane (Brad Pitt) says his draft experience taught him never to make decisions based on money. Maybe Michael Lewis was never a fan of the discipline. Maybe the friendship between Amos Tversky and Daniel Kahneman was not needed to change his mind. Moneyball did draw attention to the use of data and statistics. Scientists of all persuasions would surely approve. Plenty of other books on the use of data and statistics followed. A few have been reviewed on this blog. The Numbers Game is one of my favourites. It includes a lovely discussion on the Maldini principle. The Maldini principle is the sporting equivalent of the dog that did not bark in the night (on second thoughts I'm not sure about this as the original Conan Doyle story concerned a sporting event). In short it refers to the fact that Paolo Maldini's "numbers" did not fully reflect his defensive play. It is a warning that statistics can only capture so much. Younger followers of football may not remember, or have even heard about, Paolo Maldini. They will know Romelu Lukaku. The Manchester United and Belgium striker has racked up an impressive array of statistics. He is among the youngest to score 50 and 100 Premier League goals. On the international scene he has outdone Messi and Ronaldo when it comes to early career goals. Of course, there are those who will question the quality of the opposition. These critics would do well to remember that there is also attacking contributions that basic count statistics do not capture. The third goal scored by Belgium against Japan in the 2018 World Cup is a case in point. With time almost up, the score was 2-2 and Japan had a corner kick. The Belgium goalkeeper catches the corner kick. Twelve second later Belgium are 3-2 ahead. Lukaku play a huge role in the goal by (i) making a run to create space for a team mate and (ii) by stepping over the ball (see the goal here). These contributions are not always measured. Back to Michael Lewis and Moneyball. The book plays an important role in reminding us of the importance of an empirical approach to sport and economics. There is also a little bit of satisfaction in seeing the scouts and other insiders getting a little egg on their face. But it would be wrong to throw the baby out with the bathwater. Experience at the coalface is invaluable. One can appreciate Moneyball and also appreciate more qualitative evidence. My knowledge of baseball is extremely limited but it is impossible to read baseball books by journalists like Leonard Koppett or participants like Tony La Russa without realising that understanding the game requires more than a degree in economics or statistics. By David Butler
In addition to following the predictive success of Premier League pundits as I usually do, I have also kept an eye on the profitability of the predictions offered by Sky Sports and BBC experts. After 8 rounds of fixtures, the news is good for both Paul Merson and Mark Lawrenson. If a punter was to place a 1 stake on all of the 80 outcomes (win/loss/draw) they have suggested so far one would turn a profit of €51.04 following Merson and a profit of €25.50 following Lawrenson. Betting on each pundits specific scoreline prediction returns similar profits. Merson’s scoreline estimates return a profit of €55.72 while Lawrenson’s return a profit of €25.50. These profits were helped by a sterling performance by the pundits in week 7 of the Premier League. Before Gylfi Sigurdsson’s 89 minute goal to give Everton a 3-0 lead over Fulham, all 3pm Saturday kick-offs were at 2-0… one of the pundits favourite predictions! Half of all the fixtures ended 2-0 that week, something which the pundits really capitalised on. By Robbie Butler For those that watch the League of Ireland, it seems apparent (to me anyway) that competitive balance in the league has shifted in the past number of seasons. On the 4th of November 2018 Cork City and Dundalk will meet for the 4th successive year in the FAI Cup Final. The meeting of the same two teams, four years in a row, has never happened in the FA Cup or Scottish Cup. This is also true of the Copa Del Rey and many other cups across Europe I have checked. Given the dynamics of a knock-out competition, and the probability of drawing a team at any stage, it is quite remarkable that Cork and Dundalk meet again. It is all the more remarkable that the last 3 meetings ended tied at the end of normal time, meaning neither has been beaten over 90 minutes in the FAI Cup since late summer 2014! This year's league table gives us further insight to the dominance of these two clubs, and how Dundalk's achievement in regaining the league title is somewhat of an outlier in recent years. Since 2009 (ten full seasons) six clubs have been crowned champions of Ireland; Bohemians (2009), Shamrock Rovers (2010 and 2011); Sligo Rovers (2012); St Patrick's Athletic (2013) Dundalk (2014, 2015, 2016 and 2018) and Cork City (2017). The charts below demonstrate how Dundalk and Cork have solidified their positions in recent years. It has taken Dundalk just one season to regain the league title. It remains to be seen if Cork City can do the same next year, but if they can it will be further evidence of a "Big 2" in Ireland. For the first time in the history of the League of Ireland, which commenced in 1921, the same two teams finished first and second (in any order) five years in a row. The previous record stood at three. This is important in the context of what comes next. The other four winners of the League since 2009 have failed to regain their title. This is not unusual and I have previously addressed the issue here. The graphic above presents league position for Bohemians, Shamrock Rovers, Sligo Rovers and St Patrick's Athletic from the season before winning the title to four years after. Following on from winning the League, all four then start a gradual slide. In the case of Bohs and St Pat's, this meant battling with relegation not long after winning the league.
What Dundalk and, to a lesser extent, Cork City are doing is not what we have been used to in recent years. It will be interesting to see if this trend continues. While such dominance will not be welcomed by fans of other clubs, it is in the interest of the league generally, in terms of improving UEFA coefficients and European club competition progression. The upcoming FAI Cup Final will be required viewing. If extra time is needed, both Dundalk and Cork will go close to 5 years without losing a FAI Cup game in normal time. I wonder has any other country ever had this experience? By David Butler
As the League of Ireland is coming to a conclusion there have been recent posts on topics such as attendance figures and play-off records. For international readers of this blog it may seem unusual that our league is concluding. The League of Ireland, unlike many European Leagues, adopts a February-October schedule. This is colloquially known as ‘summer soccer’. The league switched from an August-May schedule in 2003. We’re not the only UEFA country with this domestic league structure; other countries, many of which have harsher climates than Ireland, also adopt a February/March-October/November schedule. Examples include Estonia, Finland, Georgia, Latvia and Lithuania. The motivations for the February-October schedule were partly strategic (Irish teams would be mid-season when competing in European competitions) and also to increase the attractiveness of the product. Playing mostly through the summer months allows for improved playing conditions, perhaps bringing with it more attractive football and larger attendances. Below is an attempt to visualise ‘summer soccer’. The charts show the recorded temperature and sunsets for each match this season at the location where it was played. The average temperature for a League of Ireland match this season was 9.66°C (median, 9°C). For me, this is hardly balmy weather and might be even slightly higher than previous years as we had a warm summer. Several of the earliest fixtures are played before the clocks go forward in March, hence the jump in the sunset data. ![]() By Daragh O'Leary Competition design is an essential element of sport. The structure of these competition dictate the outcomes that are achieved. Organisers of events should be interested in designing competitions that are fairest to all those competing. One positive attribute of the league system is that it’s a very fair type of competition to judge which teams are the strongest. It’s a test of a team’s ability and endurance over a long period of time where every team plays each other twice (home and away). With this in mind you can say that the team which finishes 1st is probably the overall strongest in the league, the team in 2nd is probably the next strongest in the league, and so on. So it makes sense that if three teams from a league are going to be promoted to a higher division that those three teams should be the three strongest in that league. With this in mind, I turn to the Championship Playoffs in the second tier of English football. As most know, the step up from Championship to the Premier League is no easy task for any club. In fact John Eakins found that on average at least 1 of the promoted teams are relegated from the premiership the following season (see here). While the step up is big for all promoted clubs, it is probably tougher for the club which gains promotion via the Championship Playoffs. For any reader who is unsure how the Championship promotion system works, the teams which finish in 1st and 2nd gain automatic promotion to the Premier League the next season, and the teams that finish in 3rd, 4th, 5th and 6th place compete in a knockout competition for the third available promotion spot. 9 times in the last 20 years has a team which gained promotion via the playoffs managed to avoid relegation from the Premier League the following season. And there’s a good reason for this too. They’re usually a much weaker side than the other two promoted teams. This system might seem a little unfair considering that at the end of last season there was thirteen points between 3rd place Fulham and 6th place Derby County. Yet both teams are equally eligible for promotion to a higher division the following season. Fulham did go on to win the playoffs that year but usually the 3rd place teams are not so lucky. Only 38% of the time in the past twenty years has the 3rd place team managed to gain promotion. This appears even more unfair when you consider that the teams which win the playoffs and finish in 3rd place perform better in the Premier League the following season than teams who win the playoffs and finish below 3rd place. As can be seen in the table to the right, only 37.5% of teams in the last 20 years which win the playoffs and finish 3rd are relegated, whereas teams which win and finish in lower league positions all get relegated more frequently the next season. With this in mind, does it not seem fairer that the top three teams from the Championship should be promoted? Particularly when you consider that the financial rewards gained from competing in the Premier League are far greater than those gained from competing in the Championship, and that being the next season puts serious financial pressure on a club. Of course, the Championship playoffs make for great entertainment, but should promotion spots to a higher league not be given out on a “best team for the job” basis? By Robbie Butler There was a time when buying your favourite club's home shirt was somewhat of an investment. One could be confident that their team would wear the shirt with pride in the seasons that followed. Crest and sponsorship deals were largely unaltered from season-to-season. Fans could even wear the jersey once it had been replaced by another, usually with minor alterations, and only those with a keen eye could spot the difference. Not so anymore. In fact, the only thing that seems to change faster than managers in the Premier League today, are the kits players wears. The data below presents information on 37 clubs that have played in the Premier League since 2009/10 and the number of kits launched during that time. Obviously, this is an overall figure so naturally teams that have never been relegated are much higher on the scale. In total, 587 seperate kits have been launched in the past ten seasons. The "big 6" of Arsenal, Chelsea, Liverpool, Manchester United, Manchester City and Tottenham Hotspurs are responsible for just over 200 of these, roughly 35%. Spurs (41) are the only club to break the 40-kit barrier. This can be largely explained by differing sponsorship deals in the Premier League and Champions League in seasons past. On average, clubs that have played in the Premier League for at least four of the past ten seasons, have produced 2.8 kits per season. This data is present below. Again, Tottenham lead and are followed by Newcastle United. Whilst Tottenham's jersey's differed at times due to sponsor changes, Newcastle actually launched four different jerseys during the 2013 – 2014 and 2014 – 2015 seasons. This had been done just once before (Everton 2008-2009).
It seems the football jersey is not the investment it once was. As they say, caveat emptor. |
Archives
November 2023
About
This website was founded in July 2013. Categories
All
|