The Economics of Sport
  • Sports Economics
  • About
  • Workshop
  • Selected Publications
  • Book Reviews
  • A Primer on Gaelic Games
  • Upcoming Events
  • Media
  • Education
  • Resources & Links
  • Data

Premier League Jobs and Name Changes

27/11/2019

 
By Robbie Butler

Earlier this week, former England manager Sam Allardyce said on TalkSport radio:

"The best way to get a Premier League job if you are British is to change your name to a foreign name. I have always said if I was ‘Allardicio’ I could have managed Manchester United". (The interview can be seen here).

This is quite a statement given that Allardyce, who began his managerial career in Ireland taking charge of Limerick, is the only person ever to manage 7 Premier League clubs over some 512 games (Bolton Wanderers (226), West Ham United (114), Blackburn Rovers (76), Sunderland (30), Everton (24), Newcastle United (21), Crystal Palace (21)). 

10 of the top 12 managers, listed by the number of Premier League games they have managed, are from Great Britain or Northern Ireland. This includes Sam himself, Alex Ferguson, Harry Redknapp, David Moyes, , Mark Hughes, Steve Bruce, Martin O'Neill, Alan Curbishley, Tony Pulis and Alan Pardew.

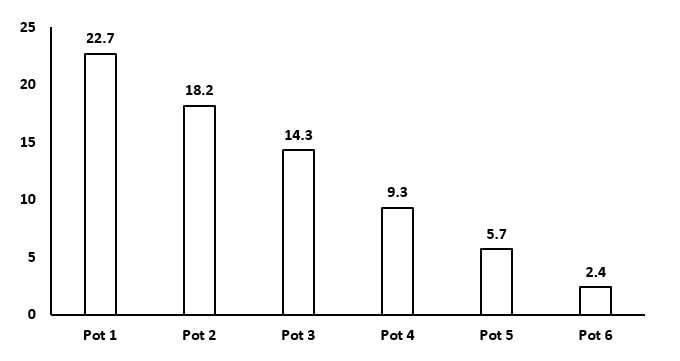
The overall distribution of managers by nationality is also skewed towards domestic (U.K) managers. In total 204 men have been appointed to 399 positions. The distribution by nationality is presented below.  
Picture
At present in the Premier League almost half of the managers are from Great Britain or Northern Ireland. While this is a drop in domestic representation when compared with the overall data from 1992, it is hard to argue that British managers are not well represented in the top league.

Of course, a different argument is that home-grown managers are not given the "top" jobs but this is a different argument entirely.

​The biggest job of them all, the England national team job, has been held by four English men since Italian Fabio Capello left the post in 2012. Alex Ferguson, David Moyes, Roy Hodgson, Kenny Dalglish, Tim Sherwood and Frank Lampard all manage(d) at top clubs during this decade.

As a starting point, the best way to get a job in the Premier League today is probably to be a very good manager.

Premier League Outcomes

25/11/2019

 
By David Butler

​After 13 game weeks Liverpool have only failed to win once this season - at any level of football it typically takes this burst of wins to be crowned champions.

One way of looking at this is that the challengers run out of matches. Rather than any miraculous big-match wins from the future champions (which of course do happen), things are more attritional. You burn off the competition week-by-week as other contenders slip up.

Alex Ferguson had this down to a T.  His Manchester United sides would lose and draw some big games but would put all the minnows to the sword – others struggled to do this as effectively. After all, there is 3 points at stake for all matches regardless of the opponent.  

Liverpool seem to be knocking teams out of the Premier league race week-by-week. While in theory, any team can still win the league, for all intents and purposes the race is run for the vast majority.

Assuming that the winning team, most likely Liverpool, will accumulate 98 or 100 points – the points required to win the league in 2018/2019 and 2017/2018 – the challengers can have the following slips:

98 Points League Winner

​Leicester City can drop a maximum of 6 points, Manchester City can drop a maximum of 5 points and Chelsea a maximum of 3 points.

100 Points Winner 

​Both Leicester City and Manchester City can drop a maximum of 3 points and Chelsea must win all remaining matches. 
If Jurgen Klopp plans on replicating Liverpool form from last season (97 points total), he is already putting major pressure on his rivals. Manchester City can really only afford one more loss over the next 25 games if Liverpool go one point better this season and reach last year’s 98 point winning total.

For some extra bragging rights, Liverpool fans might take pleasure in knowing that they were the ones to knock Manchester United out of the title race. Again, assuming a 98-point league winner, Adam Lallana’s late equalising goal at Old Trafford effectively ended United’s tilt at the title. That was only 9 games in.  

Of course, these are very high winning totals and are down to Manchester City's exceptional performances. If an average of the last 5 seasons is considered (circa 92 points), there is scope for more slips from the contenders. 

Is This Brexit In Action?

22/11/2019

 
By Robbie Butler 

In 2005 the "Cross Country Race" was run for the first time at the Cheltenham Festival . Over a distance of about 3 miles and 6 furlongs, the race is probably the most easily recognisable at the 4-day Festival as horses tackle a variety of different obstacles including grass banks, hurdles, wooden fences and “cheese-wedges” (two grass banks with hedge rows on top).

Run on the in-field of the famous Cotswolds course, the race has become synonymous with Ireland.  13 of the 15  races at the Cheltenham Festival have been won by Irish-trained horses. In fact, only the Philip Hobbs’ trained Balthazar King has raised the English flag.

Not only have Irish trained horses dominated the race at the Festival, but so too have horses from this island dominated the trial races at Cheltenham. 8 of the last 9 Irish winners had been placed previously over the cross-country course at Cheltenham before winning the race at the Festival.

So, to the most recent running of a trial race, on Sunday the 17th of November.

10 runners went to post last weekend, and remarkably, not a single horse was trained in Ireland. This most-Irish of races was, for the first time, devoid of Irish interest.
​
The data below presents the distribution of Irish to non-Irish runners in the November/December Cross Country Trial Race since 2008. In 11 of the 22 races between 2008 and 2019, Irish trained horses comprised at least 50% of the field. In December 2017, and both November and December 2018, Irish trained horses constituted between 63% and 71% of the field. One year on, November 2019, this falls to 0%.
Picture
One has to wonder whether this is Brexit in action? The deadline of the 31st of October 2019 was a mantra repeated again and again in recent months. Did this effect Irish trainer and owner decisions when deciding to enter horses in Britain? It does seem odd that an Irish dominated race would suddenly have no Irish interest.
​
No sport on this island will be effected to a greater extent if and when Brexit happens. Maybe we are starting to see the industry adjust to a new normal.

Imbalance and Euro 2020 Qualifiers

20/11/2019

 
​By David Butler

The Euro 2020 qualifier group stage ended last night with the final automatic places being decided.

The high levels of predictability and imbalance in European international football have shone true once again.

All Pot 6 team finished bottom of their groups (where there were six teams). One team – San Marino  – failed to register a point (and only scored one goal). Except for two teams from Pot 3 (Turkey and Finland), all of the other automatic qualifiers came from Pot 1 and Pot 2. The seeding is a strong predictor of finishing position.

The chart shows that average points earned by pot – a clear monotonic relationship exists.
Picture
As I written about previously, the gap between Pot 1 and Pot 6 UEFA members is immense. This leads to fixtures where outcome uncertainty is virtually non-existent.

Looking at the fixtures between the top and bottom seed, Pot 1 teams took 58 out of 60 points – a major shock happened when Azerbaijan drew 1-1 at home to Croatia. Pot 1 teams scored 84 goals in these fixtures compared to the meagre 7 scored by the bottom seeds. The most salient mismatch was Belgium beating San Marino 9-0 last October.

What about Pot 1 teams against their second from bottom seed (Pot 5 or Pot 4 depending on group size)?

This is more of the same, Pot 1 teams took 57 out of 60 points. Again, Croatia were shocked when they lost 2-1 to Hungary. Similarly, to the bottom seeds, these Pot 4/5 teams score few goals against the big boys, only scoring 8 times but conceding 67. Italy’s recent 9-1 thrashing of Armenia stands out.

For me this begs the question of whether this type of competition design should continue. The non-economic argument for continuity is that the “dream is kept alive” for small countries. Many economic reasons also exist to keep things as they are, with plenty of inventory for broadcasters, and big occasions for smaller countries.

Perhaps UEFA could take insights from the ‘Eurovision model’ – where the big countries automatically qualify. These Pot 1 teams could compete among themselves in the run-up, maybe in a league style format (surely appealing to broadcasters?), while the rest battle it out for the remaining European Championship places. 

Books Reviewed in the Journal of Sports Economics

18/11/2019

 
By Jessica Considine
2000-2004
Picture
2005-2009
Picture
2010-2014
Picture
2015
Picture

Amazon Prime and the Premier League

15/11/2019

 
By Robbie Butler

For UK and Ireland subscribers of live Premier League games, we are now under a month away from the arrival of a third supplier in the market – Amazon, via their streaming service Amazon Prime. For those unfamiliar with the history of the broadcasting of top flight football in England, the game has moved from provision by free-to-air services in the 1980s, to subscription television since 1992.

Our paper in the Journal of Sports Economics this year explains why the BSkyB monopoly from 1992 to 2007 was brought to an end by the European Commission. However, since then Sky Sports has competed with only one other provider at a given time. While the competition has changed from Setanta Sports, to ESPN, to BT Sports, the ending of the 12-year-old duopoly by Amazon next month is uncharted territory.

While the European Commission’s intervention in the market, to break up the monopoly, sought to protect consumers, it has only resulted in making it worse. A 3rd provider may be another step in the wrong direct.

From December 3rd Amazon Prime will show 2 of the 20 live games it has rights to screen during the 2019/20 season. However, unlike Sky Sports and BT Sports it won’t be possible to watch all live games as some occur simultaneously.  Crystal Palace v Bournemouth will kick-off at 7.30pm on December 3rd while Burnley v Manchester City will start at 8:15pm. This means a clash between part of the second half of the 7.30pm game and first half of the 8.15pm game.

Things get worse the following night. On Wednesday the 4th, five games will kick-off together at 7.30pm (Chelsea v Aston Villa, Leicester v Watford, Manchester United v Tottenham, Southampton v Norwich Wolves v West Ham) while the Merseyside Derby between Liverpool and Everton will start at 8.15pm.
​
Given the kick-off times in the second round of games Amazon Prime will show on the 26th of December, it will only be possible to watch 8 of the 20 games in their entirety. All 128 games on Sky Sports, and the 52 games on BT Sports can be watched as they do not clash with one another. The 3rd provider has a different set of dynamics and one has to wonder how customers will react.

The Toyota Cheetahs and Home Advantage

13/11/2019

 
By Daragh O'Leary

With the Rugby World Cup now finished, Irish rugby fans will be turning their attention back to the performances of their respective provinces in the Pro 14 competition. For me this is a somewhat happy change of pace from Ireland’s disappointing World Cup performance because Munster are riding high at the top of their conference and just off the back of three recent victories against Cardiff, Ospreys, and Ulster. However, previous to these three games Munster suffered a heavy 40-16 defeat at the hands of the Toyota Cheetahs. I thought this result was noteworthy because the Cheetahs also managed to batter Ulster 63-26 last month. I initially thought that the Cheetahs must have just been improving at an incredible rate from last season but then I started reading some articles regarding the Cheetahs’ suspiciously prolific home form.

The Toyota Cheetahs are a South-African rugby team based in Bloemfontein which play their home games in the Free State Stadium. What’s interesting about Bloemfontein is that it is located at an altitude of 1,395 m (4,577 ft) above sea level. To give this some perspective, Cork City is located at around 10 m above sea level. The issue with this is that teams who live and play at much lower altitudes to the Cheetahs, like Munster, find it difficult to acclimatise to playing when they go to Bloemfontein. The high altitude means that there is less oxygen, and this means players struggle with breathing which impacts on their performance. The high-altitude levels where the Cheetahs play their home games is largely considered to be the reason their home form is so good. It also explains why they recently beat Munster by 24 points at home despite failing to even score at Thomond Park last year.

To see how much truth was in this whole thing I took to data. I got the results of all the Cheetahs 2018/2019 Pro 14 matches (21 games) and compared their home and away performances.

In total the Cheetahs only won 8 games that season and 6 of these were at home. Not only did 75% of their wins come from their home matches but they score on average nearly 17 more points a game when playing at home. Obviously, the Cheetahs’ players are acclimatised to the high altitude which gives them an advantage over their travelling rivals. It’s incredible to see how much influence geography can have over a team’s performance. However, does the question of fairness not have to be asked in this situation? Does this home advantage not distort a lot of the results in the Pro 14 competition just because players are out of breathe when they travel to Bloemfontein?

Dominance in European Club Football

11/11/2019

 
By David Butler
​
​As winter leagues across Europe start to take form at this stage of the season, it becomes easier to tell who will be in the shake up for a league title, playoff, relegation battle, etc.  When it comes to winning the league many household names sit top the table in the big European leagues after 12 to 13 rounds of football; Liverpool, Juventus, Barcelona and PSG lead their respective leagues. Surprisingly, Bayern are slightly off the pace in the Bundesliga.

Of course, there’s a lot more to European football than the Big 5 competitions. The tables below consider club dominance over the last ten seasons for 54 UEFA members. The tables are ordered firstly by how many clubs have won the domestic championship over the last ten seasons from 2009/2010-2018/2019 (from 2009-2018 for summer scheduled seasons). Secondly, it is ordered by ‘streak’, which measures for how many years of the ten seasons did a club retain the title.  (The first table lists leagues with just 1-3 winners over the past 10 years, while the second lists leagues with 4 or more champions). 

The Belarus league is on one end of the balance spectrum, where BATE Borisov have won the last 10 titles. At the opposite end is the Kosovan league, which became a member of UEFA recently. Eight clubs have won this league. Only Prishtina and Feronikeli have retained it.
Picture
​As many in Ireland know, the domestic league – the League of Ireland – has been quite competitive historically. We have had six league winners in the last ten seasons. Interestingly, Dundalk’s recent dominance means that this level of competition may not be sustained into the future
Picture

Another Assessment of VAR

6/11/2019

 
By Robbie Butler

I am afraid this is another negative assessment of the ongoing circus that is VAR in the Premier League. I have previously address the topic here, here and here. The more I see of VAR, the more I believe the game would be better off without it. Here's why.

I watched the Aston Villa versus Liverpool game last Saturday afternoon. During the first half Liverpool's Roberto Firmino had a goal disallowed for offside. The assistant referee raised his flag as the Liverpool striker kicked the ball into the net. This in itself has become unusual, as more often than not this season, assistant referees have not raised the flag and allowed VAR to decide whether the goal should stand.
Picture
In this case, VAR was used to see whether the offside should be overturned, and the goal given. A freeze frame of VAR's decision is presented to the right.

Upon seeing this, my reaction was that the decision would be overruled and the goal awarded. Instead VAR confirmed the original offside decision, and the score remained 1-0 to Aston Villa.

Why this was the case remained a mystery to me, as it seemed Roberto Firmino was behind the last defender and therefore onside.

Shortly afterwards the Premier League issued the following tweet: 

"Liverpool's Roberto Firmino was flagged offside before putting the ball in the net against Aston Villa and the decision was confirmed by VAR. The red line signifies Firmino and was aligned to his armpit, which was marginally ahead of the last Villa defender". 

Firmino's armpit. In more than 30 years of watching football, I have yet to see a goal scored with an arm pit. 

However, the problem with this runs deeper. As was suggested to me (and I agree), had this been last season, prior to the introduction of VAR, those in favour of the technology would have used this as an example why VAR was needed. They would have argued that Firmino was onside and the goal should have been awarded. Yet, with VAR, the outcome remained the same. 

There is other unintended consequences too. I have spoken about such economic consequences from rule changes in rugby, horse racing and sports broadcasting previously. The Premier League's use of VAR has really opened up Pandora’s Box. In Greek mythology, this represented a gift which seems valuable but which in reality is a curse. Sounds a little like VAR.

When a goal is now scored, I believe the reaction of players and fans is somewhat mooted. The goal is effectively "delayed" until VAR approves it. In fact, the referee is no longer in control of the game, but rather carry's out the orders of those in Stockley Park - the home of VAR. Other sports only consult VAR when the referee requests such. 

This leads to a second order implication. Differences in referee power-relationships and experience levels must exist. Is the match referee one with 10+ years’ experience in the Premier League or a rookie? Is the referee in Stockley Park new to the Premier League or a seasoned pro? Working in academia one would experience this in many forums. For example, comments on a paper presented at a conference or external examiner comments. The experience of the academics both delivering and receiving the comments are crucial in this regard.

Another implication is the officials are now working under a different sets of rules. In the Carabao Cup recently there was no VAR. Arsenal scored a goal which VAR would have disallowed. The world didn't end because of this and Liverpool went on to win the game. I wonder to what extent the assistant referee's failure to see this (relativity) straightforward offside is influenced by VAR in the Premier League. Are officials losing confidence? Running the line is challenging and one can also assume how hard this has become under two different sets of rules. 

My hope is that the VAR experiment will end. I am very much in favour of technology in sport, but only where it improves the game. Goal-line technology has been flawless and is an excellent addition to the game. VAR's introduction has not been the same. My hope is appropriate in this regard because the last thing to come from Pandora’s Box was Hope. 

2019 League of Ireland Stadium Attendance

4/11/2019

 
By David Butler

The League of Ireland 2019 season ended yesterday. The FAI cup final attracted 33,111 patrons to the Aviva stadium. This is by far the highest attended match in the League of Ireland calendar.

Considering the attendance numbers for this season, demand remains relatively stable from 2018. The published attendance data suggest that average attendance for a given match in the 2019 season increased by 37 attendees from 2018. 

The average attendance for a League of Ireland match this season was 2,162. The median was 2,104. The two highest attended matches were the Dublin Derbies when Shamrock Rovers hosted Bohemians (7,021 & 6,414). Shamrock Rovers held the 6 highest attendances this season; their two home matches against Dundalk are third and fourth highest at 5,015 and 4,705.

The lowest ten attendances were all at UCD home matches. These range downward from 542 to 392 (vs. Finn Harps) – the lowest attendance of the season.
​
The graph shows the average home attendance by club for the 2019 season. 
Picture
<<Previous

    Archives

    March 2023
    February 2023
    January 2023
    December 2022
    November 2022
    October 2022
    September 2022
    August 2022
    July 2022
    June 2022
    May 2022
    April 2022
    March 2022
    February 2022
    January 2022
    December 2021
    November 2021
    October 2021
    September 2021
    August 2021
    July 2021
    June 2021
    May 2021
    April 2021
    March 2021
    February 2021
    January 2021
    December 2020
    November 2020
    October 2020
    September 2020
    August 2020
    July 2020
    June 2020
    May 2020
    April 2020
    March 2020
    February 2020
    January 2020
    December 2019
    November 2019
    October 2019
    September 2019
    August 2019
    June 2019
    May 2019
    April 2019
    March 2019
    February 2019
    January 2019
    December 2018
    November 2018
    October 2018
    September 2018
    August 2018
    July 2018
    June 2018
    May 2018
    April 2018
    March 2018
    February 2018
    January 2018
    December 2017
    November 2017
    October 2017
    September 2017
    August 2017
    July 2017
    June 2017
    May 2017
    April 2017
    March 2017
    February 2017
    January 2017
    December 2016
    November 2016
    October 2016
    September 2016
    August 2016
    July 2016
    June 2016
    May 2016
    April 2016
    March 2016
    February 2016
    January 2016
    December 2015
    November 2015
    October 2015
    September 2015
    August 2015
    July 2015
    June 2015
    May 2015
    April 2015
    March 2015
    February 2015
    January 2015
    December 2014
    November 2014
    October 2014
    September 2014
    August 2014
    July 2014
    June 2014
    May 2014
    April 2014
    March 2014
    February 2014
    January 2014
    December 2013
    November 2013
    October 2013
    September 2013
    August 2013
    July 2013

    About

    This website was founded in July 2013.

    RSS Feed

    Categories

    All
    American Football
    Athletics
    Baseball
    Basketball
    Behavioural Economics
    Boxing
    Broadcasting
    Competitive Balance
    Cricket
    Cycling
    Darts
    David Butler
    Declan Jordan
    Drugs
    Ed Valentine
    Epl
    Esports
    Expenditure
    F1
    Fifa World Cup
    Finances
    Funding
    Gaa
    Gaelic Games
    Gambling
    Game Theory
    Gary Burns
    Geography
    Golf
    Greyhound Racing
    Guest Posts
    Horse Racing
    Impact Studies
    John Considine
    John Eakins
    League Of Ireland
    Location
    Media
    Mls
    Mma
    Olympics
    Participation
    Paul O'Sullivan
    Premier League
    Regulation
    Research
    Robbie Butler
    Rugby
    Simpsonomics
    Snooker
    Soccer
    Spatial Analysis
    Sporting Bodies
    Stephen Brosnan
    Swimming
    Taxation
    Teaching
    Technology
    Tennis
    Transfers
    Uefa
    Ufc
    World Cup
    Wwe

Related

The website is not formally affiliated to any institution and all of the entries represent the personal views and opinions of an individual contributor. The website operates on a not-for-profit basis. For this reason we decline all advertisement opportunities. 

Contact

To contact us email sportseconomics2013@gmail.com or find us on Twitter @SportEcon.