The Economics of Sport
  • Sports Economics
  • About
  • Workshop
  • Selected Publications
  • Book Reviews
  • A Primer on Gaelic Games
  • Upcoming Events
  • Media
  • Education
  • Resources & Links
  • Data

Incidence Of Incidents

30/1/2020

 
By Ed Valentine,

​Drivetrain, half shaft, launch control, track rod. The escalating terminology of DNFs in Formula One demonstrates how complex and technological racing has become. Cars do not suffer an “engine problem” anymore but instead have “energy recovery system – kinetic” issues. As the machinery becomes more complex and modern the dictionary of driving excuses will continue to grow.
 
Despite the trickle-down effect of race car technology filtering onto the road there is limited research in the area of Grand Prix attrition rates. With the boom in technology and driver aides since the turn of the millennium this seemed a good opportunity to investigate the primary causes of driver DNFs in F1 over the past 20 season.
 
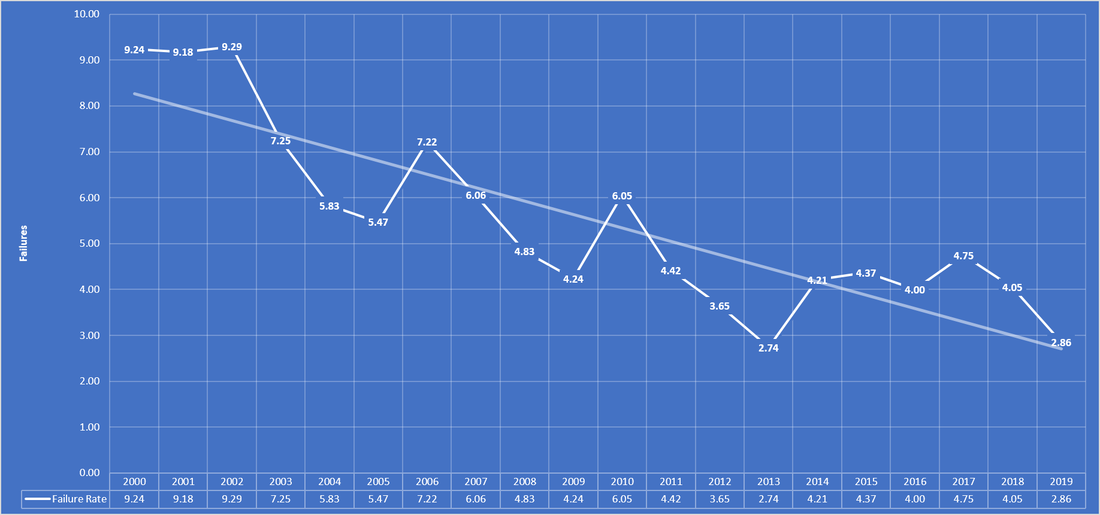
Data presented below in the first figure has been analysed from every round of the F1 World Championship from 2000 – 2019 and charted with the top 4 causes of attrition in those events. The rate of DNFs has also been examined to determine if technological progress includes increased reliability. 
Picture
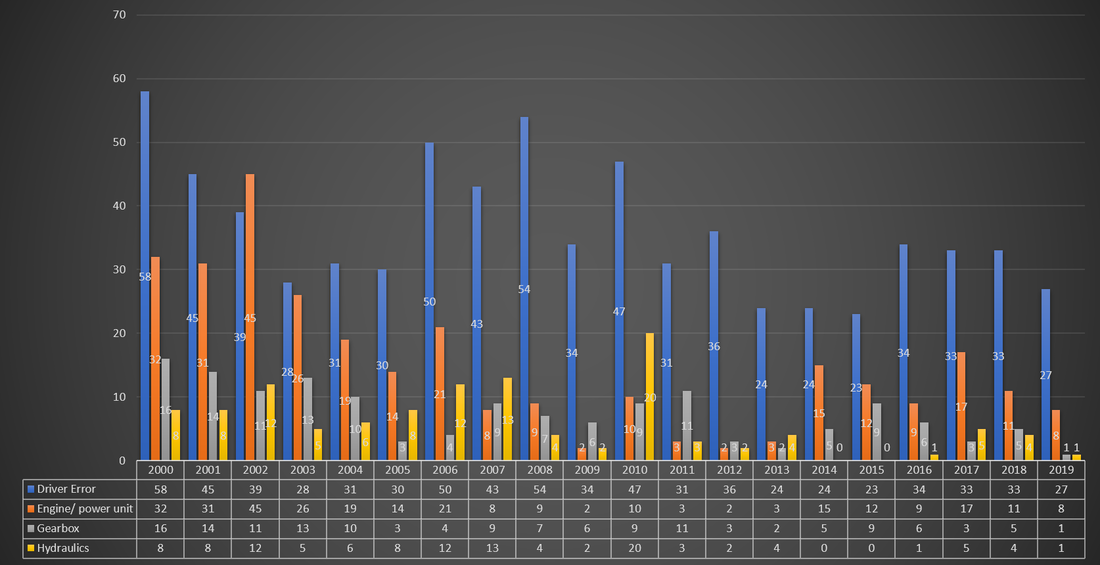
The bar chart shows that by far the prevailing cause of a DNF is driver error. Across the entire analysis over 35% of failures to finish result from driver crashes, spins or collisions. The number was decreasing however as gadgetry meant the cars became easier to drive but with the addition of more street style circuits where cars run at a cigarette paper’s width from the barriers this number is now on the rise. It could be argued that drivers are suffering from what behavioural economist call the Peltzman effect whereby the more safety systems that are in place the more risks they take. In some respects, the technology has outgrown the skill of the driver. It should be noted that there are 4 more races per season now than in 2000. This is reflected in the next figure

There is spike in engine/ power unit issues from 2014 – this is resulting from the new power unit technology brought about by a rule change. The rule aimed to cut costs and make engines greener. While they achieved the latter teams have lost prize money and sponsorship revenue by parking up before the race ends.

The second figure considers failure rates within races. The overall rate of retirements has dropped since 2000 with the figure being about 30% of where was 20 years ago. Cars are about 8-10 seconds faster per lap now than they were back then which underlines the increase in driver aides, the raised standard of driving and the durability of the technology at play. 2019 saw a race where all drivers reached the chequered flag, a rare event in the sport.
Picture
​A Formula One car typically has 80,000 component parts. If everything is 99.9% in working order that’s 80 parts that are not. With billions of dollars spent on incremental .001 second eye-blink gear change improvements it would be worth ensuring the most expensive component in the machine, the driver, can keep the car on the road. Otherwise the teams’ accountants will have a lot of insurance claims to look forward to.

The Borders of Analytics and Human Judgements

27/1/2020

 
By John Considine
Picture
I have just finished reading Ben Reiter's 2018 book Astroball.  What struck me was the overlap with a chapter from Nate Silver's The Signal and The Noise (2013).  Silver drew attention to limits of data analytics, and the benefits of the scouts, at lower levels of baseball.  The back cover of Reiter's book says "Astroball is the inside story of how a gang of outsiders went beyond Moneyball's data revolution to find a new way to win.  They did so by combining hard data with the human judgment of the scouts ...".

Silver said "Someone will come along and ... figure out how to fuse quantitative and qualitative evaluations of player performance".  I'm not sure that Astroball is exactly what Silver had in mind.  The fusion is more intuitive than systematic.  Maybe that is why the back cover says "combining" hard data and human judgements.

Silver would surely approve of the way Sports Illustrated put "Your 2017 World Series Champs" on the front cover in the middle of 2014.  Living and dying by your predictions is central to The Signal and the Noise.

The Signal and the Noise was published a decade after Moneyball.  Astroball another half decade after that.  It is worth comparing Astroball and Moneyball.

​Some of the more memorable passages in Moneyball involved confrontation between the traditional human judgements of the scouts and the decisions based on data analytics.  The emphasis is on data analytics going beyond human judgement.  In Astroball, the reader is always reminded that there are times where human judgement can go beyond data analytics.  That said, the benefit of data analytics from recruitment and in-game strategy is the main theme of the book.

There is another similarity.  The author of Moneyball, Michael Lewis, went on to write a bestseller about Israeli psychologists named Daniel Kahneman and Amos Tversky (the former shared the 2002 Nobel Prize in Economics).  Ben Reiter introduces the same two individuals to the readers of Astroball.  He notes how their work was contemporaneous to the writings of Bill James.  No direct comparison is made.  I liked that.  Just as I liked the book.  The exaggerated claims on the front and back covers do not reflect the balanced approach to decision making in the book.  The book does an excellent job of navigating the borders of data analytics and human judgement.

SkelligCRI Seminar Series

24/1/2020

 
By David Butler

​A GAA research event will take place at UCC’s Skellig CRI Centre for Research & Innovation in Caherciveen, Co. Kerry on the afternoon of 
Friday 21st of February 2020 at 4pm 

This event is targeted at a public audience, where researchers will showcase our research in GAA during 20 minute presentations, with 10 minutes for questions afterwards

Vacancies for Economics Professors

21/1/2020

 
Here is a link to two advertised professorial positions in the Department of Economics in University College Cork.  The closing date for applications is 27th February 2020.

​https://academicpositions.com/ad/cork-university-business-school-ucc/2019/professor-in-economics-professor-scale-2-in-economics/137370


Major League Soccer 2020

20/1/2020

 
By Robbie Butler

The 25th season of Major League Soccer will kick-off at the end of next month and will include David Beckham's new franchise Inter Miami CF and Tennessee franchise Nashville SC. This will bring the total number of teams to 26 – the highest to date.

Inter Miami will form part of the Eastern Conference, while Nashville SC will join the Western Conference. This, despite the fact that the Nissan Stadium, home of Nashville, is more easterly than Soldier Field, the home of Chicago Fire who play in the Eastern Conference. The arrival of the new franchises, and the division they play in, got me thinking about the distances these teams must travel weekly in order to fulfill fixtures.

I recall Steven Gerrard’s time with LA Galaxy and comments by the former Liverpool player that the travel involved playing MLS was exhausting. This is especially true when one compares it to the Premier League in England.

In early January, Liverpool played Everton in an FA Cup 3rd round game. During a stoppage in play, a drone above the stadium moved slightly northwards, and Everton’s Goodison Park came into view. There is less than 1 mile between the two stadiums. For newly recruited players of Inter Miami, their 'derby match' with Orlando City SC will require a 205-mile journey north. This is just shy of Liverpool visiting a London club, which is hardly a derby.

The distances a franchise will travel in the MLS arequite something. In this post I considered only the Eastern Conference. The Western Conference would appear far worse. New players for Inter Miami have some serious travel ahead, given Miami’s location. After Orlando, the next closest venue is the 580-mile trip to the magnificent Mercedes Benz Stadium in Atlanta, a round trip of nearly 1,200 miles. This is like Liverpool heading to Cologne in Germany.

Inter Miami players will have at least seven trips in the Eastern conference that exceed 1,000 miles one way! The longest being the 1387-mile distance to play Montreal Impact – the greatest distance between two franchises in the Eastern Conference. Liverpool to Rome is almost the exact same distance.

Considering all franchises for the conference, there is probably just one derby, by European standards that is. The 20 miles separating the Yankee Stadium from the Red Bull Arena in New Jersey, homes of the New York City and New York Red Bulls.

Travel distances can be found to have significant impact on performance. I will consider the impact this has on match outcomes in the MLS in a future post. For new recruits of Inter Miami, they better be ready to travel. Although, Nashville SC will make this look short. More to follow on this. 

    Archives

    February 2023
    January 2023
    December 2022
    November 2022
    October 2022
    September 2022
    August 2022
    July 2022
    June 2022
    May 2022
    April 2022
    March 2022
    February 2022
    January 2022
    December 2021
    November 2021
    October 2021
    September 2021
    August 2021
    July 2021
    June 2021
    May 2021
    April 2021
    March 2021
    February 2021
    January 2021
    December 2020
    November 2020
    October 2020
    September 2020
    August 2020
    July 2020
    June 2020
    May 2020
    April 2020
    March 2020
    February 2020
    January 2020
    December 2019
    November 2019
    October 2019
    September 2019
    August 2019
    June 2019
    May 2019
    April 2019
    March 2019
    February 2019
    January 2019
    December 2018
    November 2018
    October 2018
    September 2018
    August 2018
    July 2018
    June 2018
    May 2018
    April 2018
    March 2018
    February 2018
    January 2018
    December 2017
    November 2017
    October 2017
    September 2017
    August 2017
    July 2017
    June 2017
    May 2017
    April 2017
    March 2017
    February 2017
    January 2017
    December 2016
    November 2016
    October 2016
    September 2016
    August 2016
    July 2016
    June 2016
    May 2016
    April 2016
    March 2016
    February 2016
    January 2016
    December 2015
    November 2015
    October 2015
    September 2015
    August 2015
    July 2015
    June 2015
    May 2015
    April 2015
    March 2015
    February 2015
    January 2015
    December 2014
    November 2014
    October 2014
    September 2014
    August 2014
    July 2014
    June 2014
    May 2014
    April 2014
    March 2014
    February 2014
    January 2014
    December 2013
    November 2013
    October 2013
    September 2013
    August 2013
    July 2013

    About

    This website was founded in July 2013.

    RSS Feed

    Categories

    All
    American Football
    Athletics
    Baseball
    Basketball
    Behavioural Economics
    Boxing
    Broadcasting
    Competitive Balance
    Cricket
    Cycling
    Darts
    David Butler
    Declan Jordan
    Drugs
    Ed Valentine
    Epl
    Esports
    Expenditure
    F1
    Fifa World Cup
    Finances
    Funding
    Gaa
    Gaelic Games
    Gambling
    Game Theory
    Gary Burns
    Geography
    Golf
    Greyhound Racing
    Guest Posts
    Horse Racing
    Impact Studies
    John Considine
    John Eakins
    League Of Ireland
    Location
    Media
    Mls
    Mma
    Olympics
    Participation
    Paul O'Sullivan
    Premier League
    Regulation
    Research
    Robbie Butler
    Rugby
    Simpsonomics
    Snooker
    Soccer
    Spatial Analysis
    Sporting Bodies
    Stephen Brosnan
    Swimming
    Taxation
    Teaching
    Technology
    Tennis
    Transfers
    Uefa
    Ufc
    World Cup
    Wwe

Related

The website is not formally affiliated to any institution and all of the entries represent the personal views and opinions of an individual contributor. The website operates on a not-for-profit basis. For this reason we decline all advertisement opportunities. 

Contact

To contact us email sportseconomics2013@gmail.com or find us on Twitter @SportEcon.