The Economics of Sport
  • Sports Economics
  • About
  • Workshop
  • Selected Publications
  • Book Reviews
  • A Primer on Gaelic Games
  • Upcoming Events
  • Media
  • Education
  • Resources & Links
  • Data

A Game Of Two Halves

30/7/2014


By Ed Valentine

I remember way back in 2007, after Tim Harford had visited UCC to give a talk about the Undercover Economist, I had a chat with Dr Robbie Butler about why Manchester United were so successful domestically. Robbie pointed out, following a game where United drew with Arsenal, that they may not have the best record against others in the top four but they beat all of  other teams week in week out. As the Red Devils have not enjoyed the best of seasons I decided to look at where the league was won and lost relative to performance within ‘mini leagues’ e.g. top four and the relegation three.

Chelsea don’t often lose at home; in fact the defeat to Sunderland was Jose Mourinho's first Premier League home defeat ever (78th home game). To some degree this result was a  snapshot of each of their seasons because Chelsea and Sunderland are the two teams who have picked up more points against teams in the top half than against teams finishing in the bottom half.

Chelsea had a great record against the top four clubs in 2013/14. They did the double over Liverpool and Man city, and crushed the Arsenal 6 – 0. Despite top form against the top clubs, Chelsea struggled at times against weaker opposition, losing to Crystal Palace and drawing against Norwich.

Sunderland, who managed to avoid relegation, won a point against Man City and took victory against Man United. Their head-to-head record against the relegated clubs however, has been poor, as they managed just two wins in six games.

A figure below helps illusrate the point. The red line shows the position a team would find themselves if they won the same points per game against top and bottom half teams – Sunderland and Chelsea (tangentially) are the only sides underneath the line.

Picture
There is an obvious cluster of clubs from Norwich through to Southampton which essentially tells us that the majority of the Premier League wins between one and two points against bottom half clubs, and between 0.5 and one points against top half sides. From this data, Sunderland are way off against the non top seven clubs. The graph also allows us to see the performance of Manchester United, who are stuck in the top segment, which is an area that suggests teams are better at beating bottom half sides than those in the top half. 

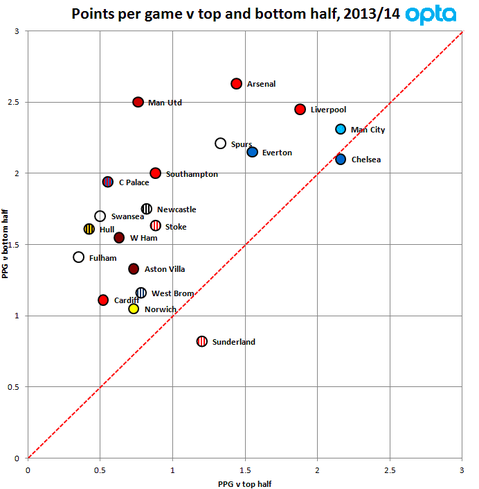
The Premier League is a competition with some degree of competitive balance. Norwich can lose 7 -1 to Man City but then draw the return game later in the season 0 – 0. There is a situation emerging however where the same three or four teams are challenging for European places and the rest are looking to avoid  relegation. A mid-table doesn’t really exist and so the Premier League truly is a game of two halves. 

Data courtesy of OPTA

Fama & The Galway Festival

28/7/2014

 
Picture
By Robbie Butler

Day 7 Results:
The final day proved to be just as disappointing as many before. The market had us all but beaten and the trend continued. In fact, it looked like we wouldn’t have any success until Windsor Park won the last race of the Festival at odds of 2-9. A truly disappointing week. Hats off to Eugene Fama. 2014 goes to the market.
Total stake: €10
Return: €2.44
P/L on Day 1: -€7.56
P/L on the week: -€29.14

Day 6 Results:
We needed somewhat of a minor miracle on Saturday to beat the market for 2014. Marty’s Magic got the ball rolling when finishing 2nd @ 9-4. However both Spryt and Initial failed to follow up on our early success. Silwana did win the 4.55pm but at odds of 2-5. Teach Nua and Call Vinnie were both unplaced in the final two races.

Total stake: €12
Return: €4.93
P/L on Day 1: -€7.07
P/L on the week: -€21.58

Day 5 Results:
Our busiest day of the week so far. A runner in all of the seven races but our luck didn't change. Only our 5th runner (Massinga 8-11) and our 7th (Forgotten Rules 9-10) passed the post first. Both were odds on and did little to stem the damage of the other five. We are well behind entering the weekend. 2014 isn't shaping up to be a success...

Total stake: €14
Return: €7.25
P/L on Day 1: -€6.75
P/L on the week: -€14.51

Day 4 Results:
Day four proved to be a tough one. Five horses went to post and for the first time this week D.K. Weld did not saddle a winner. 8-11 shot Tested finished 2nd but the odds were too short for us to collect. Only Hisaabaat's (16-1) 4th place finish in the Galway Hurdle saw a return. 

Total stake: €10
Return: €5.00
P/L on Day 1: -€5.00
P/L on the week: -€7.76

Day 3 Results:
Five Dermot Weld trained horses took their chances on Day 3 of the Festival. Of the five, four went off at a price of 13-8 or shorter. Only Moonbi Creek (6.05pm) didn't start as the market favourite. Like yesterday we had two winners (Whitey O'Gwain @ 9-10 and Brooch @ 4-9). However, unlike yesterday we didn't finish ahead, leaving us behind overall for the week to date.

Total stake: €10
Return: €6.69
P/L on Day 1: -€3.31
P/L on the week: -€2.76

Day 2 Results:
Four horses when to post for us today. Chinese Light finished 3rd @ Evens in the 6.05pm but we failed to see a return given the short odds. However, things rapidly improved. Defining Year finished 4th @ 6-1, while both Hidden Universe (9-4) and Antique Platinum (2-5) crossed the line in front. This leaves us ahead for the week to date.

Total stake: €8
Return: €11.80
P/L on Day 1: €3.80
P/L on the week: €0.55 

Day 1 Results:
As with previous years we stick to the following format: €2 win stake if the horse is shorter than 4-1; €1 each-way for horses 4-1 or more. DK Weld saddled seven runners on Day 1 resulting in an outlay of €14. Manhattan Swing (6th @ 15/8), Postulation (2nd @ 5/2), Pay Day Kitten (20th @ 14-1), Bobby’s Heart (10th @ 7-4) and Call Vinnie (2nd @ 5-4) all failed to deliver. We did collect in the 6.45pm when 7-1 shot Grecian Tiger finished 2nd. Our only winner arrived in the 7.45pm (Timiyan @ 3-1). 

Total stake: €14
Return: €10.75 
P/L on Day 1: -€3.25
P/L on the week: -€3.25 

***************************************************************************************************************************************************
The Galway Festival starts on Monday with seven days of both flat and national hunt racing action. Since 2012 we have used the festival and horses trained by top horseman Dermot Weld to test put Eugene Fama's Efficient Market Hypothesis (EMH) to the test.
 
For non-economists, Fama published a groundbreaking article in May 1970 called the "Efficient Capital Markets: A Review of Theory and Empirical Work", which appeared in the Journal of Finance and conceptualized the idea of the efficient market hypothesis. Put simply, Fama concluded that 'the house always wins' (as they say in Vegas). 

We disagree. If you had followed D.K. Weld over the past two Festivals, assuming the same stake on all horse, you would have seen a return of 12.5% in 2012 and 4.6% in 2013.  

Monday will see that start of our quest to, once again, ‘beat the bookies’. Let's hope 2014 proves to be just as profitable. 

The Greatest Olympic Legacy in the World, Ever!!

28/7/2014

 
By Paul O'Sullivan
Picture
Watching Sky Sports News one morning recently, I briefly caught sight of a headline (accompanying SSN report is available here) that said something along the lines of ‘London Olympics gave £15bn boost to UK economy in 2013’ (the official figure is £14.2bn). My initial reaction was ‘Hmmm, that seems quite high’,especially when one considers that the direct cost of hosting the Olympics was over £9bn.
 
The figure provided by Sky came from “Inspired by 2012: The legacy from the Olympic and Paralympic Games: Second annual report”, a joint report by the UK Government and Mayor of London.  Since the London Games in 2012, people like Boris Johnson and Seb Coe have proclaimed how great, and important, such a legacy is, irrespective of (or maybe because of) how much the Olympics cost or whether people in the UK even want, or care about, such a legacy.

On page 47 of the report, the £14.2bn is broken down into three sections: (i) £5.9bn of additional sales by UK companies as a result of UKTI (UK Trade & Investment) activity; (ii) £3.58bn of Olympic-related High Value  Opportunities (HVO) won overseas; (iii) £4.72bn of additional foreign direct investment into the UK. 
 
Little evidence is provided to back up points (i) and (iii). For instance, the £4.72bn of additional foreign direct investment into the UK is described as being ‘influenced by the Games’. With regard to (ii), the report states that the UKTI has targeted ‘the hosts of future major sports events’ and ‘global infrastructure opportunities’ and outlines some successes of UK companies wining various contracts. However, the report makes no attempt to quantify how much of these success were solely, or partly, due to hosting the Olympics. The implication seems to be that none of these contracts would have been won had London not hosted the Games.  

One gets the sense from the report that any benefits to the UK economy since 2012 are being attributed to hosting the Olympics, possibly to convince the public that hosting the Games was worth the £9bn price tag. Usually, benefits are determined by comparing an outcome in 2013 to the equivalent outcome in 2012. As well as this, it does not seem to be considered that an outcome may have occurred if the Games had not taken place, i.e. the ‘counter-factual’.  
 
For example, the report states on page 54 that “London welcomed 16.8 million international visitors in 2013,....an increase of 1.3 million visitors”. An impressive achievement of 8.56% growth!  However, a look at www.visitbritain.org shows that international visitors to London grew by 3.5% in 2010, 4% in 2011 but only by 1.1% in 2012. The lower growth in 2012 may be indicative of ‘crowding out’ and‘time-switching’ effects. While it is possible that the Olympics had some effect on tourism in 2013, it is hardly likely to explain all of the growth, much as some vested interests would like that to be the case.
 
Similarly, the report states, again on p54, that “Many leading institutions, including the British Museum, Natural History Museum and National Gallery, experienced large increases in visitor numbers in 2013”. Again, the implication is that hosting the Olympics drove this change. However, according to this article, Summer 2012 was one of the worst years on record for some major visitor attractions in London. While poor weather was a factor, it is also likely that a ‘substitution effect’ was relevant as visitors simply substituted Olympic activities for ‘normal’ tourism activities. Hence, a return to ‘business as usual’ conditions would give a relatively large level of growth.
 
There are numerous examples of only looking at the 2012-2013 effect, or of failing to try to take account of a‘counter-factual’ in the drive to paint the Olympics as having massive long-term benefits. While it is likely that the Olympics had some effect, extravagant claims made by politicians should always be viewed with an appropriate level of scepticism. 

Sportseconomics.org 1st Birthday

27/7/2014

 
PictureOne Year Word Cloud

David Butler

Sportseconomics.org is one year old today. We would like to thank all our readers for taking the time to look at what economists have to say about sport!


Following Wexford Hurlers

25/7/2014

0 Comments

 
By John Considine
This weekend the 2014 All-Ireland senior hurling quarter-finals take place.  Both games will be played, as a double-header, in Thurles on Sunday.  Dublin play Tipperary in one quarter-final.  The second quarter-final is between Limerick and Wexford.  It will be the fourth week in a row that the Wexford hurlers will be playing.  During that time they have generated a wave of support that should ensure that Semple Stadium is close to full on Sunday.  In fact it has been suggested by Wexford officials and supporters that Croke Park rather than Semple Stadium might have been a better venue.  Wexford County Board Chairman, Diarmuid Devereux, made his view know in the Irish Examiner and on 2FM's Game On.  An examination of the last 21 years of data on Wexford hurling games suggests that it is not clear that it will be Wexford supporters that will swell the numbers on Sunday.

Looking at single games (black squares) in the figure below, it has been 10 years since Wexford followers played in front of a crowd of more than 40,000.  In 2004 a superb last minute goal by Michael Jacob knocked Kilkenny out of the Leinster championship at the semi-final stage.  Wexford beat Offaly in a Leinster final in front of 46,800 spectators.  Wexford supporters travelled in huge numbers to an All-Ireland semi-final where they were heavily defeated by Cork.  A successful Wexford will bring more of their supporters to games.

Between 2004 and 2013 the numbers attending Wexford hurling games have tailed off.  A lack of success and the dominance of Kilkenny contributing to the decline in numbers.  Since 2006 no single game involving the Wexford hurlers has attracted more than 13,000 spectators.  Since 2009 it took a triple-header to get more than 20,000 people through the turnstyles to see the Wexford hurlers.
Picture
The last five years were pretty bleak in terms of success on the field for Wexford.  As a result, Wexford hurling supporters have added little to the revenues of the GAA.  A victory over Limerick on Sunday will change this situation.  However, the GAA revenues as a whole may not increase because Limerick supporters will not follow a Wexford team to Croke Park.

Diarmuid Devereux  made some more interesting observations when he pointed out the limited number of stand tickets available and the timing of their sale.  Wexford were the last of the quarter-finalists to qualify.  Unfortunately, the tickets for the quarter-finals went on sale prior to their qualification.  It is something the GAA should consider for future years.
0 Comments

Doping in Sport: Man Vs Horse

24/7/2014

 
By Robbie Butler

In 1998 the Tour de France made its one and only visit to Ireland. As a teenager, I  vaguely remember watching the riders race through the streets of Waterford city.  Today I recall little from the race. My one abiding memory from the race is sadly that of a doping issue, involving a team I had never heard of but still remember, Team Festina. 

Many argue that 1998 was the year cycling was permanently tarnished by doping disclosures. A police investigation in France during the ’98 Tour forced two teams (Festina and TVM) to exit the race. As a result a peloton strike ensued with five teams opting to pull of the Tour in protest to the treatment of Festina and TVM riders. As a result, my interest in cycling was lost forever.
Picture
This week news broke that the Queen’s horse Estimate had tested positive for morphine. You may recall the Sir Michael Stout trained mare, the first horse in history to win the Ascot Gold Cup for a reigning monarch last year, amid joyful scenes in the Royal Box. While the story of Estimate comes as a surprise to most in racing, it is only recently that the sport was left reeling by news that 11 Godolphin trained horses had tested positive for banned anabolic steroids, including Classic winner Encke. This got me thinking. Could both sports be the victims of on-going performance enhancing drug-use?

I decided to compute at the average speed (kmph) of the winner for both the Epsom Derby (premier three-year-old flat racing in Europe) and the Tour de France for the post-war period. One would expect a marginal improvement in both events given improvements in sports technology, nutrition, sport science and training methods. The data is presented with a trend line applied to each event.
Picture
The illustration above proves to be very interesting. Since 1947, there has been little improvement in the speed or winning time (blue line) in the Epsom Derby (flat trend line). The winning horse has run the course at around 55kmph on average. One could interpret this as evidence that the sport is ‘clean’. This could also point to no improvement in training methods or horse nutrition, little innovation or improvement in jockey performance or lack of development of equipment in the horse racing industry, which could aid perfromance. 
 
The Tour de France paints an entirely different picture. The average speed of the winning cyclist from 1947 to 1957 is recorded at 33.45kmph. Compare this to 2003-2013 where the average speed of the winner rises to 40.37kmph. That's an improvment of more than 20%. 2013 winner Bradley Wiggins rode 30% faster on average than 1947 winner Jean Robic. This could be a result of the fact that the race is roughly 25% shorter than the first post-war race, meaning riders can afford to use up more energy cycling faster. It could also point to the fact that the cycling industry has been far better over the course of the past seventy years, than those in the horse-racing industry, at technological innovation, nutrition and sports science, resulting in faster times.  Or better still, maybe humanity is evolving more rapidly than our equine cousins and in the centuries ahead cyclists will complete the 2.423km covered in the Derby faster than the winning horse! 

I’m not so sure....

Win Percentages for Home Teams in Gaelic Games

22/7/2014

 
By John Considine
As Dublin footballers cruised past Laois, Wexford, and Meath on their way to another Leinster football title, a few grumbled about the advantage Dublin get from playing all their games in Croke Park.  To keep matters simple, it would be nice to be able to calculate the percentage of games that Dublin footballers win at home and the percentage that they win away from home.  Unfortunately, Dublin footballers rarely play outside Croke Park.  The size of the Dublin football following means that most grounds outside Croke Park would struggle to hold the crowd wanting to attend (see previous post here).  As an alternative the winning percentages of home teams in gaelic games for the period 2008-11 are presented below.

The numbers in the table below are for the four championship years between 2008 and 2011.  They are based on just over 60% of the senior championship games played in those years because the other 40% of games were played on neutral ground.  Croke Park features prominently in the games held at a neutral venue.  All later stages of the All-Ireland series tend to be held in Croke Park.  This is a neutral venue for all games not involving Dublin.
Picture
Let us ignore the anomaly that is the Connacht (football) championship for the moment. It seems that the home team wins between 50% and 60% of the games. The away team wins between 33% and 44%. It is clear that there is an advantage to being a home team.

Connacht is an outlier. One of the reasons for this is that New York and London play in the Connacht championship. Despite London's heroics in the 2013 championship, it would be fair to say that these teams are the weaker teams in the competition. To help foster the game in these parts of the world, the GAA allow London and New York to play their first games at home. In the period 2008-11 both teams lost their opening game in each year. If these games are removed then the winning percentage for home teams in the Connacht championship is 50% and the away team wins just under 44% of the time.

For the record, Dublin footballers have an impressive 81% win rate in Croke Park over the 2008-11 period.  It would require a more detailed analysis to say how much of this is due to them being a good team and how much is down to home advantage.

Supporter-Owned Clubs Proving their Worth

20/7/2014

 
By John Paul Clifford
Picture
There is a growing problem in football in many countries, which has also affected Irish football significantly in recent years, of clubs living beyond their means and going under due to the weight of excessive debt. This becomes a real problem for fans losing the team they adore, along with jobs lost, unpaid debt to local businesses and a void being formed which once brought people together in a positive manner. The massive rise in transfer fees and wages across the continent at the top levels has not improved the overall game. Those with the massive television deals may benefit but the rest are left to fight among themselves for any smaller deals that may come their way.

In fact, a recent European Commission report focusing on the professional sport transfer market proves that the above is indeed correct. This has led to a massive gap between the highest tiers across Europe and anything outside the top divisions, making it increasingly harder for other clubs to compete. Sean Kelly MEP spoke on behalf of European Parliament’s committee on Culture and Education which includes sport, saying that ‘’The figures are striking, €3 billion is spent every year on transfers in professional football in Europe, with only approximately 3% of that or €60 million filtering down towards the smaller and amateur clubs for the development of the sport and talent for the future.

The proposal being floated is to have a 'fair play levy' on these exorbitant transfer fees would help smaller clubs and grassroots threefold: compensating them for the costs of training and educating young players, funding development of sport at community and grassroot level, as well as helping clubs to compete on a more level playing field’’. 

The above figures show that finances are not filtering down through to the lower levels and grassroots clubs in the game, who often provide the initial starting point and footballing education for the future‘superstars’ of the game who later end up with the big clubs.

This brings in a fundamental question though, if 97% of the transfer fees don’t ‘trickle down’, where does it go? Well, a lot of the top clubs across Europe have to serve many masters such as investors, owner’s profits, operating costs, debts, high wages, dividends, and focus on the stock market. A lot of this money within the top clubs may be repatriated to areas outside with which the clubs themselves actually operate in, which leads to less money within the local economies, less spin offs, lower growth (if any) and lower social benefits to the local communities. Some clubs even have their company's incorporated outside of the locality they represent as a club for tax reasons. Some are incorporated in the Cayman Islands. This reduces taxes and forces money which could have been reinvested or kept within the locality of the club, further increasing the 'value added' aspect to the economic impact the club has in the local region. 

This is why fan ownership can offer a fantastic alternative. Less financial risk is likely to be taken, as fans on the clubs board of management are unlikely to personally guarantee financial risk in a club they love. The fans and board often hold many skills from their personal and professional lives which can be of great benefit to their club. This can actually save clubs money in the long run as they don’t have to seek it externally. Fans generally pay a subscription to become a shareholder or member of the club. This generates a nest egg for the club providing security for any unforeseen situations that may lay ahead. That pot of money can also be used to improve the club, reduce debts or for social projects which can help both the club and local community. Fans are unlikely to be focused on dividends, returns, benefits, expenses, and massive profits. This means that the money is generated within the club, is more likely to remain within the club. Any profits are very likely to be reinvested in the club and/or local community. This creates both economic and social benefits to local community.

Picture
Clubs that have their fans at the heart of their ownership structure allows for instant feedback on all issues which the club can take on board and address more readily, rather than clubs which are privately owned and may have to commission studies, reports and interviews to get a feeling of how the people (fans) outside of the clubs ownership feel about fundamental issues. It is only logical for fans to have a large input in to the running of the club. After all, these clubs are a business, any good business must look at its market and how the market feels about issues. By bringing the market in to an internal aspect of the club, this creates goodwill, loyalty, accountability and long term financial backing (in the form of membership fees) which the club can rely on. That creates a financial safety net or ‘rainy day’ fund for any future situations. This is in contrast to financial backing from privately owned groups who are likely to pull the plug on their investment as soon as it becomes unlikely that a return will be made. In fact, director’s loans may be placed on the club, pushing it in to further debt until the investor’s returns are met. This can financially strain future owners of the club, who may be the fans, as they are likely to be uninterested in paying the previous owners for their work on top of purchasing the club. However, if they are not met, this can force the club in to insolvency and possible extinction. The fan ownership model creates a sustainable, long term strategically planned club with a constant fundraising mechanism in place, in the form of membership subscriptions.

In recent years in the League of Ireland (Airtricity League), many clubs have faced several financial situations. Some have unfortunately met their demise, whilst others have become supporters owned clubs. Cork City, Sligo Rovers, Shamrock Rovers and Dundalk are just a few who have supporters groups at the heart of the decision making with respect to the running of the club. In times before some clubs had become supporter owned, massive unsustainable losses was surrounding the league as a whole. This sadly led to the demise of some clubs including Sporting Fingal, Monaghan United and Kildare County. Some other clubs had to rejoin the league years later or reform under new ownership, such as Cork City and Derry City. In 2007, the collective losses of the league was €6.9 million. In 2012, the league recorded a collective profit of €241,000. Some of this can be distorted by prize money received by Shamrock Rovers from their very successful 2011 Europa League run, but it remains to be seen if it was included in the 2011 or 2012 accounts. Either way, the problem has stabilised for the league as a whole. Clubs run by fans are being run far more prudently. There have been no massive financial losses recorded either, the most being €40,000. As more clubs have become supporter owned, they have become far more prudent, only spending what they take in, being conservative with estimates. This shows why the problem has reduced and hopefully with more supporter involvement, we can see the league record yearly collective profits on a consistent basis. 

As the huge losses that once gripped the League of Ireland have been eroded, this allows money generated by clubs to be spent in other forms, rather than servicing debt. Stadium facilities, training grounds, under age teams and community projects can be considered and invested in by the clubs and supporters, the possibilities are endless, with less debt and supporter ownership, fans have the power to make real, sustainable and positive change for their clubs. The feeling that a supporter can have even the smallest say in the running and direction of a club is hugely encouraging, rewarding and also keeps them a supporter for life, leading to a sustainable market and model. The days of relying on outside investment based on unsustainable spending and lack of sound structures within clubs appear to be gone. Clubs have focused on prudent financial planning and developing structures, links with the community and underage teams, leading to more youths getting senior experience, has resulted in a more financially sound league with more supporter involvement in the decision making process at many of those clubs. This appears to be the way forward and for now, for the first time in a very long while, clubs and supporters are rowing in the right direction together, leading to healthier clubs and a healthier league. The supporter ownership model is leading the way.

This article is based on one that originally appeared in the European Commission supported ‘Heart of the Game’ document, which was created by the FORAS Trust.

Height and Central Defenders in Brazil

19/7/2014


By David Butler

Although I'm not as familiar as I once was with the faces of the international footballers that lined out in Brazil I can still usually hazard a guess as to a player’s general position before kick-off. I'm sure every football fan is familiar with the sequence of a camera moving by a starting eleven as a country's national anthem rings out, during which we get a glimpse of a player’s stature, something which usually hints to a players position. 

My hunch is that the variability in height is least within goalkeepers and then central defenders. Here, I collect the data on central defenders as I thought there would be 100+ World Cup observations.  

In the 2014 World Cup finals 105 footballers played in the central defender role for some length of time. This was either part of a 2 or 3 player partnership depending on the formation adopted. Not all of these players are considered central defenders by trade and some would have a default position in central midfield or as full-back. At 198cm, the tallest centre half in the competition was Germany’s Per Mertesacker. He was the 5th tallest player in the competition (behind 4 goal keepers - Forster, Begovic, Fejzic and Courtois) and was the tallest outfield player.To put this height in perspective, at 198cm Mr Mertesacker shares a stature with sports stars such as Kobe Bryant, Michael Jordan, Wladimir Klitschko and Juan Martín del Potro.

The average height of the 105 central defenders at the 2014 World Cup was 186.5cm (SD = 4.45), that’s just over 6’1. The smallest player at the competition was Edgar Salli (163cm) of Cameroon and with regard to central defenders, the 4 players that played in central defence for Chile are in the bottom 5 places for height.

On average the German (191.50cm), Belgian (191.33cm) and Croatian (190cm) central defensive partnerships came in as the tallest in the competition respectively. The Japanese and Chileans were the smallest. In fact, Chile were the only team at the competition to have an average central defesive partnership height that was under the 6 foot benchmark. 11 of the 13 European teams in the competition are in the top 14 also.

By the looks of the data, I would tentatively induce something that's not exactly shocking news - if your an aspiring Irish central defender your probably going to have to be very close to 6’1 on the lower bound to make it in the position at an international level...or else you may need to find a Chilean granny!

Picture
Picture

Gaming it: Incentives, Cheating and the Grey Area in Sport

18/7/2014

0 Comments

 
by Declan Jordan
Picture
A book I really enjoyed during my summer holiday (and would recommend highly) is Stillness and Speed by Dennis Bergkamp. It was written with David Winner, who also wrote the wonderful Brilliant Orange - The Neurotic Genius of Dutch Football. 

While watching (and supporting the Dutch at the World Cup - in part influenced by Winner's earlier book) I was struck by the reaction of TV commentators and analysts to Arjen Robben's propensity to fall in a heap at the slightest touch from a defender. Even when it was clear that Robben had been fouled he made sure the referee noticed it. 

I was reminded of a passage in Dennis Bergkamp's book:

In Italy you have two strikers against five defenders, so you have to find ways to protect yourself. You have to find ways of keeping the ball, doing your job properly and doing it well. So, if you are up against five defenders and you get the ball and you get a little touch, you go down. Is it cheating? In England it is cheating. In Italy it's just part of the game. So you adjust to the Italian game. It's normal. And then you come to England and you realise, wait a minute, you can't do that here. It's not acceptable. I'm not sure...I don't call it cheating. I have seen players who cheated. It's very difficult to say, but I sometimes used it. But I think most of the time I was honest.

A lot of times you get pushed or you feel a little touch and that stops you reaching the ball. If you run on you won't get a free-kick because no-one noticed it. So you have to react a little bit more. And then you get the free-kick. (You exaggerate a little to bring it to the referee's attention). But there has to be contact before I go down. I think cheating is something different. For me, cheating is if you go past the defender, there is no contact then you roll over, you go down. The schwalbe, as the Germans say. That's real cheating. I didn't do that. But if there is contact, it's a matter of how do you exaggerate? If you don't, you won't get a free-kick. If you do you might get a free-kick or a penalty or whatever.

Interviewer: But too much of that is also cheating surely?

Yes, but it's a really difficult area. For me, it's not acceptable if you don't get touched but go down because you still want a free-kick. I really don't approve of that. But where you are always battling with the defender and he's touching you and you stay on your feet, you're not going to get a free-kick. I think you have to act a little bit..."Jeez, come on ref!" There are plenty of times where a foul is committed and you don't get a free-kick. What do you call tha then? That's the other side of it. You get pushed and the referee doesn't see it. Is that cheating by the defender? That doesn't exist does it? It's cheating. He's cheating. The referee didn't see it, but he pulls you back. That is the other part of cheating, I feel. Doing something behind someone's back and that happens all the time. I got really frustrated in my first season at Arsenal. I'm definitely not a cheat and I don't think people see me in that way. (Pages 175 -176)
Picture
I think there is a lot in that long quote that explains Robben's attitude and behaviour, as well the attitude and behaviour of other players and commentators. It's quite interesting to me how Bergkamp refers to 'diving' or at least 'exaggerating' in the context of doing his job properly and doing it well. It's also clear from this passage that cheating is not a black and white issue. There are cultural differences. The label of cheating is contingent on the circumstances. For example, handling the ball in the middle of the field in a mid-table league game (that may even eventually lead to a goal) is not considered cheating in the way that handling the ball in the opposition's penalty area in World Cup play-off game in Stade de France might be.

I made a presentation to the UCC Economics Society conference last February that addressed this grey area in cheating from an economic perspective. I've saved the presentation to YouTube and it can be seen below. 

The central argument I make is based on questioning an implicit assumption in the classical economic approach (attributable to Gary Becker) that sees cheating - and other crimes - as a sort of cost-benefit analysis. A potential cheater will (perhaps sub-consciously) calculate the costs of being caught (a red card or the opprobrium of fans) times the likelihood of being caught (is the ref looking). This will be weighed against the benefits of cheating (getting a penalty or stopping an opponent from scoring). This assumes though that the cheater knows each of these elements. Perhaps this is not unrealistic. On this blog we've already seen work on the cost of a red card.

However, the other assumption implicit in this approach is that the cheater knows whether the action he or she is about to take is cheating. This isn't an issue perhaps when we talk about taking down a player that's through on goal or blocking a shot on the goal line or injecting oneself with EPO. But what about something like diving or losing a game to get what one feels is a better draw in a subsequent round? Can these be agreed to be cheating? Dennis Bergkamp alludes to differences in culture between Italy and England determining whether the same actions on the pitch were cheating or not. 

A paper referred to in my presentation by Burrus, McGoldrick and Shuhmann in 2007 (subscription required) finds a difference in perceptions and self-reporting of cheating among students before and after definitions of cheating are provided. This suggests to me that a definition of cheating is needed. I suggest a distinction between cheating and gaming where cheating is the breaking of rules to gain advantage while gaming is the breaking of etiquette to gain advantage. The latter is not cheating - even if it may be unsporting. It is up to sports bodies to decide by codifying their rules what behaviour they wish to punish. They cannot then punish players who seek advantage while observing the rules set out by the sports bodies.

0 Comments
<<Previous

    Archives

    February 2023
    January 2023
    December 2022
    November 2022
    October 2022
    September 2022
    August 2022
    July 2022
    June 2022
    May 2022
    April 2022
    March 2022
    February 2022
    January 2022
    December 2021
    November 2021
    October 2021
    September 2021
    August 2021
    July 2021
    June 2021
    May 2021
    April 2021
    March 2021
    February 2021
    January 2021
    December 2020
    November 2020
    October 2020
    September 2020
    August 2020
    July 2020
    June 2020
    May 2020
    April 2020
    March 2020
    February 2020
    January 2020
    December 2019
    November 2019
    October 2019
    September 2019
    August 2019
    June 2019
    May 2019
    April 2019
    March 2019
    February 2019
    January 2019
    December 2018
    November 2018
    October 2018
    September 2018
    August 2018
    July 2018
    June 2018
    May 2018
    April 2018
    March 2018
    February 2018
    January 2018
    December 2017
    November 2017
    October 2017
    September 2017
    August 2017
    July 2017
    June 2017
    May 2017
    April 2017
    March 2017
    February 2017
    January 2017
    December 2016
    November 2016
    October 2016
    September 2016
    August 2016
    July 2016
    June 2016
    May 2016
    April 2016
    March 2016
    February 2016
    January 2016
    December 2015
    November 2015
    October 2015
    September 2015
    August 2015
    July 2015
    June 2015
    May 2015
    April 2015
    March 2015
    February 2015
    January 2015
    December 2014
    November 2014
    October 2014
    September 2014
    August 2014
    July 2014
    June 2014
    May 2014
    April 2014
    March 2014
    February 2014
    January 2014
    December 2013
    November 2013
    October 2013
    September 2013
    August 2013
    July 2013

    About

    This website was founded in July 2013.

    RSS Feed

    Categories

    All
    American Football
    Athletics
    Baseball
    Basketball
    Behavioural Economics
    Boxing
    Broadcasting
    Competitive Balance
    Cricket
    Cycling
    Darts
    David Butler
    Declan Jordan
    Drugs
    Ed Valentine
    Epl
    Esports
    Expenditure
    F1
    Fifa World Cup
    Finances
    Funding
    Gaa
    Gaelic Games
    Gambling
    Game Theory
    Gary Burns
    Geography
    Golf
    Greyhound Racing
    Guest Posts
    Horse Racing
    Impact Studies
    John Considine
    John Eakins
    League Of Ireland
    Location
    Media
    Mls
    Mma
    Olympics
    Participation
    Paul O'Sullivan
    Premier League
    Regulation
    Research
    Robbie Butler
    Rugby
    Simpsonomics
    Snooker
    Soccer
    Spatial Analysis
    Sporting Bodies
    Stephen Brosnan
    Swimming
    Taxation
    Teaching
    Technology
    Tennis
    Transfers
    Uefa
    Ufc
    World Cup
    Wwe

Related

The website is not formally affiliated to any institution and all of the entries represent the personal views and opinions of an individual contributor. The website operates on a not-for-profit basis. For this reason we decline all advertisement opportunities. 

Contact

To contact us email sportseconomics2013@gmail.com or find us on Twitter @SportEcon.