The Economics of Sport
  • Sports Economics
  • About
  • Workshop
  • Selected Publications
  • Book Reviews
  • A Primer on Gaelic Games
  • Upcoming Events
  • Media
  • Education
  • Resources & Links
  • Data

New Gaelic football championship system proposals

29/1/2016

 
Picture
By John Eakins
 
It’s not often that I find myself agreeing with Joe Brolly but his article in last Sundays Independent proved to be an exception (see here). Brolly was writing about the GAA’s proposal to create a new ‘B’ Gaelic football championship, comprising teams that are in Division 4 at the conclusion of the National Football League. These teams can play in their provincial championship but will not be allowed into the football qualifiers with the ‘B’ championship instead provided them with an opportunity to play for some silverware.
 
For those of you who know the GAA, this proposal will bring back memories of the Tommy Murphy Cup that ran for a number of years in the 2000’s but was ultimately scrapped. Brolly recalls the Tommy Murphy Cup in his article, but not fondly, giving a number of reasons why the competition ultimately failed. So if it failed then why would it work now? It doesn’t take a genius to work out the merits of this argument.
 
Instead of the ‘B’ championship/Tommy Murphy Cup, Brolly favours a two-tier Gaelic football championship system with 16 teams competing in the Sam Maguire and 16 in the second tier. Most information on the proposal is given in the article but essentially, the ranking of teams (from 1 to 32) would be determined by finishing position in the national football league and finishing position in the provincial football championships. Importantly the winner of the second tier competition would automatically compete in the top tier competition in the following year. The 16 teams in both tiers would play on a knock-out basis for their respective ‘All-Irelands’.

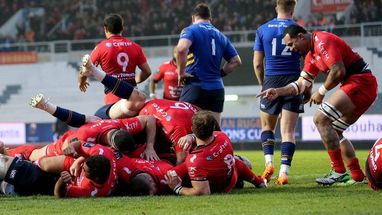
I also like this proposal mainly because its follows a similar format to a number of other successful competitions in other sports. For example, the two-tier format proposed is very similar to the format of the current European rugby competitions, with the champion’s cup as the top tier competition and the challenge cup as the second tier competition. Even the proposed qualification routes for the Gaelic football teams are somewhat similarly structured to the European rugby competitions.
Picture
Picture
What strikes me as the most important element of the European rugby competitions is that whilst one is a top tier competition and the other is a second tier competition, the perception of one being a secondary competition doesn’t appear to be great. In sports economics jargon, the competitive balance within each competition and between each competition is strong. How this is developed is down to a number of factors. Branding is one, not calling the challenge cup a ‘B’ competition for example and also treating both competitions equally in terms of when the matches are played from groups games all the way up to the final (with the challenge cup final on the Friday and the champions cup final on the Saturday as opposed to the example given by Brolly of the Tommy Murphy Cup being played at 12.15 on All Ireland Quarter Final day!). Having a reasonably high turnover rate of teams which move between both competitions also helps to close the gap.    
 
The GAA should scrap their proposal for a ‘B’ Gaelic football championship and go with the two-tier championship system which Brolly outlines. Creating a perception where one is not a secondary competition is key to the success of such a proposal however with the European rugby competitions as a model that could be followed.
Long-run Competitive Balance and the League of Ireland

27/1/2016

 
By Farai Jena & Barry Reilly
 
In a recently published book (Money and Football: A Soccernomics Guide) Stefan Szymanski examines, inter alia, the concept of club dominance in European football leagues over the last 50 years. Szymanski reports, using data from 20 European leagues, that an average of only 10 different clubs have won their domestic league titles over this half century, ‘….way below what you would expect to see if there were balance in the league’. The League of Ireland, providing 15 different champions over this period, is identified by Szymanski as one where the number of different winners is considerably above the average.  This could be taken to suggest that it is one of the better balanced leagues in Europe.

There are a number of alternative methods available to determine a league’s long-run competitive balance. One such measure is known as the Herfindahl Index of Competitive Balance (HICB). In an extreme hypothetical case where all teams complete the season with the same number of points (i.e., a perfectly balanced league), the HICB value is one.  In contrast, the greater the inequity in the distribution of points across teams at the end of the season, the higher above unity is the HICB and the poorer is the league’s competitive balance.

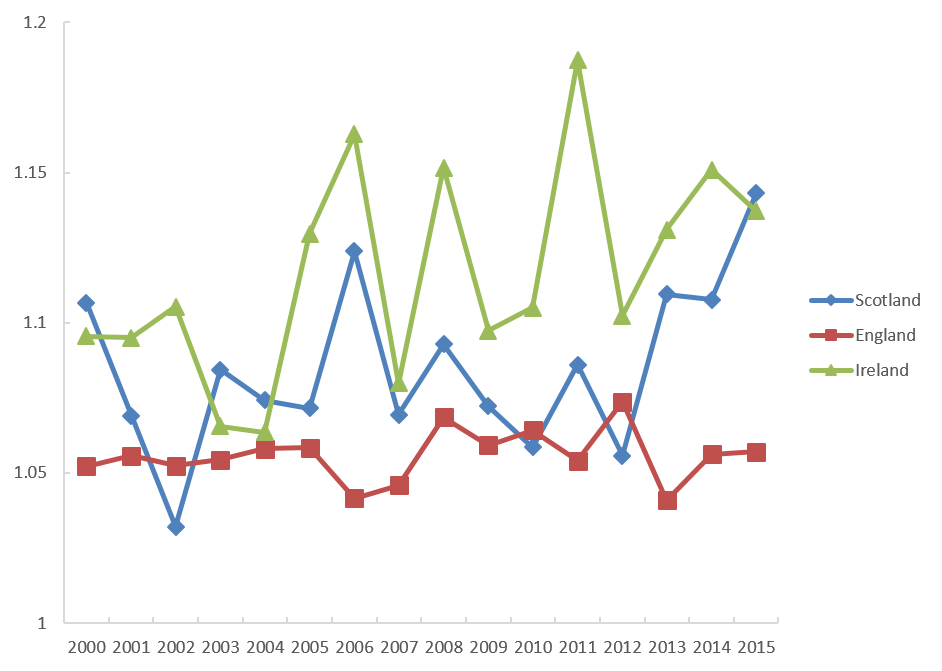
In order to explore the issue of competitive balance for the League of Ireland we use the HICB to compare its degree of balance with a set of neighbouring leagues in England, Scotland, Wales and Northern Ireland over 16 recent seasons. The leagues are selected on the basis of arguably possessing comparable playing standards to the League of Ireland. 
​
Figure 1 plots the HICB for the League of Ireland Premier Division, the average of tiers three to five in England, and the average of tiers two and three in Scotland. The averages are used here because little material difference in index values is detected across these leagues over the relevant seasons. In contrast to the leagues in England and Scotland, competitive balance is found to be markedly inferior in the League of Ireland. In addition, the league’s index also exhibits a greater degree of volatility over time particularly with respect to its English counterparts. 
Picture
Notes to Figure 1: The HICB values for England are an average of the third, fourth and fifth tiers of English Football. The HICB values for Scotland are an average of the second and third tiers of Scottish Football. Given the introduction of summer soccer in Ireland in 2003, the years reported on the horizontal axis relate either to the second year of a conventional playing season played across two calendar years or a summer soccer season played within one calendar year.
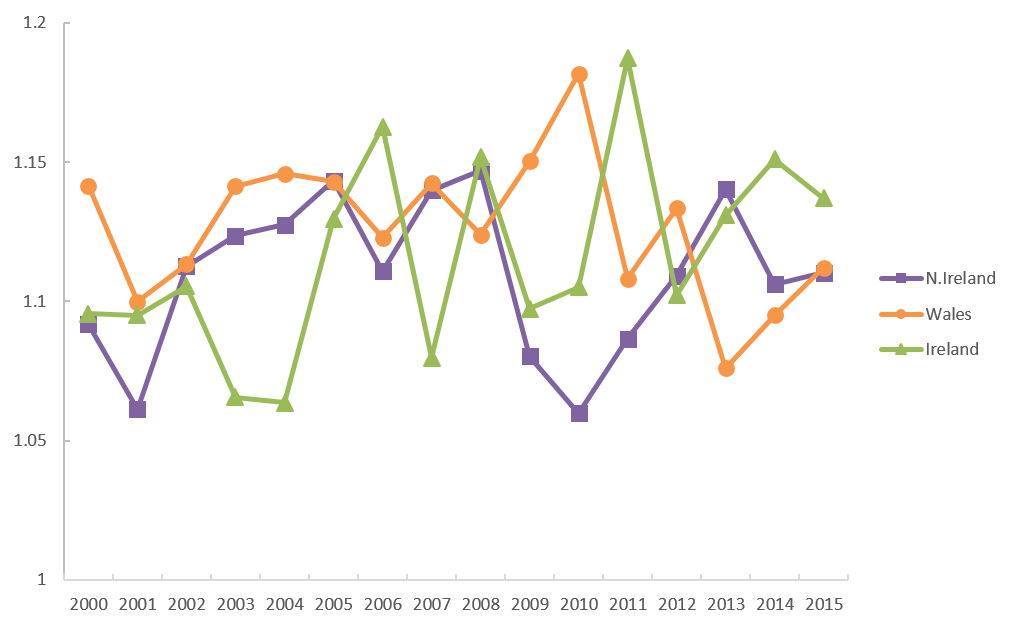
Figure 2 plots the League of Ireland’s HICB with those for the top tiers in Wales and Northern Ireland. These two close neighbours register a fairly high degree of competitive imbalance in common with the League of Ireland, though the index for the latter is characterised by a greater degree of volatility compared to the former two. 
Picture
Notes to Figure 2: Given the introduction of summer soccer in Ireland in 2003, the years reported on the horizontal axis relate either to the second year of a conventional playing season played across two calendar years or a summer soccer season played within one calendar year.
Further, and not reported here in detail, the top tier leagues described by Syzmanski as the most plutocratic (viz., England, Germany, Spain and Italy) all register lower average HICB values than the League of Ireland over these 16 seasons, though the most dominated league in Europe (i.e., Scotland’s top tier) averages slightly higher.    
​
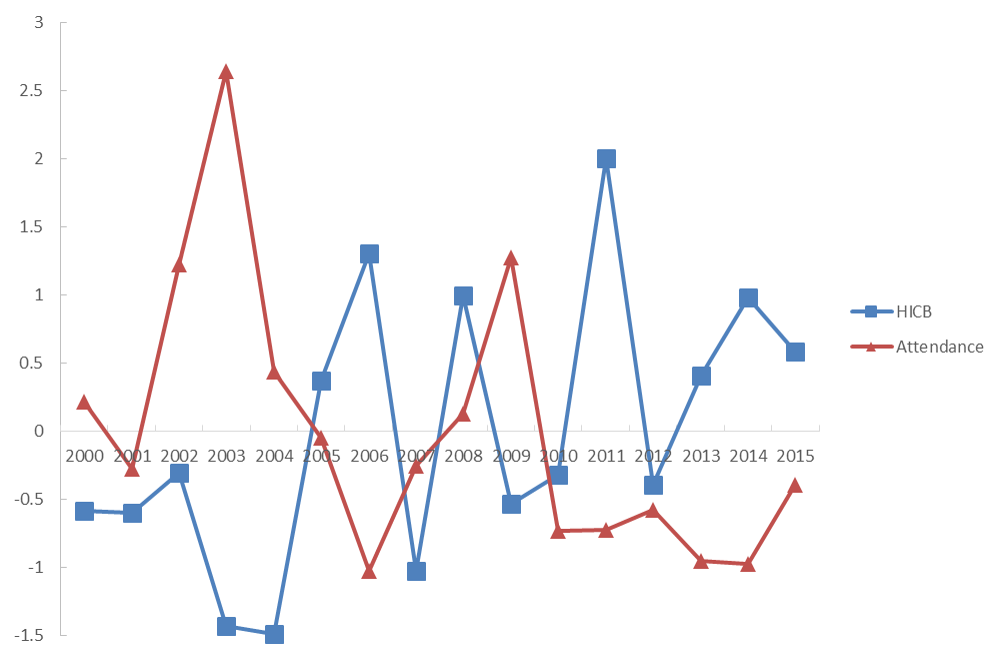
A reason why a league’s long-run competitive balance might actually matter is because of its potential relationship with attendance.  A poorly balanced league is likely to prove unattractive to spectators.  Figure 3 plots average attendance and the HICB values (both standardized) for the League of Ireland over these 16 seasons in order to discern any informative patterns. The plots reveal an inverse relationship between competitive imbalance and average attendance. The correlation coefficient is computed at –0.60 and is statistically significant at the 5% level using a t-test with 14 degrees of feedom. It should be emphasized that this finding is best interpreted as suggestive since nothing informing the causal relationship between these two variables can be inferred from this statistic.  However, competitive imbalance and attendance appear to move inversely in this league.
Picture
Notes to Figure 3: The HICB and attendance variables are standardized by subtracting the relevant mean and dividing by the relevant standard deviation to ensure both variables are expressed in comparable units of measurement for plotting purposes.
The domination of a league over time by a small number of teams may suggest long-run competitive imbalance but it does not imply that less dominated leagues by this defintion are competitively balanced.  The descriptive evidence reported here covering 16 recent seasons, and over which time seven different teams won the League of Ireland title (suggesting even weaker dominance than that reported by Syzmanski’s analysis), reveals the domestic league is competitively imbalanced when compared to either neighbouring lower tier leagues in England and Scotland or even Syzmanski’s set of plutocratic European leagues.  The very casual empirical evidence provided here also suggests that the lack of competitive balance within the League of Ireland might actually matter for attendance. 
 
Farai Jena is a Teaching Fellow in the Department of Economics at the University of Sussex.  Her research interests are in the area of applied microeconomics and include the economics of migration, migrant remittance behaviour, and the demand for football. 

Barry Reilly is Professor of Econometrics in the Department of Economics at the University of Sussex. His research interest include labour economics and the economics of sports.  He has published research on developing country labour markets and on racial discrimination in football.  

Opportunity Cost Fantasy Football Style 2

25/1/2016

 
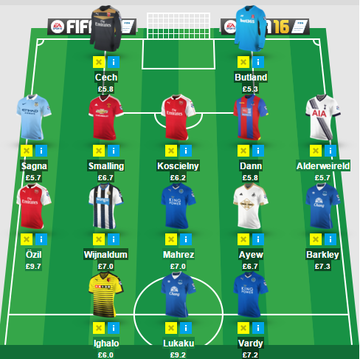
PictureHighest Scoring Team To Date. Source: http://fantasy.premierleague.com/
By Robbie Butler

Previously, I explored the concept of opportunity cost by looking at the decisions that players of the Premier League’s Fantasy Premier League face on a weekly basis. For those unfamiliar with the concept, opportunity cost is what one must give up to get something else. The Fantasy Premier League provides us with an excellent example of this on a weekly basis.

First conceptualised for the Premier League in the mid-1990s, the game has grown in popularity and now consists of an on-line competition where football fans get to pick players from a given league, with fictitious money, to form their own team. One of the most popular versions of the game is run by the official Premier League website.

At the start of the season a budget of £100 million is allocated to each player in order to form a squad. In total fifteen players must be purchased from this money. One free player swap can be made each week. Further player changes result in a points reduction.

What might seem like an easy task (picking fifteen players) becomes very difficult. Finite resources and decision making, both central tenants of economics, come to the fore. For example, in order to have an expensive goalkeeper or striker, something else must be sacrificed e.g. relatively expensive defenders.  

My previous post illustrates this point. The cost of the most expensive 15 players from last season was £135.1 million pounds. This point lies far beyond the budget constraint and is unattainable. The Dream Team from last season (highest scoring players) is also beyond our means at £116.5 million.

This season is quite different. Most would admit it was been a rather unusual season to date, highlighted by the fact that Leicester City, 5000-1 to win the league in August 2015, sit top of the table with just fifteen games to play. Players such as Jamie Vardy, Riyad Mahrez, Odion Ighalo, Scott Dann, Georginio Wijnaldum, Andre Ayew and Jack Butland are all among the top scorers. Collectively, these seven players cost just £45 million, an average of just £6.4 million. The total cost of the highest scoring team to date comes in at just £101.3 million. (See picture).

The most expensive team on paper costs a whooping £129.3 million but cannot be assembled.
​
The market is adjusting. The players listed above are all increasing in value as demand for their services goes up amongst fantasy football players. However, it seems this season the cost of operating effectively within ones budget is far easier than in seasons gone by. We can thank Vardy, Ighalo, et al. for this. 

Sports Capital Payments to Wexford 2009 – 2014

23/1/2016

 
by Kathy Stout

In previous posts John Considine has extensively examined the allocation of the Irish Sports Capital Grant (here, here, here, here and here). This post examines the allocation, between 2009 and 2014, for one such county; Wexford.

Wexford’s sports capital payments are an example of a matching grant which is where the relevant governmental department matches funds contributed by the applicant. In this scenario of 100% of the funding, the state pays for 70%, the other 30% by the sporting institution. Wexford did not engage in any major development projects so is below the average level of payments per county from 2009 to 2014. One of the main observations found is despite the GAA receiving the highest number of payments, football associations were allocated the highest amount of funding per sport due to their ability to give more to the matching grant scheme from the profits they make.

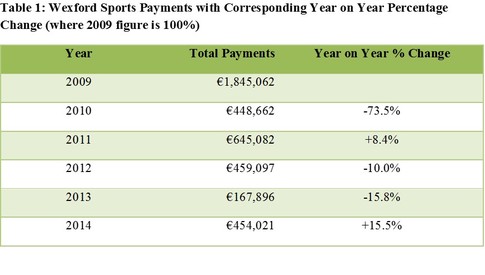
Table 1 below provides information on the annual grant provided to the county and the annual percentage change in allocation. The striking drop in funding is explained in part by its correspondence with the Irish fiscal crisis,as the economy had contracted from $273.7bn in 2008 to $233.5bn in 2009 with a further drop to $218.4bn in 2011.
Picture
Another explanation for this initial drop is the restriction on grant applications in 2008. After this year applications for grants by sporting institutions were not accepted, however payments were still being made for the following years based on previous applications. In Wexford’s case the majority of these had been paid in 2009, accounting for the considerable decrease in 2010. 

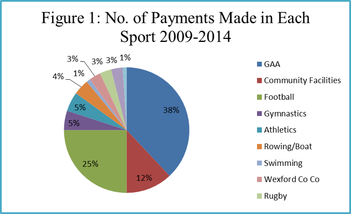
​Whilst the average payment size does see a drop from 2009 to 2010, there is substantial variation over the following years showing that it is the number of payments made, and not the average payment size, which makes the most impact on the overall yearly amounts paid out. The average payment in 2012 is €41,736, relatively speaking not far from the 2009 figure of €48,554.26 however the difference of eleven payments in 2012 versus thirty-eight in 2009 explain the difference in total funding. It is apparent from the data that GAA and football clubs receive the largest grants (for the most part), due to their ability to contribute more money to the grant to be matched, and sports with lower levels of engagement (and profitability in general) such as rowing, gymnastics, swimming, and athletics receive the smallest sized grants. Figure 1 below illustrates the dominance of GAA and football in terms of the number of grants awards. 
Picture
Picture
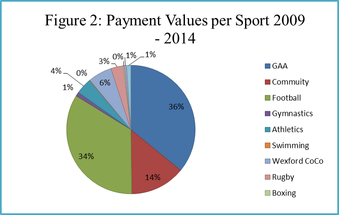
As you might expect, the greater number of grants directed towards GAA and football translates into greater payments to these sports (Figure 2). The GAA received 38% of the number of payments approved and 36% of the total monetary funds paid out. In comparison, football payments accounted for 25% of the number of payments allocated but gained 34% of the total monetary value. This indicates that while there were less football grants, on average they were of a larger value.

What is also evident is football clubs were in the position to contribute more to the grant scheme in this time showing that within Wexford, this is the most profitable sport.

Kathy Stout is a final year Bachelor of Arts student. She is a recipient of a University College Cork Quercus Academic Scholarships and is currently Auditor of the UCC Economics Society.

Irish claims of unfair competition in European rugby ring hollow

22/1/2016

0 Comments

 
by Declan Jordan
Picture
​This has been a pretty dismal season for Irish rugby clubs in European competition. Both Leinster and Munster were out of the competition with two games to play in the group stages. Ulster require a bonus point win and a string of favourable results to emerge from their group. Connacht, in the Challenge Cup, is likely to be the only Irish team in European competition after the Six Nations.
 
It’s probable that this will be the first season since 1998 that an Irish side will not appear in the knock-out stages of the elite European club competition. The situation was very different in the not-so-distant past when Munster and Leinster between them shared five titles in the six seasons between 2006 and 2012. It is important not to overstate the perceived decline of Irish club rugby based on one season (after all Munster and Leinster have appeared in the semi-finals in the last three seasons – sharing that with Toulon, Clermont and Saracens), there are persistent warnings that Irish clubs are no longer in a position to compete, and that this problem is likely to get worse before it gets better. There have been accusing fingers pointed at French Top 14 clubs (particularly Toulon) and English Premiership clubs for distorting the market for rugby playing talent with their large chequebooks – often funded by wealthy owners.
 
Toulon has now won the trophy for the last three years. Over that time their squads have boasted some the greatest names in world rugby – and this year even has former Munster and Ireland talisman Paul O’Connell. It is argued that Pro-12 clubs cannot hope to compete with the financial muscle of the French and English leagues. There are almost daily reports of threats of elite Irish players being lured to France and England to play their rugby. This is likely to be true but the claims that this prevents a level playing field ring a little hollow when the benefits that Irish clubs in particular have enjoyed during their recent successful years.
 
The success of the Irish clubs in Europe was an obvious motivating factor in the changes demanded by French and English clubs in the new qualification rules for the European Cup (formerly the Heineken Cup). In a previous post I noted that elite players at French clubs played more championship games for their clubs than their Irish counterparts.


“Taking a look at three clubs vying for honours domestically and in Europe from each league, there is a clear disparity in how they used a critical resource at flyhalf. Jonny Wilkinson appeared in 24 of Toulon's 28 Top 14 matches (86%) (including play-offs) and all 9 of their Heineken Cup matches on their way to lifting the trophy. Nick Evans played in 20 of Harlequin's 23 Aviva Premiership matches (87%) and 6 of their 7 Heineken Cup matches. Ronan O'Gara played in 50% of Munster's 22 Pro12 games but was available for 6 out of 8 (75%) of Heineken Cup games.”
​Since top players were centrally contracted to the Irish governing body for rugby (the IRFU), players were used more sparingly. There was very little at stake in the ‘domestic’ competition of the Pro12 (or whatever it was called at the time) since Irish clubs were guaranteed their places in the following season’s Heineken Cup. This has now changed so Irish clubs are likely to take the Pro-12 much  more seriously. (In that context, Connacht’s resurgence is even more worrying for the more dominant Irish clubs with limited country representation in European competition).
 
The lack of qualifying pressure and the implicit financial subsidy involved in the central contracting of Irish players were distortions in the “level playing field” in European rugby in Irish clubs’ favour. The lack of concern at these distortions at the time from Irish rugby commentators and officials makes their current protests less credible.
0 Comments

PGA Tour Earnings 2000-2015

18/1/2016

 
By David Butler

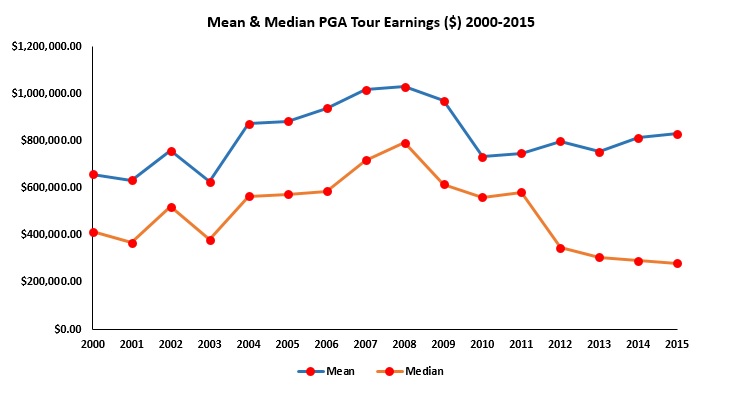
As is the case with other sports such as tennis or horseracing, a golfer’s earnings is dependent on their relative performance. As each players performance can be precisely measured and we have access to all of the information regarding the distribution of the purse, researchers can gain some useful insights into a pure prize economy. The graph below represents the mean and median earnings for golfers on the PGA tour from 2000 to 2015.  
Picture
On average PGA tour golfers earned $658,300 in 2000. They earned $829,726 on average in 2015. During the mid-00’s this mean was higher. Of course these averages mask the substantial variation in the distribution, with the vast majority of golfers earning a relatively modest sum. For instance, in 2015 the top 20% of earners (77 out of 386 PGA tour golfers) accounted for 68.25% ($218m) of the total purse. The standard deviation for most years in the dataset is over $1m. While the size of the pie has increased over the last 15 years, inequality in the earnings distribution has also amplified. It has been greatest in the final two years of the dataset, 2014 and 2015. This growing inequality has largely been driven by more players participating on the tour since 2010.

Given the skewed prize structure of golf tournaments, where prize money is allocated in a descending order from 1st place, it is not surprising that this degree of inequality exists. That said, there is a long list of earners in all PGA tour events, sports such as horseracing see a much shorter list of earners (usually 1st to 4th only), so while golf may be unequal as sports go, it is not the worst.

For a more detailed take on earnings in PGA tour golf see Gerald Scully’s 2002 paper on The Distribution of Performance and Earnings in a Prize Economy in the Journal of Sports Economics.

A Closer Look At Ticket Prices - RWC 2015 Vs Euro 2016

15/1/2016

0 Comments

 
By Robbie Butler

A number of months back I took a look at ticket prices for the 2015 Rugby World Cup held in England and Wales. When the ticket prices were announced for the event by England Rugby 2015 Chief Executive Debbie Jevans stated "we have a range of ticket prices for every budget - for fans and families who want to come to one of the world's greatest sports events”. IRB Chief Executive Brett Gosper added that "there are affordable and accessible options to suit every need".  The extended work can be read here.

This summer Euro 2016 will be staged in France. The UEFA lottery for tickets closes next week and gives us a chance to compare ticket prices across both tournaments. While not a perfect match, the tournaments are very similar in the number of matches played and the categorisation of match tickets into four classes. The 2015 Rugby World Cup consisted of 48 games. Euro 2016 will see 51 played. While the latter has only six group games and no 3rd/4th place play-off (Bronze Final), it does include a Round of 16.
​
Ticket prices in each category, for both events, are presented below. These are joined with an additional table calculating the difference in prices from one tournament to the other, across each ticket category. (The price of Group Phase tickets is calculated using a weighted average and is particularly relevant for the RWC, as six different price structures were used during the pool stages of the competition). 
Picture
With the exception of a single category (Group/Last 16 tickets in Category B/Category 2) ticket prices at RWC 2015 are more expensive than the equivalent tickets at Euro 2016. In some cases the differences are quite large. For example, a quarter-finals ticket at the RWC is at least €90 more expensive than at Euro 2016. These differences become even larger for the semi-finals and final.

​The RWC had a total stadium capacity of over 610,000 seats. The Euros are somewhat lower at 496,431 seats. That said, there are more tickets available for the latter, with just over 2.67 million seats for the 51 game football tournament as opposed to 2.59 million for the 40 games at the RWC. A difference of roughly 3%. This may be one reason why Euro 2016 tickets are cheaper, although on balance, the difference between the two tournaments seems quite large given that just 3% more tickets are available.  Income levels may be generally higher amongst rugby supporters, and greater purchasing power might enable RWC organisers to charge higher prices. Or it might simply be the case that the public are prepared to pay more to watch rugby than football.

Regardless of the reasons, football supporters should count themselves lucky that they will not be faced with the same ticket prices in France that many rugby fans faced when travelling to England Wales and last year. 
0 Comments

EURO 2016 on RTE

11/1/2016

 
By David Butler

Recently RTE, Ireland's national television and radio broadcaster, announced that they had won the rights to broadcast all fifty-one Euro 2016 matches as part of a European Broadcasting Union centrally negotiated contract with UEFA.  This is good news for soccer enthusiasts. An awful lot of sport will be crammed into one month, images of which will be beamed live into TV sets from the 10th of June onward. For others, I'm sure the forthcoming summer of sport (the Rio Olympics will also be screened) will be a penance and could test relationships.

Below are the numbers regarding viewing times and some comparisons which put into context the extent of Euro 2016 coverage that could possibly be aired on RTE.

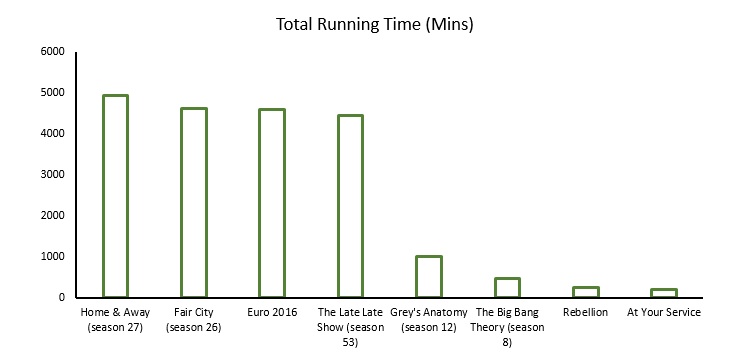
If the channel chooses to make all of the content available via TV broadcasts or online, a soccer addict could view approximately 4590 minutes of action on RTE over the month . This figure is a minimum and doesn't take into account opening/closing ceremonies, added time, extra time, highlight shows, the musings of any pundit or the superb Après Match. While it may not be practical to watch every game live (as the last two group games kick off together), I'm sure the RTE player could accommodate those that want to see every minute.

To put this number in perspective, season twenty seven of the Australian soap Home and Away aired by RTE lasted 4935 minutes, that's two hundred and thirty five episodes that ran for twenty one minutes each. In terms of just the ninety minutes of soccer, if one was to watch every Euro 2016 match it would be similar to watching close to an entire season of Home and Away in one month. Season fifty three of the Late Late Show, Ireland's premier national talk show, lasted 4440 minutes, that's thirty seven episodes lasting one hundred and twenty minutes each. Again, spending this time with Ryan Tubridy over one month is not far off the Euro 2016 footage that will be available to RTE.

In terms of other popular drama and entertainment shows on RTE, watching the entire Euro 2016 would equate to viewing about two hundred and thirty episodes of The Big Bang Theory or about one hundred and fifteen episodes of Grey’s Anatomy. It would be the equivalent to watching RTE's latest Drama on the events of 1916, Rebellion, about 18 times or watching Francis Brennan rescue about one hundred and ninety two ailing guesthouses in At Your Service!

Of course, the European Championships only happens once every four years, so perhaps we should only think of a quarter of this broadcast time. For me these numbers put into perspective what those who have no preference for soccer have to endure for June 2016. The only silver lining for those that don’t like soccer...4590 minutes is slightly less soccer than the World Cup.  

This entry is an adaption of a previous post that considered screening times on RTE for the 2014 World Cup 
Picture

    Archives

    February 2023
    January 2023
    December 2022
    November 2022
    October 2022
    September 2022
    August 2022
    July 2022
    June 2022
    May 2022
    April 2022
    March 2022
    February 2022
    January 2022
    December 2021
    November 2021
    October 2021
    September 2021
    August 2021
    July 2021
    June 2021
    May 2021
    April 2021
    March 2021
    February 2021
    January 2021
    December 2020
    November 2020
    October 2020
    September 2020
    August 2020
    July 2020
    June 2020
    May 2020
    April 2020
    March 2020
    February 2020
    January 2020
    December 2019
    November 2019
    October 2019
    September 2019
    August 2019
    June 2019
    May 2019
    April 2019
    March 2019
    February 2019
    January 2019
    December 2018
    November 2018
    October 2018
    September 2018
    August 2018
    July 2018
    June 2018
    May 2018
    April 2018
    March 2018
    February 2018
    January 2018
    December 2017
    November 2017
    October 2017
    September 2017
    August 2017
    July 2017
    June 2017
    May 2017
    April 2017
    March 2017
    February 2017
    January 2017
    December 2016
    November 2016
    October 2016
    September 2016
    August 2016
    July 2016
    June 2016
    May 2016
    April 2016
    March 2016
    February 2016
    January 2016
    December 2015
    November 2015
    October 2015
    September 2015
    August 2015
    July 2015
    June 2015
    May 2015
    April 2015
    March 2015
    February 2015
    January 2015
    December 2014
    November 2014
    October 2014
    September 2014
    August 2014
    July 2014
    June 2014
    May 2014
    April 2014
    March 2014
    February 2014
    January 2014
    December 2013
    November 2013
    October 2013
    September 2013
    August 2013
    July 2013

    About

    This website was founded in July 2013.

    RSS Feed

    Categories

    All
    American Football
    Athletics
    Baseball
    Basketball
    Behavioural Economics
    Boxing
    Broadcasting
    Competitive Balance
    Cricket
    Cycling
    Darts
    David Butler
    Declan Jordan
    Drugs
    Ed Valentine
    Epl
    Esports
    Expenditure
    F1
    Fifa World Cup
    Finances
    Funding
    Gaa
    Gaelic Games
    Gambling
    Game Theory
    Gary Burns
    Geography
    Golf
    Greyhound Racing
    Guest Posts
    Horse Racing
    Impact Studies
    John Considine
    John Eakins
    League Of Ireland
    Location
    Media
    Mls
    Mma
    Olympics
    Participation
    Paul O'Sullivan
    Premier League
    Regulation
    Research
    Robbie Butler
    Rugby
    Simpsonomics
    Snooker
    Soccer
    Spatial Analysis
    Sporting Bodies
    Stephen Brosnan
    Swimming
    Taxation
    Teaching
    Technology
    Tennis
    Transfers
    Uefa
    Ufc
    World Cup
    Wwe

Related

The website is not formally affiliated to any institution and all of the entries represent the personal views and opinions of an individual contributor. The website operates on a not-for-profit basis. For this reason we decline all advertisement opportunities. 

Contact

To contact us email sportseconomics2013@gmail.com or find us on Twitter @SportEcon.