The Economics of Sport
  • Sports Economics
  • About
  • Workshop
  • Selected Publications
  • Book Reviews
  • Media
  • A Primer on Gaelic Games
  • Upcoming Events
  • Education
  • Resources & Links
  • Data

The Pareto Distribution in Sport

30/11/2015

 
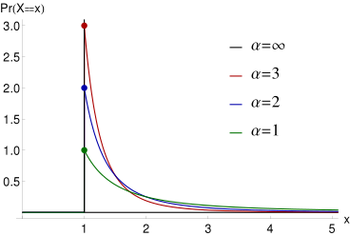
PictureThe Pareto Distribution
By David Butler

The Pareto distribution is quite famous in Economics and is named after the Italian polymath Vilfredo Pareto (1848-1923). Mathematically,  the distribution is referred to as a power law probability distribution (see graph) and it is applicable to phenomena in both the natural and social sciences.

The distribution has its origins in the income data Pareto  published in 1897 when he explored how wealth across society was allocated. Pareto found that the income distribution was not a bell shaped curve. There was many people at the bottom end of the wealth distribution, a wide middle class and some super wealthy individuals. His distribution is usually explained through the 80-20 rule of thumb.  80% of the wealth is usually owned by 20% of the people. This is usually a good approximation.

A fun and accessible way to  learn about the Pareto (and Pareto-like) distribution is through sports data.

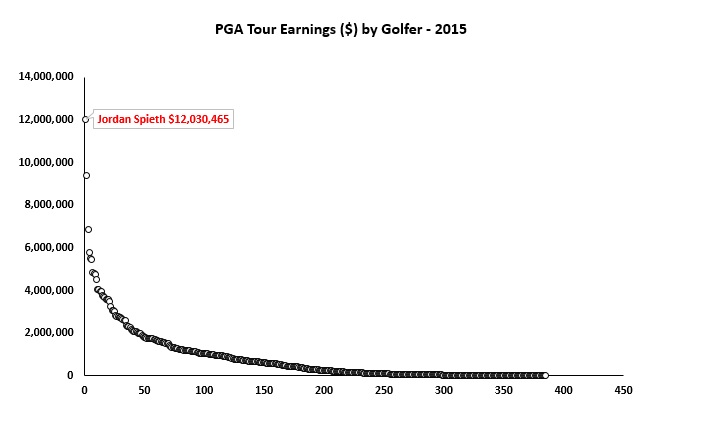
The graph below shows the PGA Tour Earnings for Golfers in 2015. Out of the 385 golfers on the tour Jordan Spieth has the highest earnings.  Like Spieth, there are a few very high earners but these are in the minority (e.g. Jason Day, Bubba Watson, Rickie Fowler, Dustin Johnson, Justin Rose and Rory McIlroy). There are some golfers earning a reasonable sum, the middle-class,  and then a glut of lower earners. The top 20% (77 Golfers) earned $218,010,501 together, that’s 68% of the total earnings. The remaining 80% (308) golfers divided the remaining $101,434,093 between them.
Picture
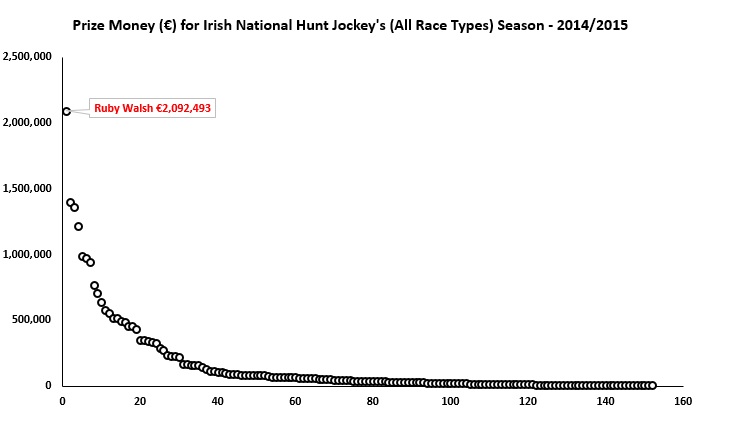
What about a different sport? The second graph shows the prize money earned by Irish National Hunt Jockey's (all race types) for the 2014-2015 season. While the earnings are far less than in golf, we still see a similar pattern. Ruby Walsh tops the list out of 152 jockeys. Bryan Cooper, Jonathon Burke,  Paul Townend and  Paul Carberry all perform very well too.  The top 20% (30) of the jockeys shared €18,785,125 between them. That’s 78% of the pie.  This left only €5,211,170 worth of earnings for the other 122 jockeys.
Picture
Of course, the more interesting question is why do such patterns emerge? The answer to this question has puzzled social scientists for years and is far too complex to address in detail here. To hazard a guess, these outcomes are not unicausal; no exclusive factor is probably causing the outcomes above. Albeit somewhat of a weasel word, the skewed distributions are often referred to as an ‘emergent property' of a system. Small, random differences at the start can amplify themselves and lead to significant differences down the road.

Comments are closed.

    Archives

    March 2021
    February 2021
    January 2021
    December 2020
    November 2020
    October 2020
    September 2020
    August 2020
    July 2020
    June 2020
    May 2020
    April 2020
    March 2020
    February 2020
    January 2020
    December 2019
    November 2019
    October 2019
    September 2019
    August 2019
    June 2019
    May 2019
    April 2019
    March 2019
    February 2019
    January 2019
    December 2018
    November 2018
    October 2018
    September 2018
    August 2018
    July 2018
    June 2018
    May 2018
    April 2018
    March 2018
    February 2018
    January 2018
    December 2017
    November 2017
    October 2017
    September 2017
    August 2017
    July 2017
    June 2017
    May 2017
    April 2017
    March 2017
    February 2017
    January 2017
    December 2016
    November 2016
    October 2016
    September 2016
    August 2016
    July 2016
    June 2016
    May 2016
    April 2016
    March 2016
    February 2016
    January 2016
    December 2015
    November 2015
    October 2015
    September 2015
    August 2015
    July 2015
    June 2015
    May 2015
    April 2015
    March 2015
    February 2015
    January 2015
    December 2014
    November 2014
    October 2014
    September 2014
    August 2014
    July 2014
    June 2014
    May 2014
    April 2014
    March 2014
    February 2014
    January 2014
    December 2013
    November 2013
    October 2013
    September 2013
    August 2013
    July 2013

    About

    This website was founded in July 2013.

    RSS Feed

    Categories

    All
    American Football
    Athletics
    Baseball
    Basketball
    Behavioural Economics
    Boxing
    Broadcasting
    Competitive Balance
    Cricket
    Cycling
    Darts
    David Butler
    Declan Jordan
    Drugs
    Ed Valentine
    Epl
    Expenditure
    F1
    Fifa World Cup
    Finances
    Funding
    Gaa
    Gaelic Games
    Gambling
    Game Theory
    Gary Burns
    Geography
    Golf
    Greyhound Racing
    Guest Posts
    Horse Racing
    Impact Studies
    John Considine
    John Eakins
    League Of Ireland
    Location
    Media
    Mls
    Mma
    Olympics
    Participation
    Paul O'Sullivan
    Premier League
    Regulation
    Research
    Robbie Butler
    Rugby
    Simpsonomics
    Snooker
    Soccer
    Spatial Analysis
    Sporting Bodies
    Stephen Brosnan
    Swimming
    Taxation
    Teaching
    Technology
    Tennis
    Transfers
    Ufc
    World Cup
    Wwe

Related

The website is not formally affiliated to any institution and all of the entries represent the personal views and opinions of an individual contributor. The website operates on a not-for-profit basis. For this reason we decline all advertisement opportunities. 

Contact

To contact us email sportseconomics2013@gmail.com or find us on Twitter @SportEcon.