By Sean O'Connor
The recent release by the Central Statistics Office (CSO) of a rich variety of data has seen a number of blogs examining the makeup of Ireland’s participation levels in various different sporting activity.
Only last week Robbie Butler examined the gender and regional breakdown of a variety of sporting activity released through the Household Budget Survey’s Sports Module (link to the blog can be found here).
Although I wish to use some of the data analysed in the piece above, I will approach it from a different angle; that of examining the location quotients of sport participation within the various regions of Ireland. Location Quotients (LQ) are a measure utilised in Economic Geography which typically analyse the employment concentration of a given industry in a region relative to that of the national level. Below highlights the equation.
An LQ of 1 means that an industry represents the same share of local employment as the national economy average. An LQ > 1 indicates an industry is more concentrated in a specific geographic area than the national average.
One of the great things about these tools, is that they can be adapted in order to fit a specific need. So rather than focusing on employment, we can use the Location Quotient to determine what particular sports are concentrated in what regions of Ireland. Below illustrates the NUTS-3 breakdown of regions within Ireland.
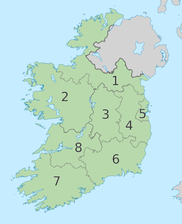
1. Border Region (Cavan, Donegal, Leitrim, Louth, Monaghan, Sligo)
2. West Region (Mayo, Roscommon, Galway)
3. Midlands Region (Laois, Longford, Offaly, Westmeath)
4. Mid-East Region (Kildare, Meath, Wicklow)
5. Dublin Region (Dun Laoghaire-Rathdown, Fingal, South Dublin & Dublin City)
6. South-East Region (Carlow, Kilkenny, South Tipperary, Wexford, Waterford)
7. South West Region (Kerry, Cork)
8. Mid-West Region (Clare, North Tipperary, Limerick)
Table 1 below highlights the Location Quotients generated for Sports Participation levels by main sport participated in.
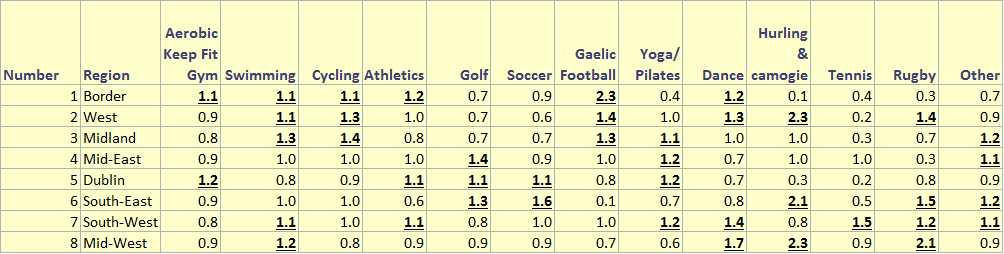
As mentioned previously a value greater than 1 indicates that sports participation is more concentrated in a particular region than Ireland as a whole. For instance, Cycling in the Midland region has a value of 1.4, indicating participation levels of Gaelic Football are 1.4 times more concentrated in the Midland region than Ireland as a whole.
Focusing on the team sports of Soccer, Gaelic Football, Hurling & camogie, and Rugby. Participation in Soccer is highly concentrated in Dublin, as well as the South-East. In fact, Soccer is more concentrated in the South-East than any other region. Although one might imagine Soccer participation to be more concentrated in the Dublin than the rest of the country, given the majority of our national players are born there, the high South East score is interesting, given one wouldn’t associate it with being a Soccer ‘hotspot’.
The regions which make up the Border, Midlands, and West all have LQ scores greater than 1 in Gaelic Football, indicating a strong concentration in participation levels, relative to Ireland. Given some of the counties which make up these regions, Donegal and Mayo being the most prominent, it’s not difficult to imagine why participation levels may be more concentrated here.
Hurling & camogie scored an LQ above 1 in three regions. These are West (2.3), South-East (2.1), and Mid-West (2.3). Again, when one examines some of the counties to be found in these regions i.e. Galway, Kilkenny, Wexford, Waterford, Tipperary it’s not at all surprising at Hurling & Camogie’s high concentration of participation to be found here.
Finally, Rugby is highly concentrated in four regions in Ireland. The region which houses the home of Munster Rugby, Limerick City scored the highest LQ with 2.1. Once again a higher concentration was witnessed in the South-East that what one may have expected, given the counties which encompass it. It might also be surprising the low concentration levels found in Dublin, given its home to numerous rugby clubs.
Sean O'Connor is a currently working as a research assistant at the Department of Economics, University College Cork.
 RSS Feed